PI has recovered slightly, but here are the key levels to watch | Credit: Hameem Sarwar
Share
Key Takeaways
PI’s 35% rally to $0.20 faded quickly after the Feb. 15 node upgrade went live.
On-chain data shows that holders moved 2.9 million PI coins to exchanges.
Technically, the 4-hour chart shows a breakout from a descending channel.
Pi Network (PI) is giving back its weekend gains fast.
After surging more than 35% to $0.20, the cryptocurrency has dropped roughly 15% over the last 24 hours and is now trading near $0.17.
In this analysis, CCN explains why the PI coin failed to extend the rally into the new weeks and what lies ahead for the cryptocurrency.
What Happened?
According to CCN’s findings, the PI coin rally happened due to anticipation around the Feb. 15 mandatory node upgrade.
That deadline acted as a speculative magnet. However, once version 19.6 was successfully rolled out, short-term traders moved to lock in profits.
As a result, momentum faded almost immediately. At the same time, supply pressure intensified.
On-chain data shows that roughly 2.9 million PI tokens were reportedly sent to centralized exchanges in the past 24 hours, increasing near-term sell liquidity.
February also marks the largest monthly unlock of the year, with 189 million PI scheduled to enter circulation.
PI Breaks Down After Rally
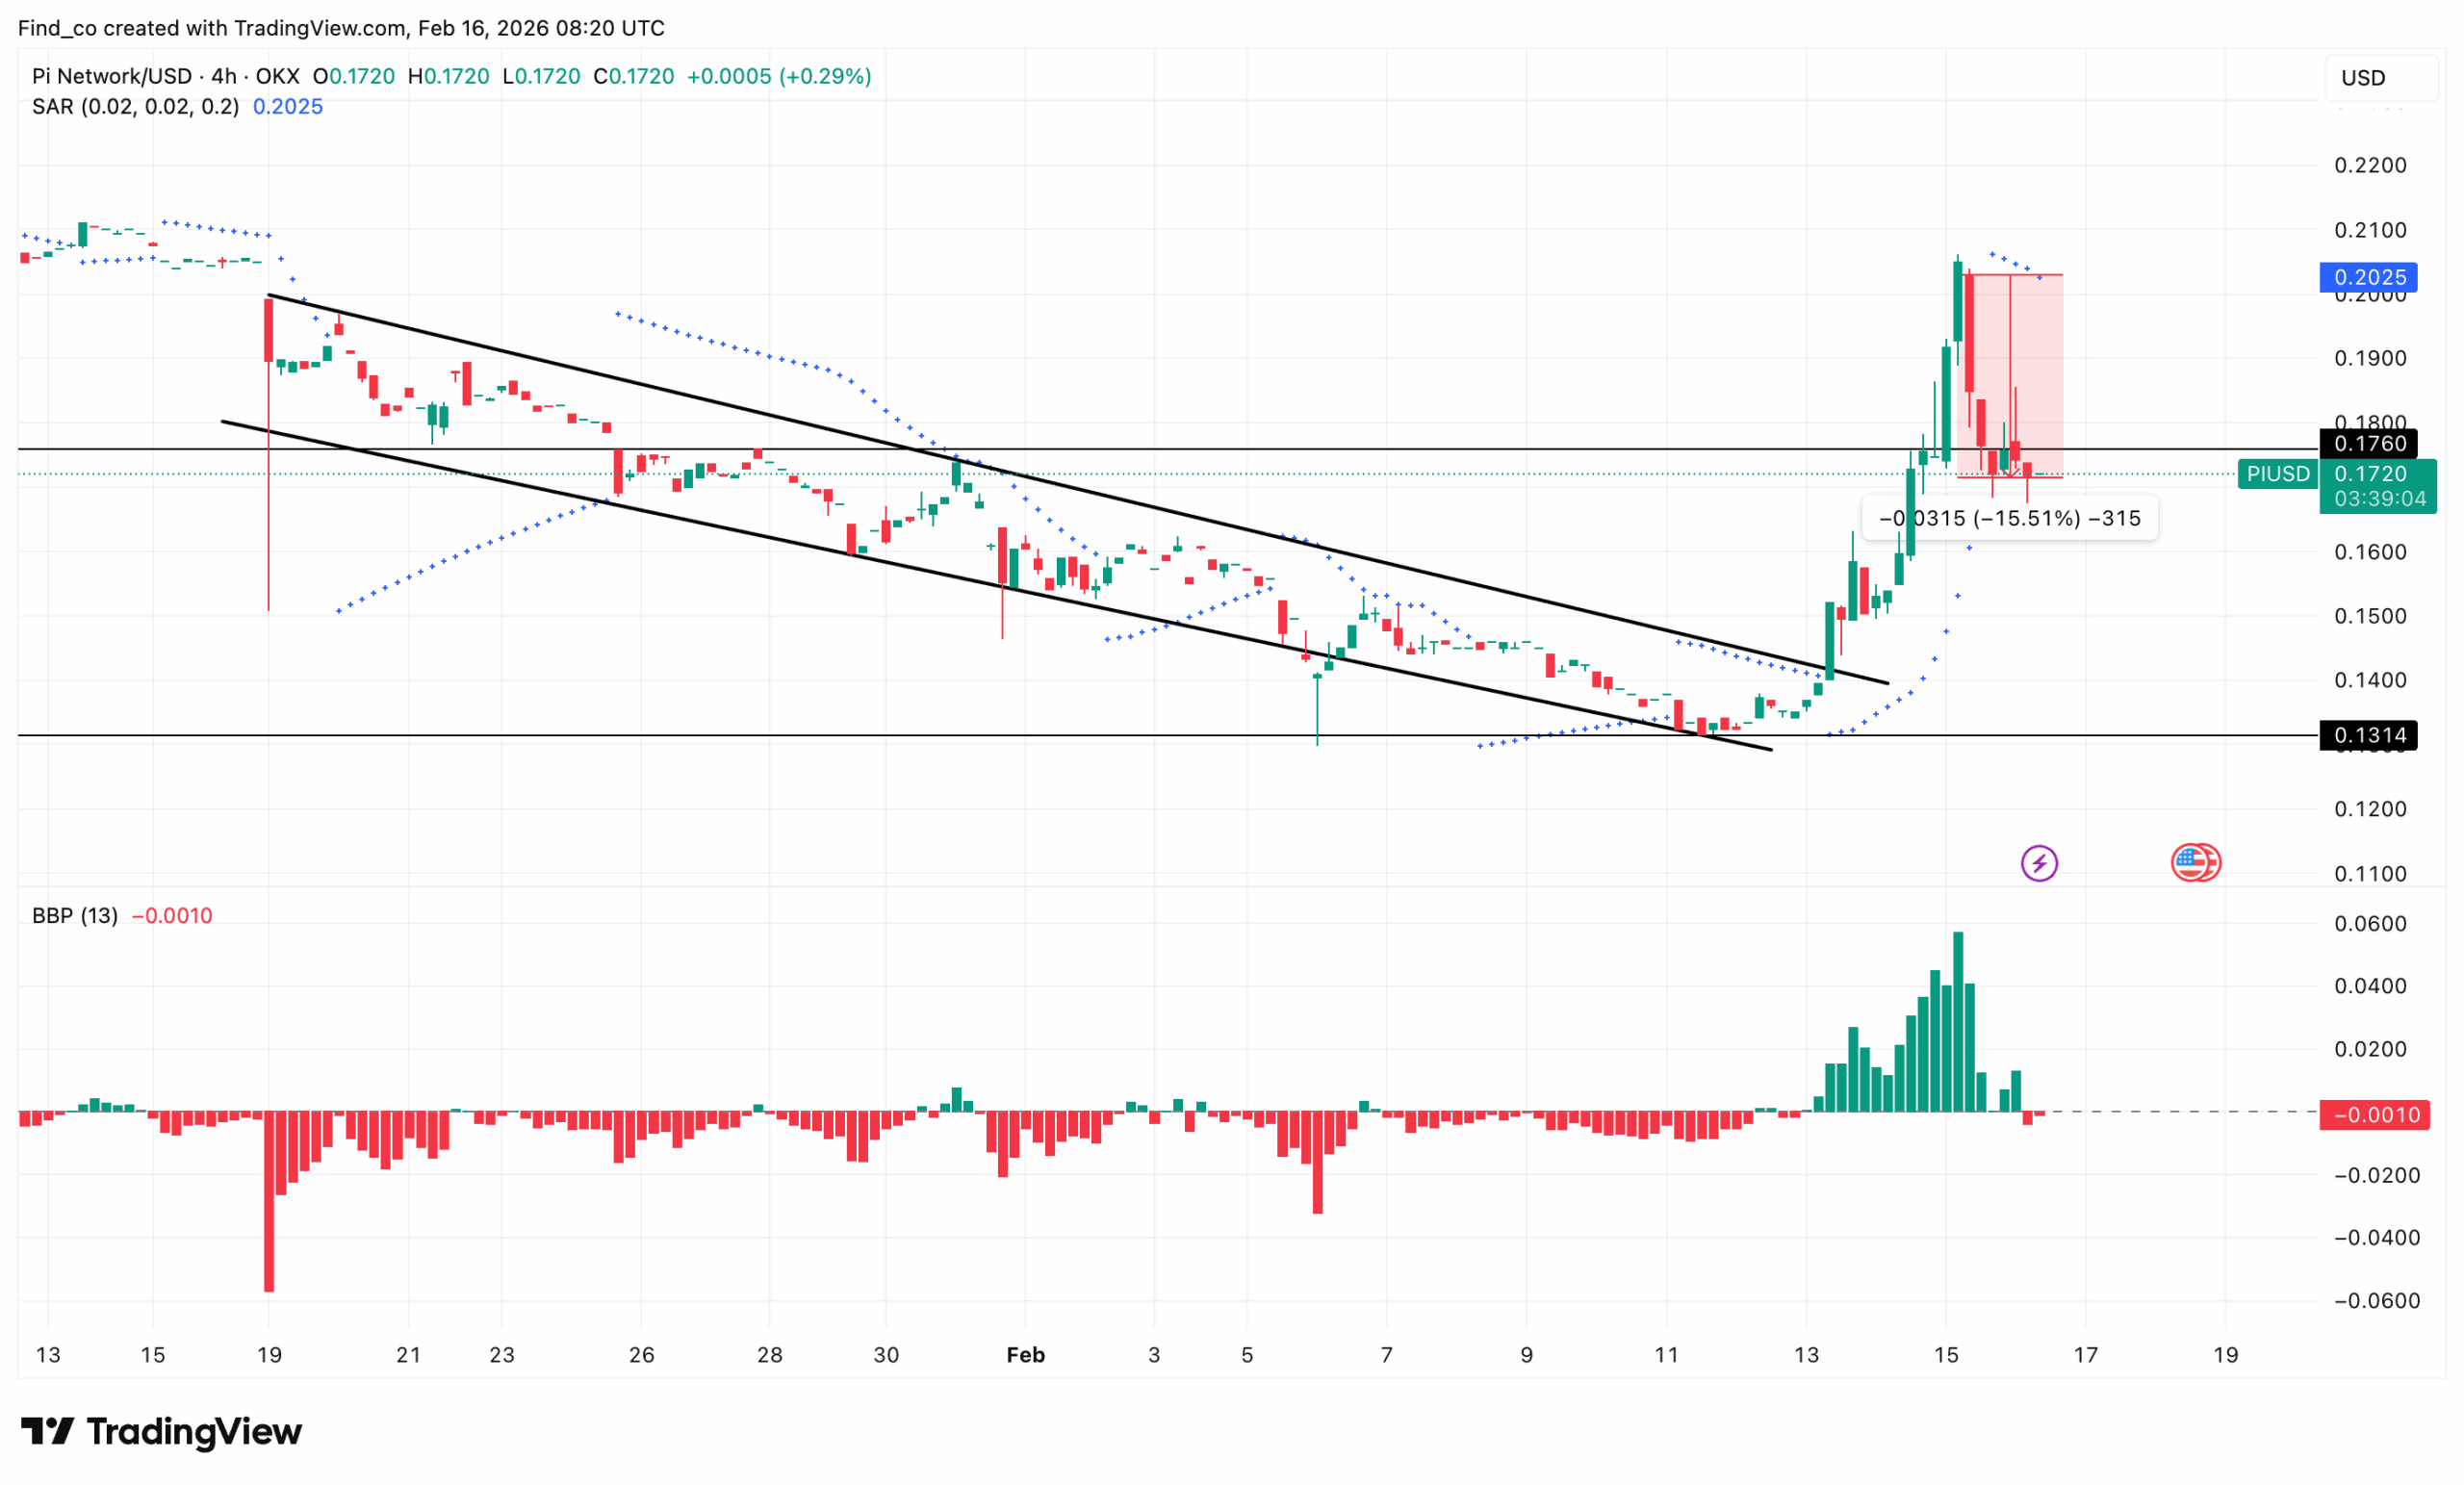
Technically, the rejection was clear. On the 4-hour chart, specifically, the move toward $0.20 now resembles a double top.
Volume tells the same story. The weekend spike came on relatively thin market participation, suggesting the move lacked strong backing.
A closer look at the chart shows that PI had been trading inside a descending channel for weeks, making consistent lower highs and lower lows.
That structure finally broke to the upside with a strong candle that cleared the upper trendline toward the $0.20 region.
The breakout invalidated the short-term bearish structure and shifted momentum in the bulls’ favor.
After the spike, the PI coin price immediately pulled back roughly 15%, as shown in the highlighted red retracement zone.
That kind of retracement following a vertical move typically signals profit-taking.
The key now is whether PI’s price can hold above the former channel resistance, which should act as new support around $0.16.
The Parabolic Stop And Reverse (SAR) has flipped bullish following the breakout, reinforcing the idea that the trend has shifted at least on the 4-hour timeframe.
Furthermore, the Bull Bear Power (BBP) also showed strong positive expansion during the breakout, confirming that buyers stepped in.
Should this remain the same, PI remains above the $0.15 zone and does not re-enter the descending channel, the breakout structure remains valid.
Reclaiming $0.18 with strength would open the door for another attempt at the $0.20 highs. However, $0.15 would weaken the bullish thesis and risk a full breakdown.
PI Price Forecast: What Lies Ahead
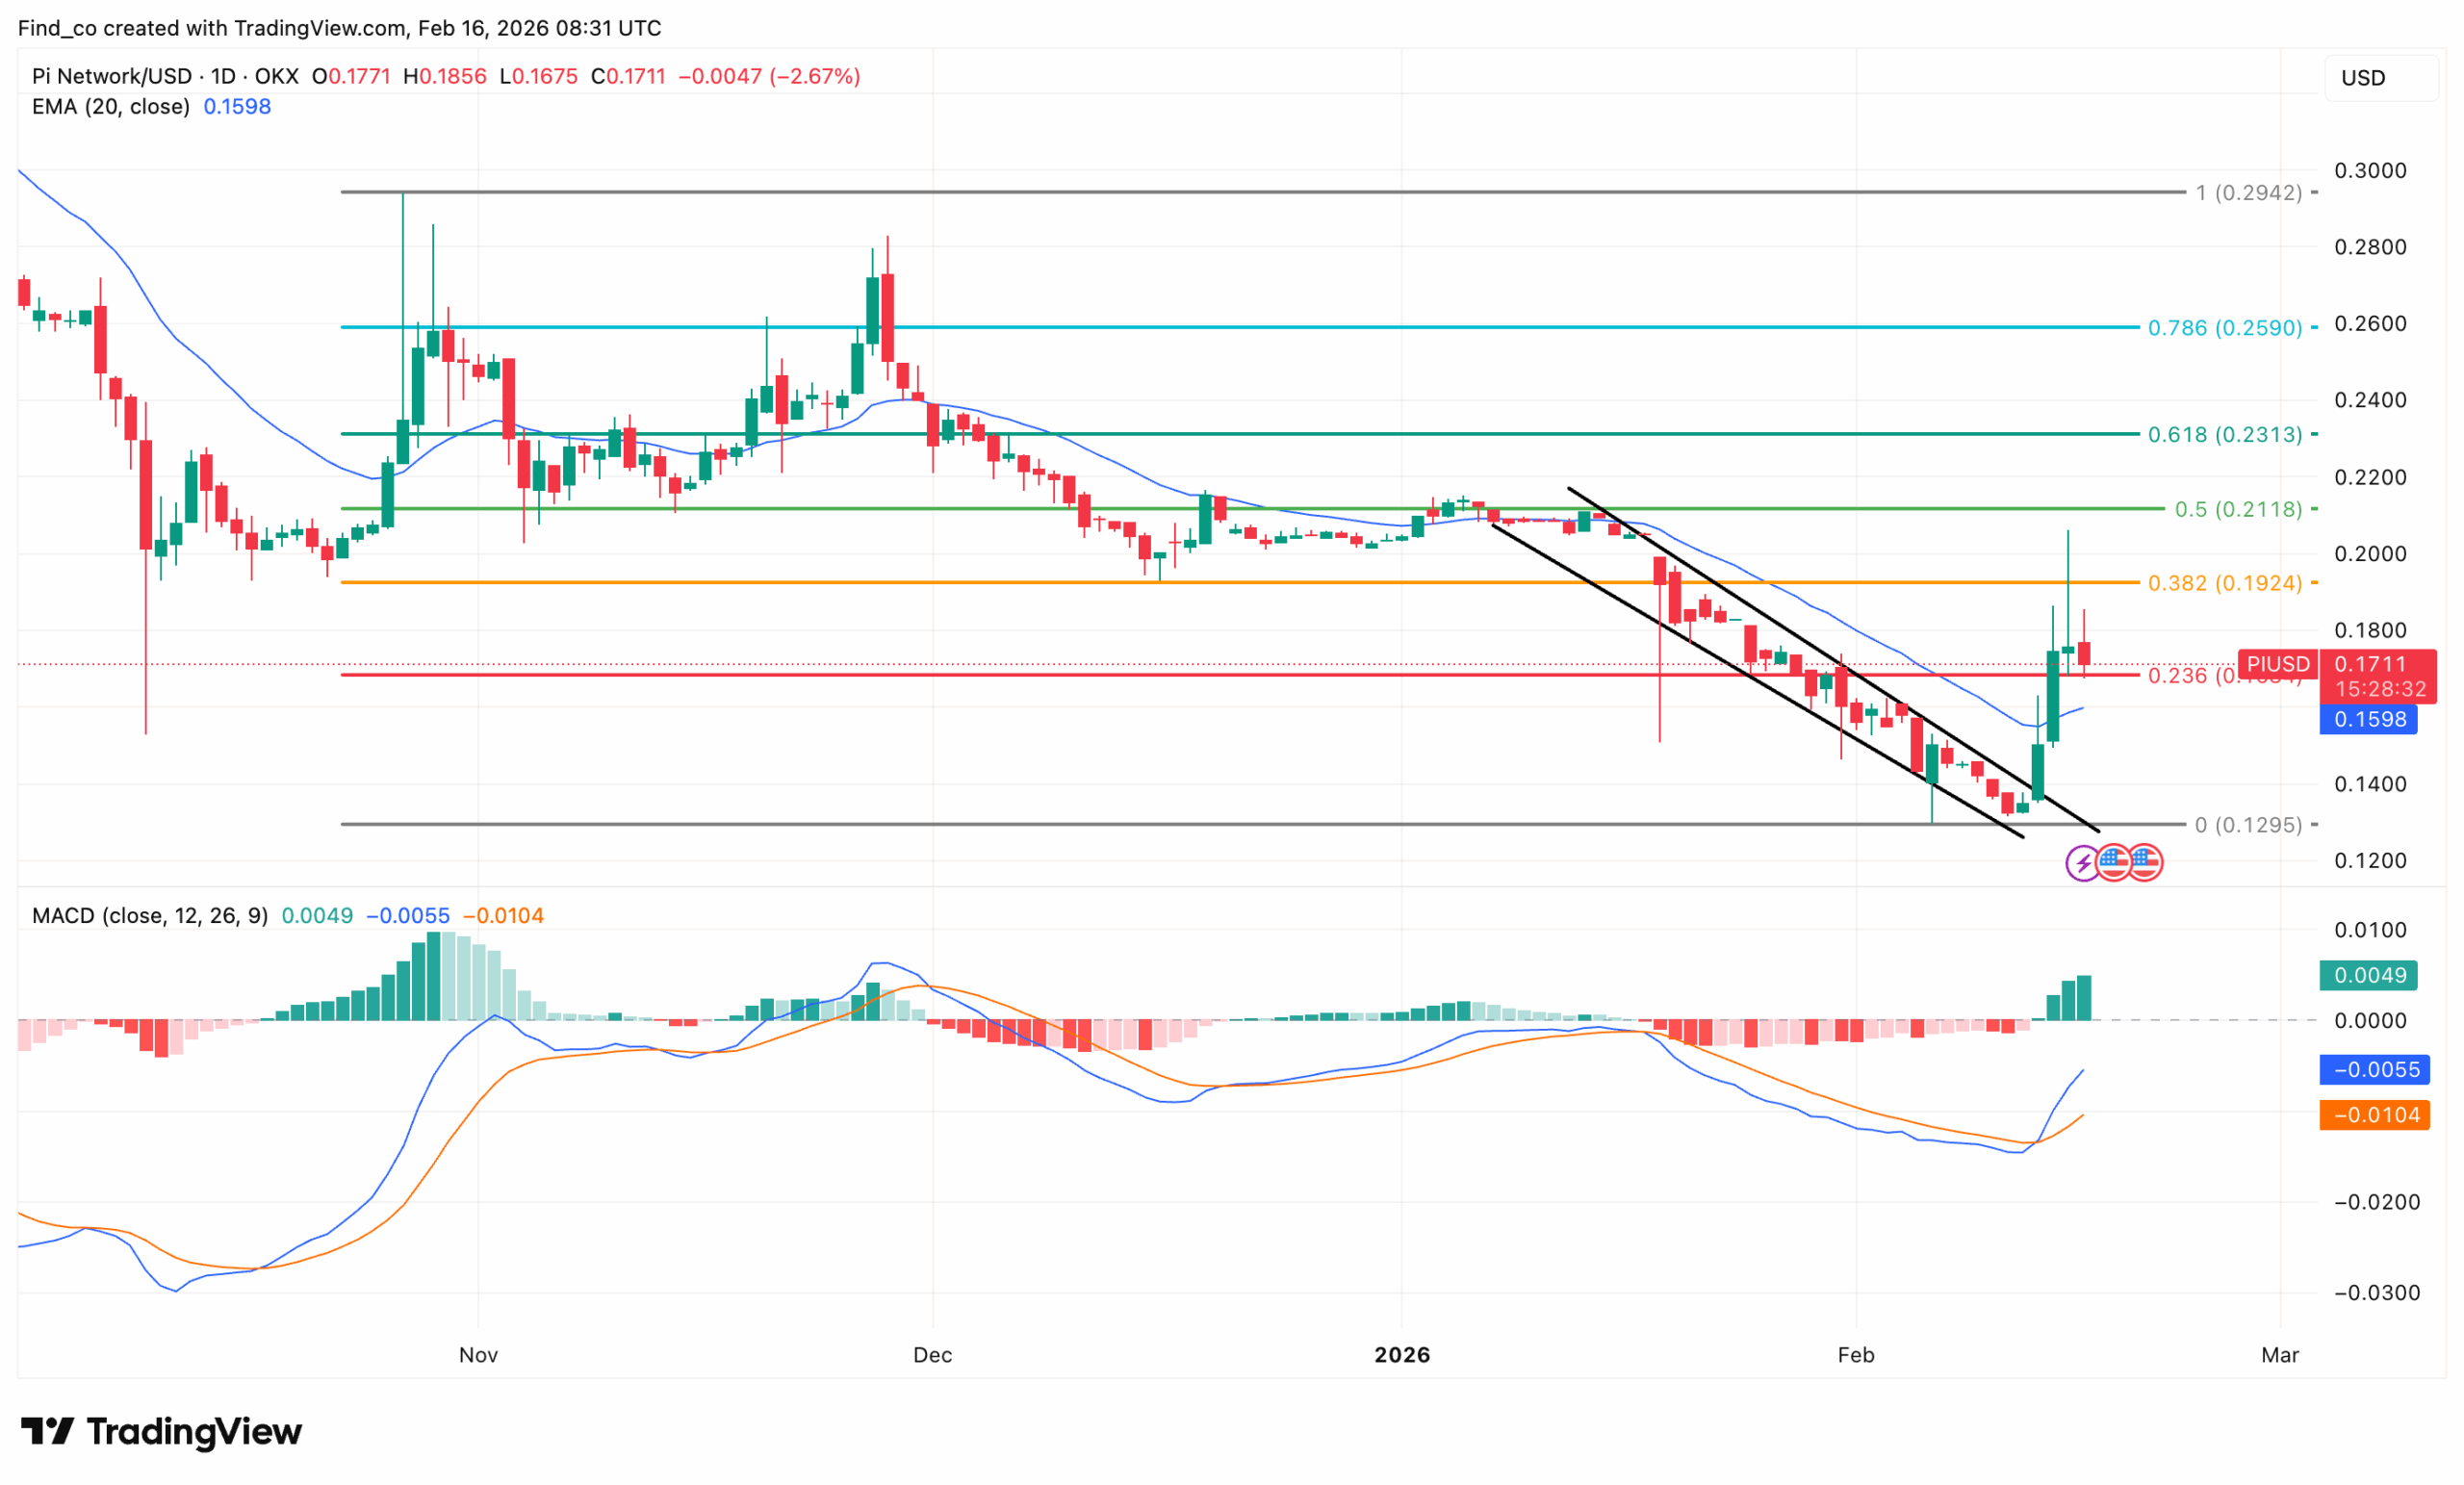
On the daily timeframe, the PI coin is showing a meaningful shift compared to the lower timeframe.
At the time of writing, the Pi Network price had been confined in a descending channel with consistent lower highs and lower lows.
However, the recent move broke above channel resistance, reclaimed the 0.236 Fibonacci level around $0.17.
As a result, it pushed back above the 20 EMA near $0.16. If PI’s price holds above this region, the breakout remains valid, and the market can continue rotating higher.
Alternatively, if it loses this level, the move is likely to fail as a breakout and open the door to a retest of the $0.13 support.
On the upside, the next important resistance sits around $0.19 at the 0.382 Fibonacci level.
A break above that would expose the $0.21 area at the 0.5 retracement, followed by stronger resistance near $0.23 at the 0.618 level.
In addition, the Moving Average Convergence Divergence (MACD) has remained in the positive region.
Disclaimer:
The information provided in this article is for informational purposes only. It is not intended to be, nor should it be construed as, financial advice. We do not make any warranties regarding the completeness, reliability, or accuracy of this information. All investments involve risk, and past performance does not guarantee future results. We recommend consulting a financial advisor before making any investment decisions.
Victor Olanrewaju is a crypto analyst and reporter at CCN with deep roots in on-chain research and technical analysis. His crypto journey began in 2017, but it was the 2020 Uniswap airdrop that sparked a full-time pivot into the space.
With a foundation in copywriting, Victor honed his craft creating high-converting content for leading crypto brokers — most notably an XRP price prediction that ranked #1 on Google during the 2021 bull run.
He later joined AMBCrypto in 2022, where he combined storytelling with technical and on-chain analysis to cover key market narratives.
In 2024, he expanded his expertise at BeInCrypto, collaborating with analysts and using tools like Glassnode, Santiment, and IntoTheBlock to break down Bitcoin and altcoin trends.
At CCN, Victor covers the top cryptocurrencies, memecoins, macro shifts, blending real-time insights with deep-dive metrics.
He holds a Bachelor’s degree in Physics from the University of Ibadan, equipping him to simplify complex data for a wide audience. Follow his work or connect on LinkedIn or X.