Ondo Finance is gaining momentum as institutional adoption of tokenized real-world assets accelerates.
ONDO’s breakout above resistance has improved the structure, with indicators targeting $1.40.
Despite strong ecosystem growth and rising TVL, ONDO still faces risks from token unlocks.
Ondo Finance is increasingly emerging as one of the most closely watched projects in the tokenized real-world asset sector, as growing institutional interest continues to influence parts of the crypto market.
With traditional financial firms exploring blockchain-based treasury products and yield-bearing assets, some analysts believe ONDO could benefit from a broader shift toward institutional adoption in 2026.
If momentum in the sector accelerates, the cryptocurrency may attempt a move beyond the $3 mark.
But can that happen? Let’s find out in this ONDO price prediction.
Ondo Price Prediction
Here are the ONDO price predictions from CCN on May 11, 2026. It is important to remember that price forecasts, especially for volatile assets like crypto, can be wrong.
The predictions are based on the current state of indicators, while the minimum and maximum targets depend on price movements throughout the year.
Minimum ONDO Price Prediction
Average ONDO Price Prediction
Maximum ONDO Price Prediction
2026
$0.25
$1.40
$2.72
2027
$1.93
$3.87
$5.00
2030
$3.69
$7.36
$10.27
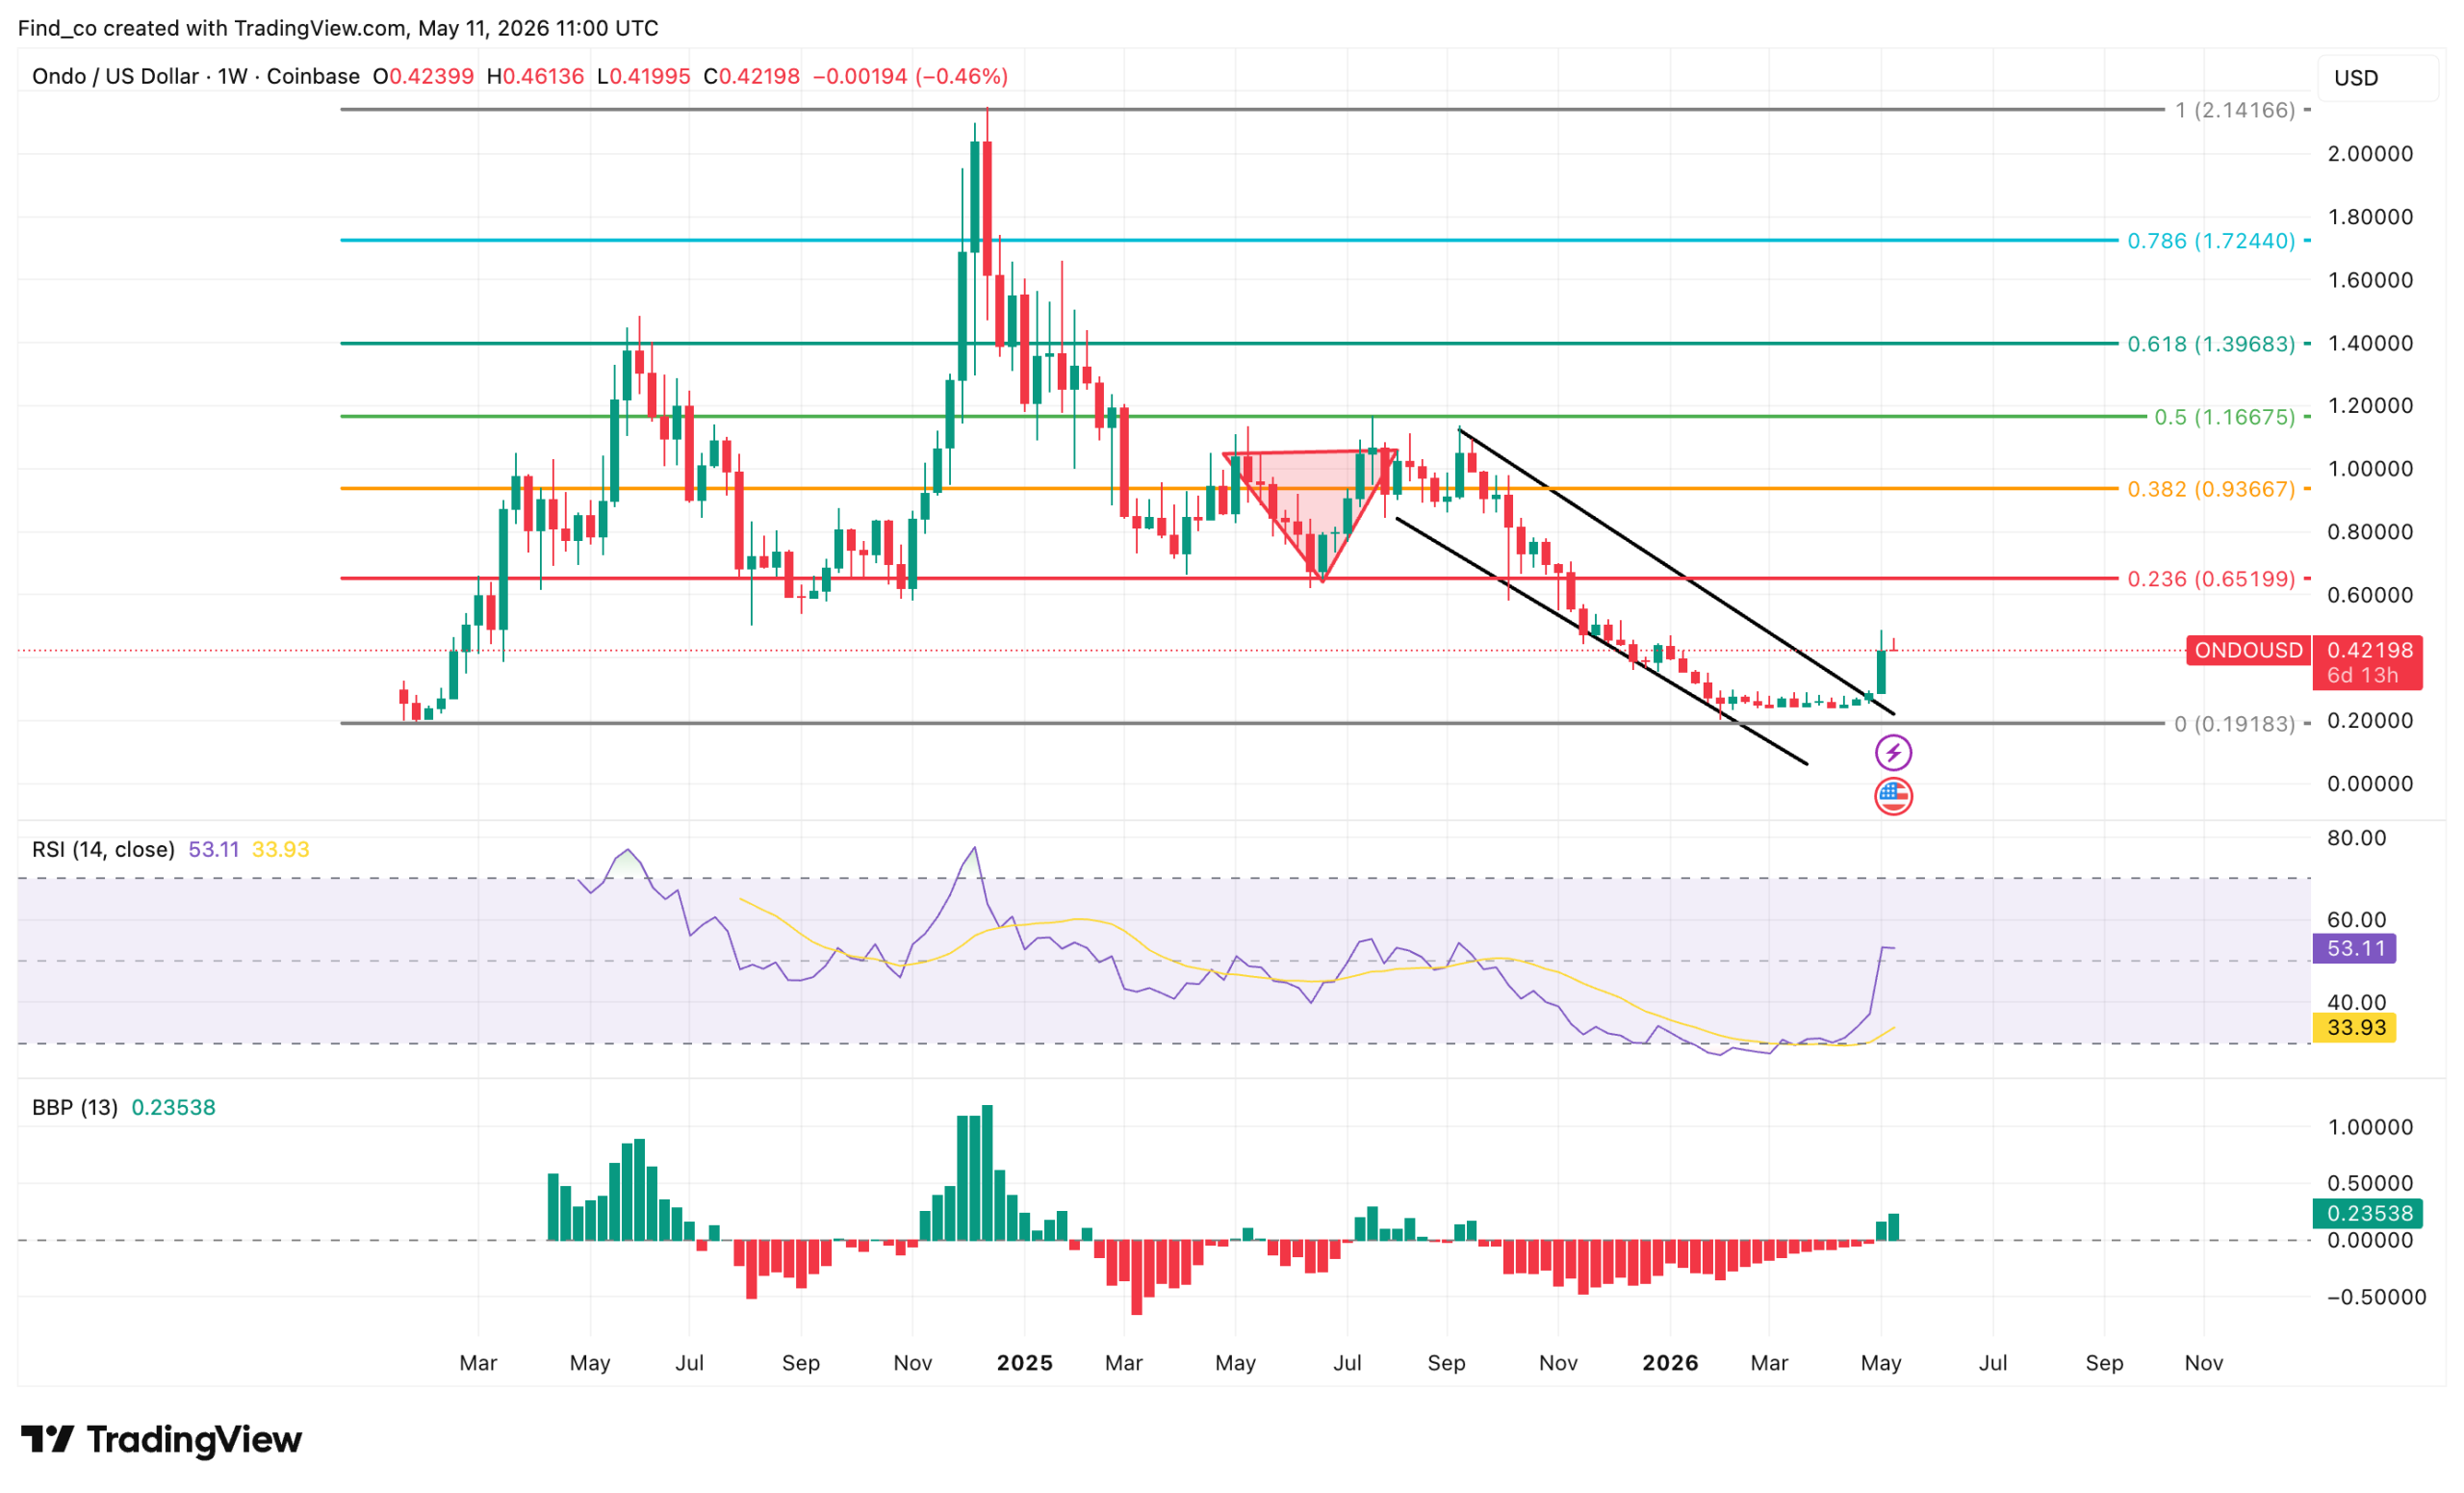
Meanwhile, the weekly timeframe presents a broader macro recovery story. ONDO’s price appears to be rebounding from its long-term Fibonacci support near $0.20 after enduring an extended corrective phase.
Notably, bulls have invalidated the descending channel that had dominated price action for months, triggering a reversal candle that has pushed prices to current levels.
In addition, the Relative Strength Index (RSI) climbed above its signal line as it exited oversold territory, reflecting improving market strength after prolonged seller exhaustion.
Get These Top Crypto Casino Offers Now!
Sponsored
Disclosure
We sometimes use affiliate links in our content, when clicking on those we might receive a commission at no extra cost to you. By using this website you agree to our terms and conditions and privacy policy.
The Bull Bear Power (BBP) also turned positive, reinforcing signs that bearish dominance is beginning to fade.
However, the recovery still faces a critical test ahead. ONDO remains below the major Fibonacci resistance cluster between $0.66 and $0.94, an area that previously acted as a heavy distribution zone during the broader decline.
Therefore, bulls must sustain momentum, defend the $0.40 support region, and maintain rising volume conditions to confirm that the current advance is evolving into a genuine macro trend reversal.
In a highly bullish market, the ONDO price prediction for the next few months could be around $1.40.It could also extend to $1.72.
On the contrary, if bears take control, this might not happen. Instead, the altcoin might decline below $0.45.
ONDO Price Prediction 2026
Given developments around the project and the buying volume, ONDO could average $1.40 in 2026.
This same year, the altcoin could rise to a new all-time high and close in on $3. However, a decline in bullish momentum could invalidate the outlook, possibly dragging it back to $0.25.
ONDO Price Prediction 2027
By 2027, ONDO’s price might continue to rise. This could happen due to the adoption of tokenization of real-world assets.
If that is the case, its minimum value could be $1.93. At maximum, the ONDO price prediction could be $5.
ONDO Price Prediction 2030
2030 is expected to be a bullish year for crypto. As expected, ONDO might benefit, with prices expected to trade between $3.69 and $10.27.
ONDO in 2026: What Has Happened So Far?
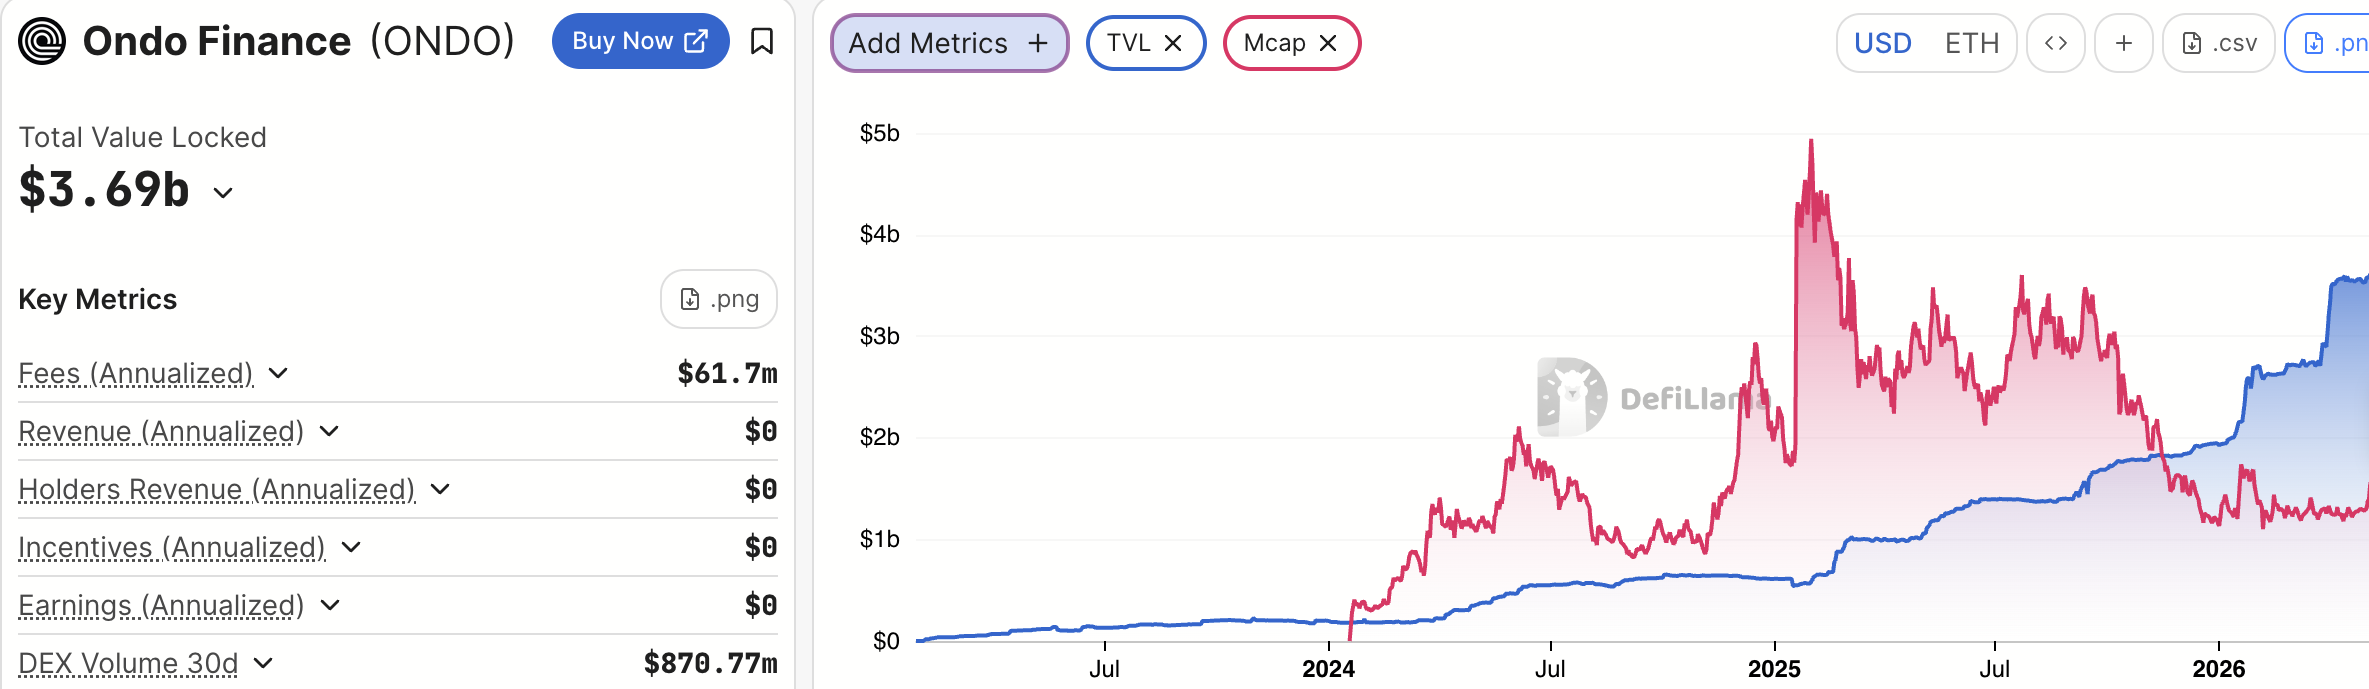
As of May 2026, Ondo Finance has firmly established itself as the undisputed leader in tokenized finance, with Total Value Locked (TVL) surpassing $3.5 billion and controlling more than 70% of the tokenized equity market.
However, despite explosive ecosystem growth and increasing institutional adoption, ONDO’s price performance remains heavily influenced by tokenomics, governance limitations, and ongoing supply expansion.
Several landmark partnerships have dramatically strengthened Ondo’s institutional credibility in 2026.
J.P. Morgan, Mastercard, and Ripple Integration
One of the most significant developments came in May, when Ondo successfully completed a near-real-time cross-border redemption of its tokenized Treasury product, OUSG, through a collaboration involving J.P. Morgan, Mastercard, and Ripple.
The transaction demonstrated how tokenized assets could settle globally outside traditional banking hours.
Ripple redeemed OUSG on the XRP Ledger, while fiat settlement was routed through Mastercard’s Multi-Token Network and finalized using Kinexys by J.P. Morgan.
This marked a major milestone for institutional blockchain adoption.
Franklin Templeton ETF Tokenization
Ondo also expanded aggressively into tokenized equities through a March 2026 partnership with Franklin Templeton, the $1.7 trillion asset manager. The collaboration enabled five major ETFs — spanning equities, fixed income, and gold — to be tokenized and traded 24/7 through Ondo Global Markets.
Meanwhile, fintech giant Broadridge partnered with Ondo in April to introduce on-chain shareholder voting rights for more than 250 tokenized stocks and ETFs, thereby addressing one of the biggest barriers to the adoption of tokenized securities.
Ondo’s technical infrastructure has also evolved rapidly.
Its specialized Ondo Chain, an EVM-compatible Layer-1 built on the Cosmos SDK, now serves as a compliance-focused blockchain designed specifically for institutional RWA markets. The network integrates native KYC, AML, and sanctions compliance directly into validator operations.
At the same time, Ondo expanded into derivatives markets with the launch of Ondo Perps, enabling non-U.S. traders to speculate on tokenized equities, ETFs, and commodities via leveraged perpetual contracts.
Regulatory Momentum Is Turning Bullish
Regulatory developments have further strengthened investor confidence.
In April 2026, Ondo formally submitted a no-action letter request to the SEC seeking approval for its tokenized equities framework developed alongside broker-dealer Alpaca.
The filing followed the SEC’s decision in late 2025 to formally close a multi-year investigation into Ondo Finance without enforcement action.
So, legislative momentum has also improved significantly.
Furthermore, the advancement of the CLARITY Act in the United States and Ondo’s acquisition of EU passporting rights across 30 European markets have dramatically expanded the company’s regulatory reach.
In addition, speculation intensified after 21Shares filed for a potential ONDO spot ETF in February 2026.
ONDO Price Prediction: The Risks Involved
Despite these bullish developments, ONDO still faces a major tokenomics challenge.
Currently, the ONDO token functions strictly as a governance asset. Protocol revenues and management fees generated by Ondo Finance are paid to the corporate entity rather than distributed directly to token holders.
This creates what analysts call a “value capture problem.”
Unless the Ondo DAO activates a future fee-switch mechanism that distributes protocol revenue to token stakers or enables buybacks, ONDO’s price may remain driven more by speculation and narrative momentum than by sustainable cash flow fundamentals.
Supply dynamics have also created pressure.
On January 18, 2026, approximately 1.94 billion ONDO tokens (nearly 19% of the total supply) were unlocked in a pre-scheduled event.
Although institutional demand absorbed much of the new liquidity, the increase in circulating supply has created a strong mechanical headwind for price appreciation.
ONDO Price Analysis
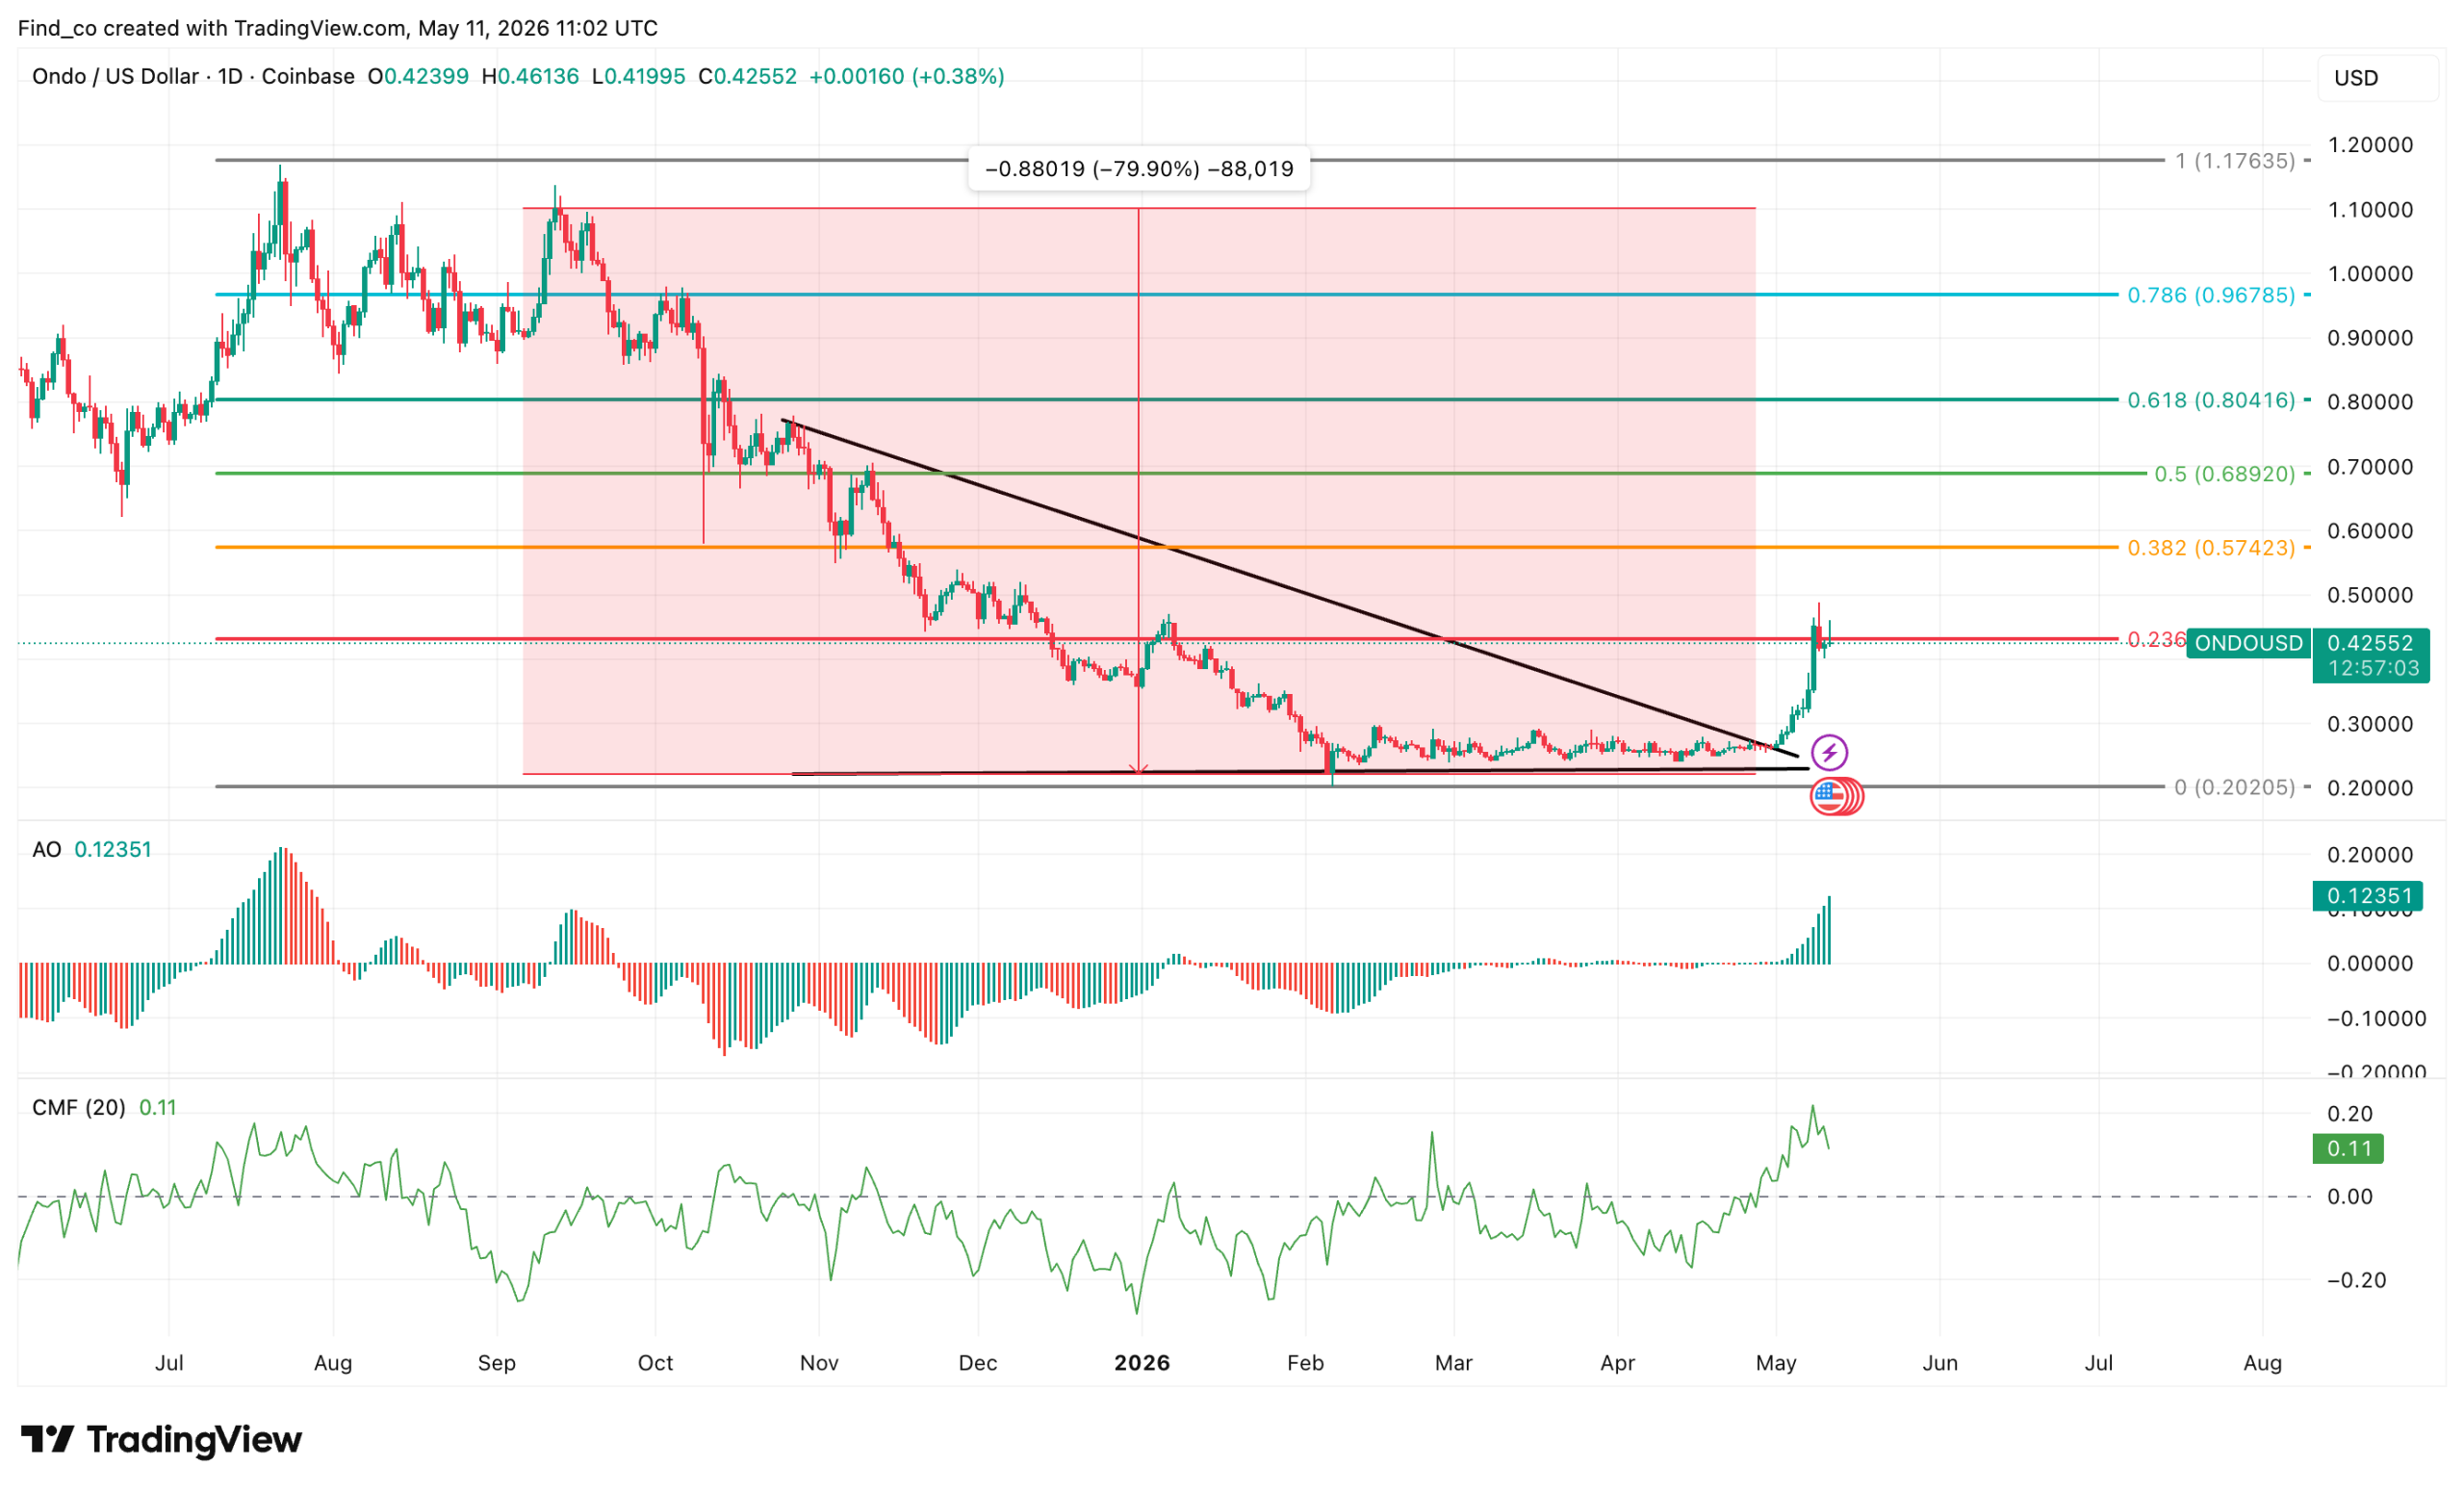
On the daily chart, the altcoin confirmed a breakout from a multi-month symmetrical triangle, signaling that buyers have regained short-term control after months of compression and declining volatility.
Furthermore, ONDO’s price surged toward the $0.45 region before encountering mild rejection.
In the meantime, the token continues to hold firmly above the former breakout area near $0.40.
Momentum indicators further support the recovery narrative. The Awesome Oscillator (AO) printed its strongest positive histogram in months, reflecting accelerating bullish momentum.
At the same time, Chaikin Money Flow (CMF) remained in positive territory, suggesting the move is backed by sustained capital inflows.
Consequently, the daily structure now favors continuation as long as ONDO maintains support above its reclaimed trendline.
A major move above that region could strengthen upside continuation toward $0.57 before exposing the broader weekly resistance levels near $0.69
Short-term ONDO Price Prediction
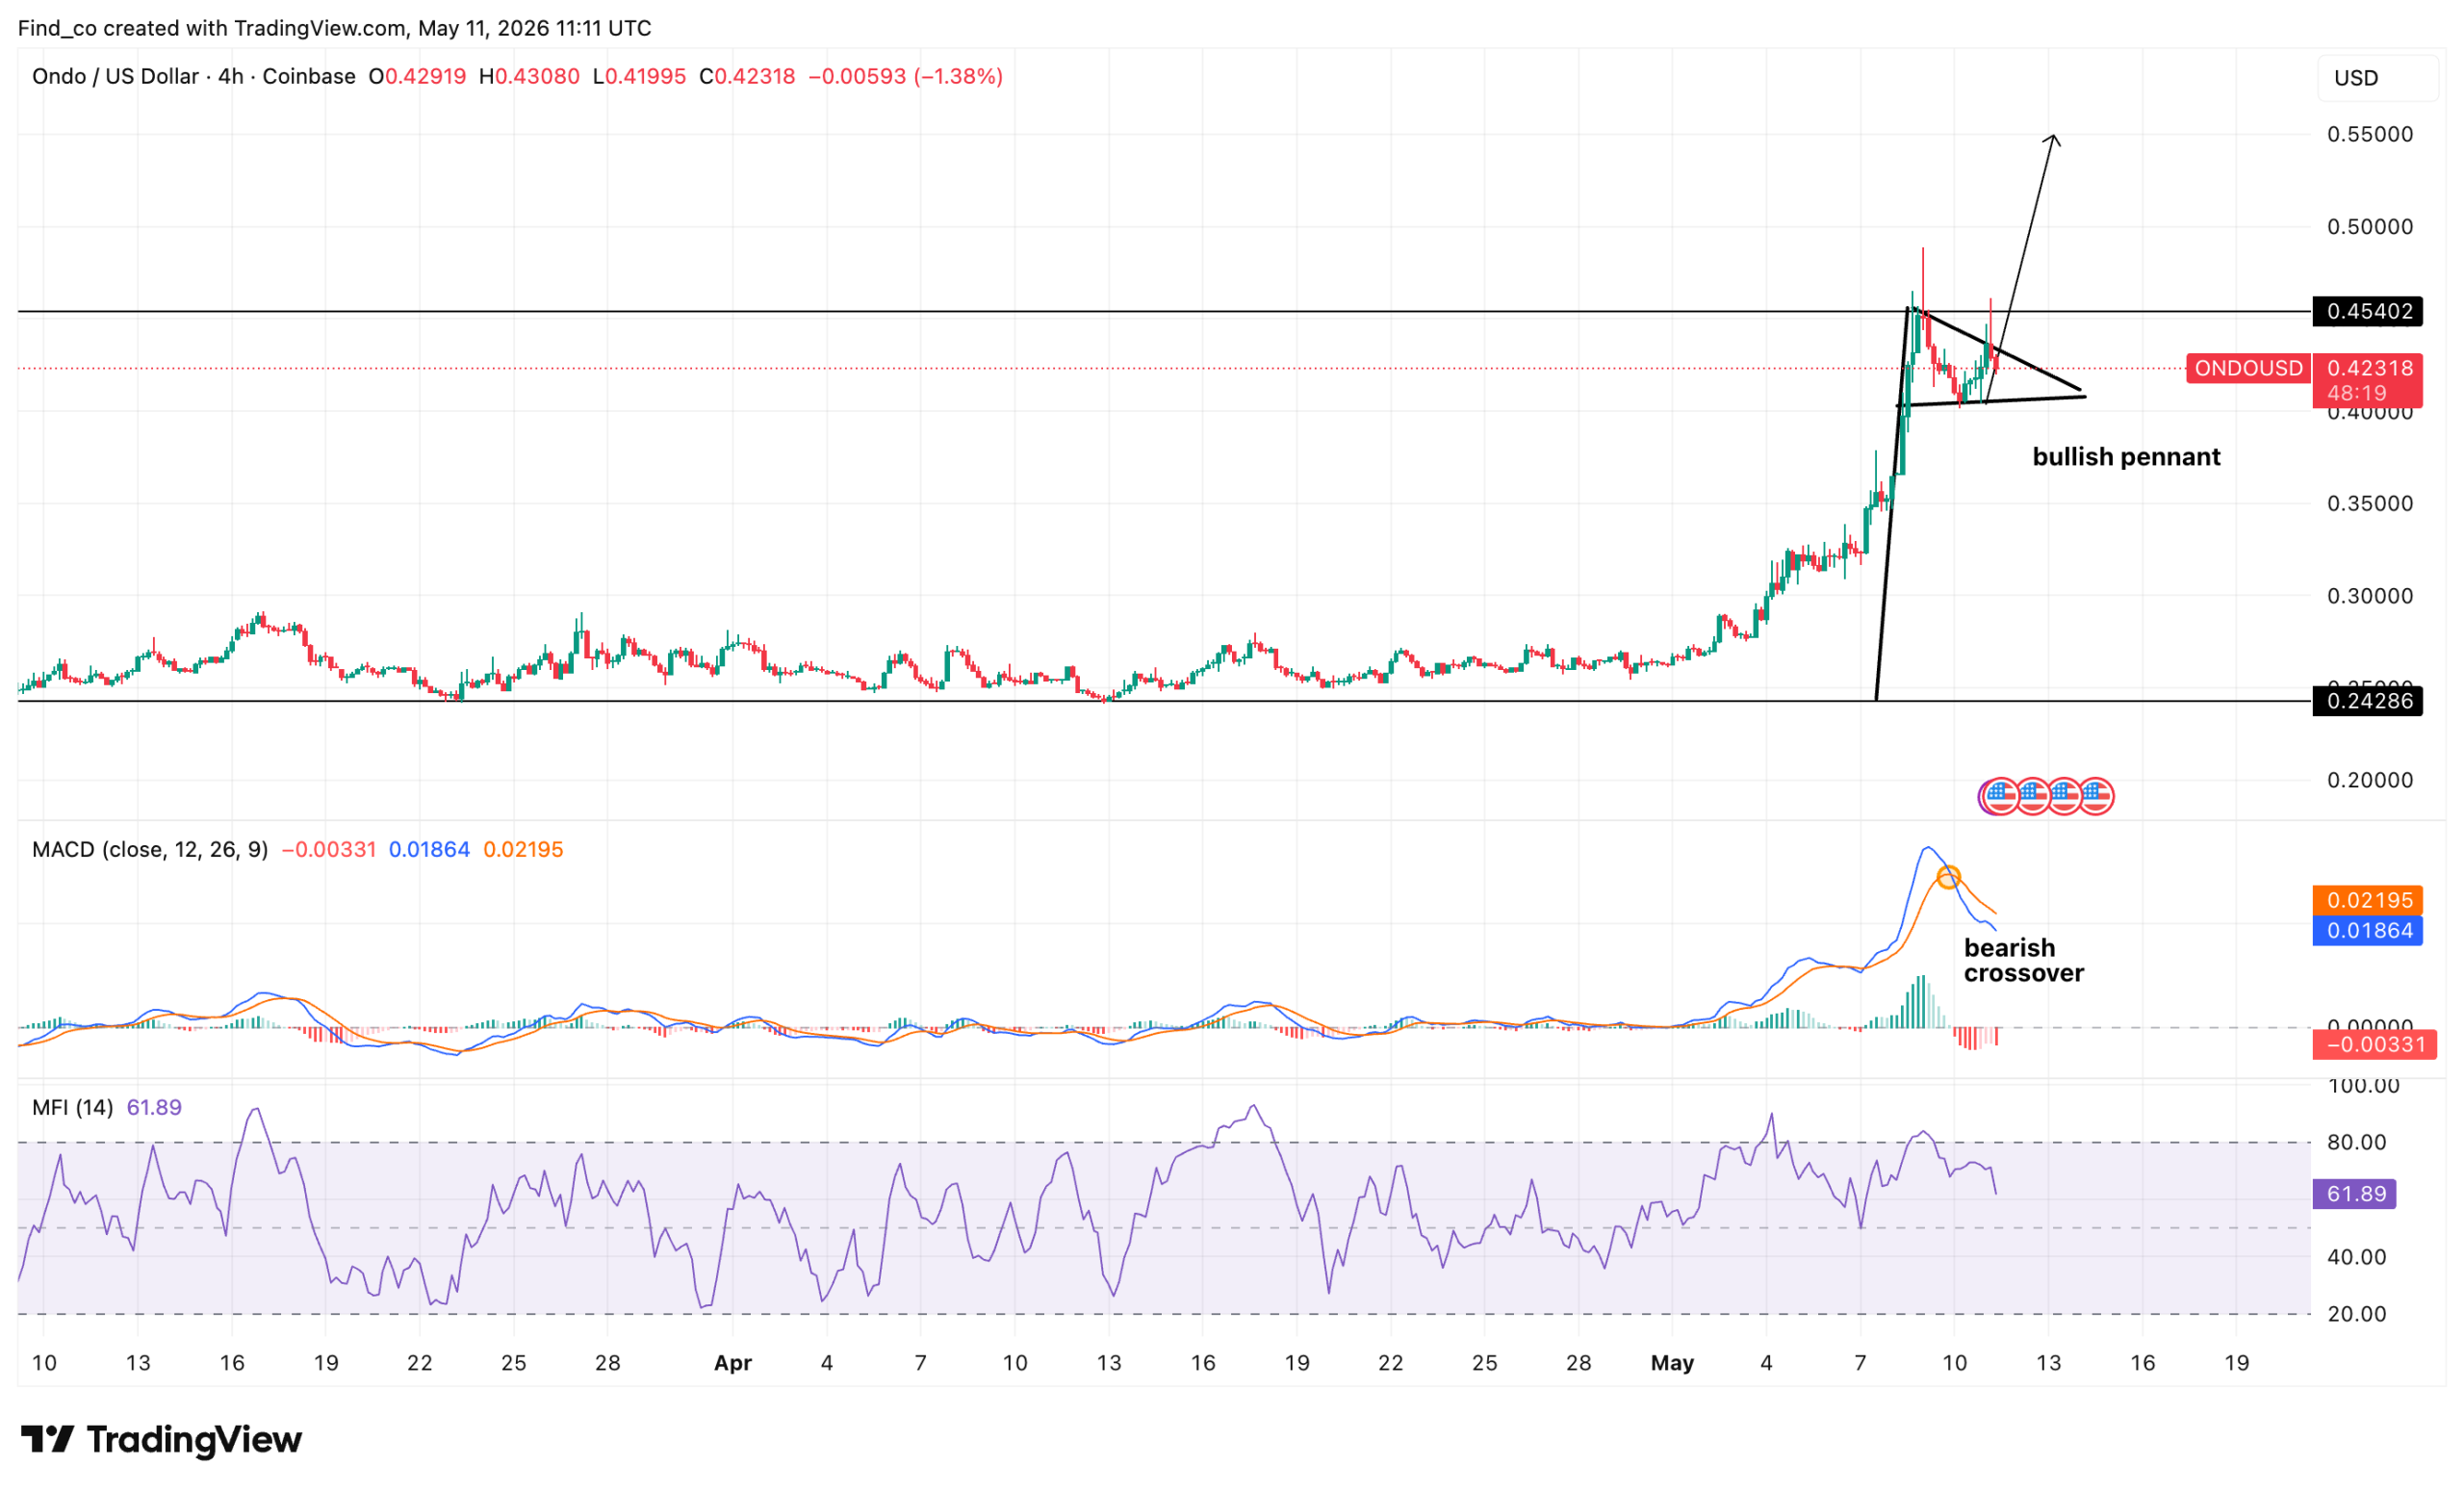
In the short term, ONDO continues to show impressive strength after a powerful multi-week breakout rally.
The asset surged from the $0.24 demand zone and climbed toward the $0.45 region before entering a healthy consolidation phase.
The recent rally began after ONDO broke out from a long period of sideways accumulation near $0.25.
Once momentum accelerated, the rally extended. As a result, ONDO’s price broke out, formed a bullish pennant, and reached a key resistance area just above $0.50.
However, sellers are now defending the $0.45 range on the 4-hour chart. Multiple rejections near the local top suggest bears are attempting to slow the rally.
From a momentum perspective, the Moving Average Convergence Divergence (MACD) indicator is beginning to cool, indicating a bearish crossover.
As a result, the altcoin may be preparing for either another breakout attempt or a temporary consolidation before resuming its upward trend.
Technically, the $0.40 zone is now the nearest support region.
If bulls defend this level, ONDO’s price could challenge the $0.55 resistance barrier.
ONDO Market Cap to TVL Ratio
The Total Value Locked (TVL) to market cap ratio (TVL ratio) measures the valuation of a decentralized finance (DeFi) project by comparing its market capitalization to the total value of assets locked in its smart contracts.
This ratio shows the project’s utilization and links the platform’s health to locked asset value.
A ratio above 1.0 indicates overvaluation, as the market cap exceeds the platform’s asset value. A ratio below 1.0 indicates undervaluation because the market cap is lower than the value of locked assets.
As of this writing, the ONDO market cap-to-TVL ratio was 0.56, indicating the cryptocurrency is undervalued relative to current market conditions.
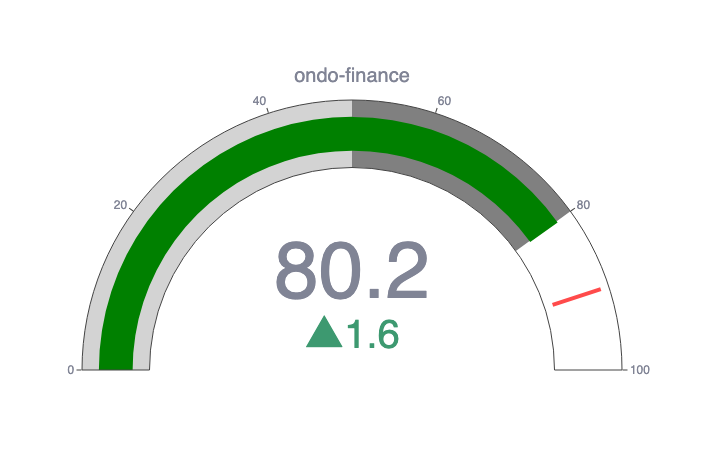
CCN Strength Index
The CCN Strength Index combines a range of advanced market signals to measure the strength of individual cryptocurrencies over the past 30 days.
Every day, it assigns a strength score, ranging from 0 to 100, to the top 500 assets by market capitalization on CoinMarketCap, focusing on both trend direction and the intensity of price movements.
0 to 24: Assets exhibit significant weakness, showing signs of sustained downtrend behavior.
25 to 35: The price tends to move within stable bounds with minimal volatility.
36 to 49: Assets begin a stable uptrend but without strong surges.
50 to 59: Consistent growth with moderate price advances, building momentum.
60+: Sharp price movements and high demand indicate more volatility and trend shifts.
The index dynamically adapts to rapid changes. For example, an asset experiencing a 100% increase within a short timeframe would see a sharp jump in its score to reflect the intensity of the rise.
However, should that asset stabilize at this new price level, the score will gradually taper down and align with the dampened momentum as the movement normalizes.
Now, let’s examine some of the highlights and lowlights of the Ondo price history.
While we should never take past performance as an indicator of future results, knowing what the coin has achieved can provide us with useful context when making or interpreting an Ondo price prediction.
Period
Ondo Price
One week ago (May 4, 2026)
$0.32
One month ago (April 11, 2026)
$0.26
Three months ago (Feb. 11, 2026)
$0.24
One year ago (May 11, 2025)
$1
Launch price (Jan. 18, 2024)
$0.082
All-time high (Dec. 16, 2024)
$2.14
All-time low (Jan. 18, 2024)
$0.08
Who Owns the Most Ondo (ONDO) Tokens?
At the time of writing, one address, which is the project’s multisig wallet, holds 57.79% of the supply.
0x677FD4Ed8aE623f2f625DEB2D64F2070E46cA1A1. This wallet holds 57.79% of the supply, worth over $2 billion.
0x460aE5a6666fcB9635BA99b541b31279e5966537. This wallet holds 6.49% of the ONDO supply, valued at $274 million.
0xa63eaCe47618B9677261B09B32E3ca2B5C0A0182, linked to the Bithumb exchange. This wallet holds 1.88% of the supply, valued at $79.50 million.
0xF977814e90dA44bFA03b6295A0616a897441aceC — a Binance hot wallet. This wallet holds 1.88% of the supply, valued at $79.50 million.
0xD2e6E930E25456fFcD4Df0124563cC334F3284f4. This wallet holds 1% of the ONDO supply, valued at $42.38 million.
ONDO Supply and Distribution
Supply and Distribution
Figures
Total Supply
10,000,000,000
Circulating supply as of May 11, 2026
4,869,330,647 (48.69% of total supply)
Holder distribution as of May 11, 2026
The top 10 holders own over 65% of the supply
From the ONDO Whitepaper
In its technical documentation or whitepaper, Ondo Finance says: “At Ondo, our mission is to make institutional-grade financial products and services available to everyone. We believe that blockchain technology can improve both the infrastructure of and access to financial products and services. We also believe that the best technical improvements need to be combined with the best practices from traditional finance, including investor protections, transparency in reporting, legal and regulatory compliance, intelligent and robust product structuring, working with the best service providers, and top-notch client service.”
Ondo (ONDO) Explained
Ondo Finance is a decentralized finance (DeFi) protocol that brings institutional-grade financial products on-chain, including tokens backed by US Treasuries.
Nathan Allman is the founder and Chief Executive Officer of Ondo Finance.
How Ondo Works
Ondo Finance uses an approach called “on-chain asset management” to provide investors with a more secure and transparent investment experience than traditional DeFi protocols.
Here is how Ondo Finance works:
Subscription: Investors connect their wallet to the Ondo Finance platform and deposit USDC or wire USD to the platform. Once the funds are deposited, investors can subscribe to a synthetic asset by minting Ondo tokens (OUSG).
Redemption: Investors can redeem their Ondo tokens for USDC or USD at any time. When an investor redeems their tokens, the Ondo Finance protocol will sell the underlying synthetic assets and return the proceeds to the investor.
Transfer: Investors can transfer their Ondo tokens to other wallets or use them to interact with other DeFi protocols.
Ondo’s founders include Nathan Allman and Pinku Surana.
Is Ondo a Good Investment?
It is hard to say. The coin’s price shot up after its launch and has never traded below that price. It hit a new all-time high in December, and while it keeps on announcing new integrations, the future may still see Ondo shine, according to main price predictions.
On the other hand, ONDO has climbed due to interest in real-world asset tokens, so we don’t know what will happen if and when things cool off.
As always with crypto, you should do your own research before deciding whether or not to invest in ONDO.
Will Ondo go up or down?
No one can really tell right now. While Ondo crypto price predictions are largely positive, they have a well-earned reputation for being wrong. Keep in mind that prices can and do go down and up.
Should I invest in Ondo?
Before deciding whether to invest in Ondo, you must research ONDO and other similar coins and tokens. Either way, never invest more money than you can afford to lose.
On May 11, 2026, there are 4.86 billion ONDO in circulation out of a total supply of 10 billion.
Will Ondo reach $10?
Our price predictions suggest that ONDO could potentially reach double figures in $5 before 2030.
What is Ondo used for?
Ondo Finance is a real-world asset (RWA) tokenization platform that brings institutional-grade financial instruments, such as U.S. Treasuries and public equities, directly onto the blockchain.
Its native ONDO token is primarily used for governance, allowing holders to vote on proposals within the Ondo DAO and manage the Flux Finance lending protocol.
Additionally, the token serves as the foundational utility asset for the Ondo Chain ecosystem (a permissioned Layer-1 blockchain built specifically for compliant, institutional tokenized assets) and is the subject of a highly anticipated late-2026 “fee-switch” vote to direct protocol revenues back to token holders.
Disclaimer:
The information provided in this article is for informational purposes only. It is not intended to be, nor should it be construed as, financial advice. We do not make any warranties regarding the completeness, reliability, or accuracy of this information. All investments involve risk, and past performance does not guarantee future results. We recommend consulting a financial advisor before making any investment decisions.
Victor Olanrewaju is a crypto analyst and reporter at CCN with deep roots in on-chain research and technical analysis. His crypto journey began in 2017, but it was the 2020 Uniswap airdrop that sparked a full-time pivot into the space.
With a foundation in copywriting, Victor honed his craft creating high-converting content for leading crypto brokers — most notably an XRP price prediction that ranked #1 on Google during the 2021 bull run.
He later joined AMBCrypto in 2022, where he combined storytelling with technical and on-chain analysis to cover key market narratives.
In 2024, he expanded his expertise at BeInCrypto, collaborating with analysts and using tools like Glassnode, Santiment, and IntoTheBlock to break down Bitcoin and altcoin trends.
At CCN, Victor covers the top cryptocurrencies, memecoins, macro shifts, blending real-time insights with deep-dive metrics.
He holds a Bachelor’s degree in Physics from the University of Ibadan, equipping him to simplify complex data for a wide audience. Follow his work or connect on LinkedIn or X.
Valdrin Tahiri is a cryptocurrency analyst and reporter at CCN, specializing in technical analysis with a focus on Elliott Wave theory, on-chain metrics, and fundamental research. He brings over seven years of experience in the crypto space as both a trader and writer.
He discovered cryptocurrencies in 2017 while earning his MSc in Financial Markets at the Barcelona School of Economics, which sparked a deep interest in blockchain and market dynamics. Since then, he’s contributed to top crypto outlets like BeInCrypto and CoinGape.
Valdrin also served as Community Manager of BeInCrypto’s Telegram group for three years, helping grow it into one of the largest crypto communities worldwide. His expertise in market structure and price patterns allows him to break down complex trends into clear, actionable insights.
He’s published thousands of articles covering altcoins, Bitcoin cycles, and macro trends.