Home / Analysis / Crypto / Technical Analysis / ONDO Soars Nearly 30% This Week as Ondo, Ripple, JPMorgan, Mastercard Pull Off First Cross-Border Tokenized Treasury
ONDO jumps 30% this week as Ondo, Ripple, JPMorgan, and Mastercard settle the first cross-border tokenized Treasury. Credit: CCN
Share
Key Takeaways
ONDO has surged nearly 30% this week after Ondo Finance, Ripple, JPMorgan, and Mastercard completed an important pilot.
Whales holding 100,000 to 1,000,000 tokens added roughly 8 million ONDO over the past month.
Despite bullish technicals, a short-tilted futures long/short ratio and an overbought daily RSI suggest a near-term cooldown.
ONDO has been one of the standout performers across the altcoin market this week, with the token climbing nearly 30% over the past seven days.
Over the past 24 hours alone, the token is up 5%, extending a rally that has now broken cleanly above multiple short-term resistance levels.
Part of the latest momentum followed a May 6 announcement from Ondo Finance around progress in cross-border settlement and tokenized Treasury infrastructure.
With institutional adoption in crypto expanding and tokenized real-world asset (RWA) adoption sitting at all-time highs, what does this development mean for ONDO in the short term?
Try Our Recommended Crypto Exchanges
Sponsored
Disclosure
We sometimes use affiliate links in our content, when clicking on those we might receive a commission at no extra cost to you. By using this website you agree to our terms and conditions and privacy policy.
Ondo, Ripple, JPMorgan and Mastercard Pilot, Explained
On May 6, Ondo Finance announced that it had completed the first near real-time, cross-border, cross-bank redemption of a tokenized U.S. Treasury fund.
The transaction, which brought together Kinexys by JPMorgan, Mastercard, and Ripple, combined public blockchain infrastructure with traditional banking rails.
It enabled both asset redemption and fiat settlement to occur in near real time, outside normal banking hours.
Ripple started the process by redeeming a portion of its Ondo Short-Term US Government Treasuries (OUSG) holdings on the XRP Ledger.
Ondo then processed the redemption and issued a fiat payout instruction via Mastercard’s Multi-Token Network, which routed it to Kinexys by JPMorgan.
Kinexys, in turn, debited Ondo’s Blockchain Deposit Account and settled the US dollar proceeds into Ripple’s bank account in Singapore via JPMorgan’s correspondent banking network.
It is the first transaction of its kind between global financial institutions, and it lays out a working blueprint for 24/7 cross-border settlement of tokenized real-world assets.
ONDO On-Chain Activity Confirms Uptrend
ONDO’s on-chain analysis suggests its current rally has structural support and may continue in the meantime.
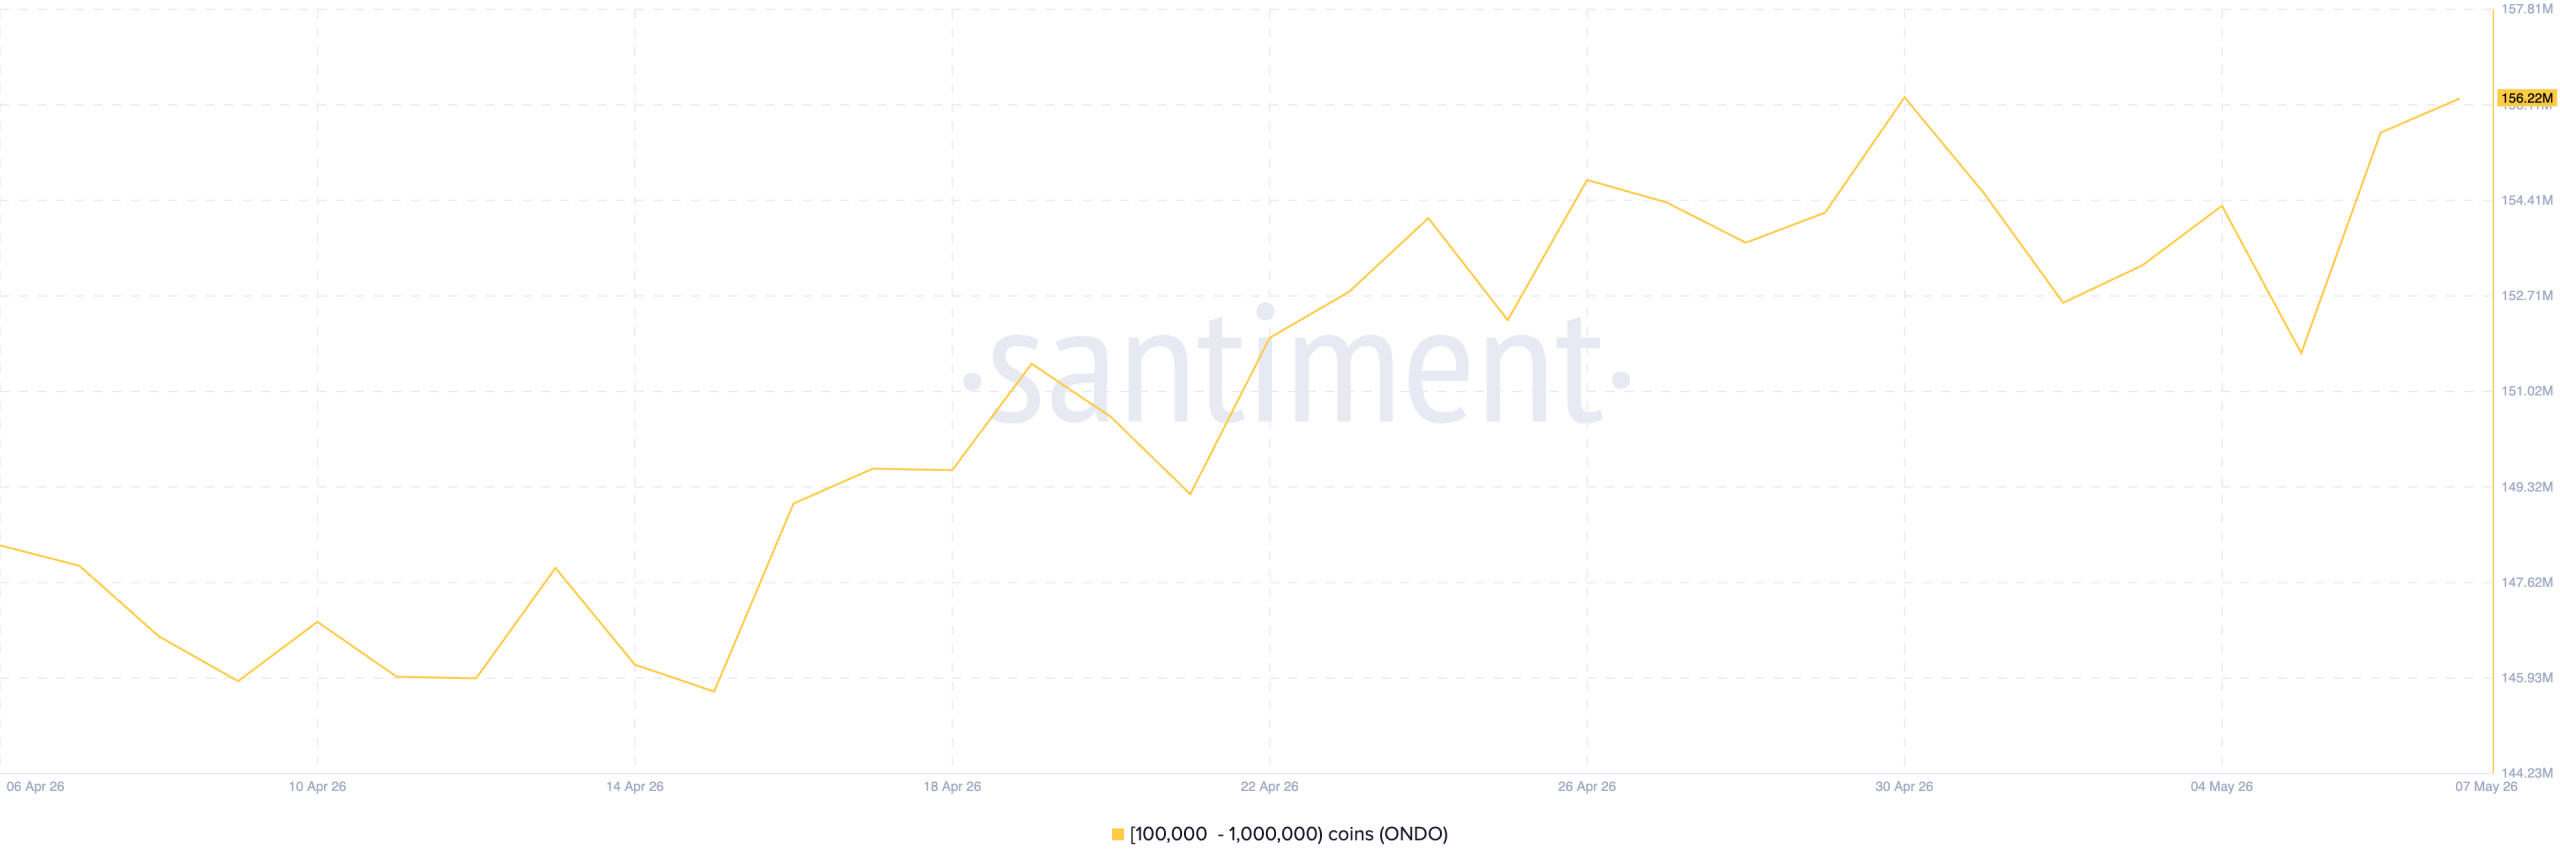
For example, santiment data shows a clear uptick in whale accumulation over the past month.
Wallets in the 100,000 to 1,000,000 ONDO cohort have steadily expanded their holdings, climbing from 148 million ONDO on April 6 to about 156 million ONDO at press time.
Large holders generally have longer time horizons, so when this cohort consistently adds rather than distributes, it suggests confidence in ONDO’s medium-term trajectory.
For retail traders, an uptick in whale accumulation shores up their confidence and can drive them to also increase their demand, in which case ONDO would maintain its uptrend.
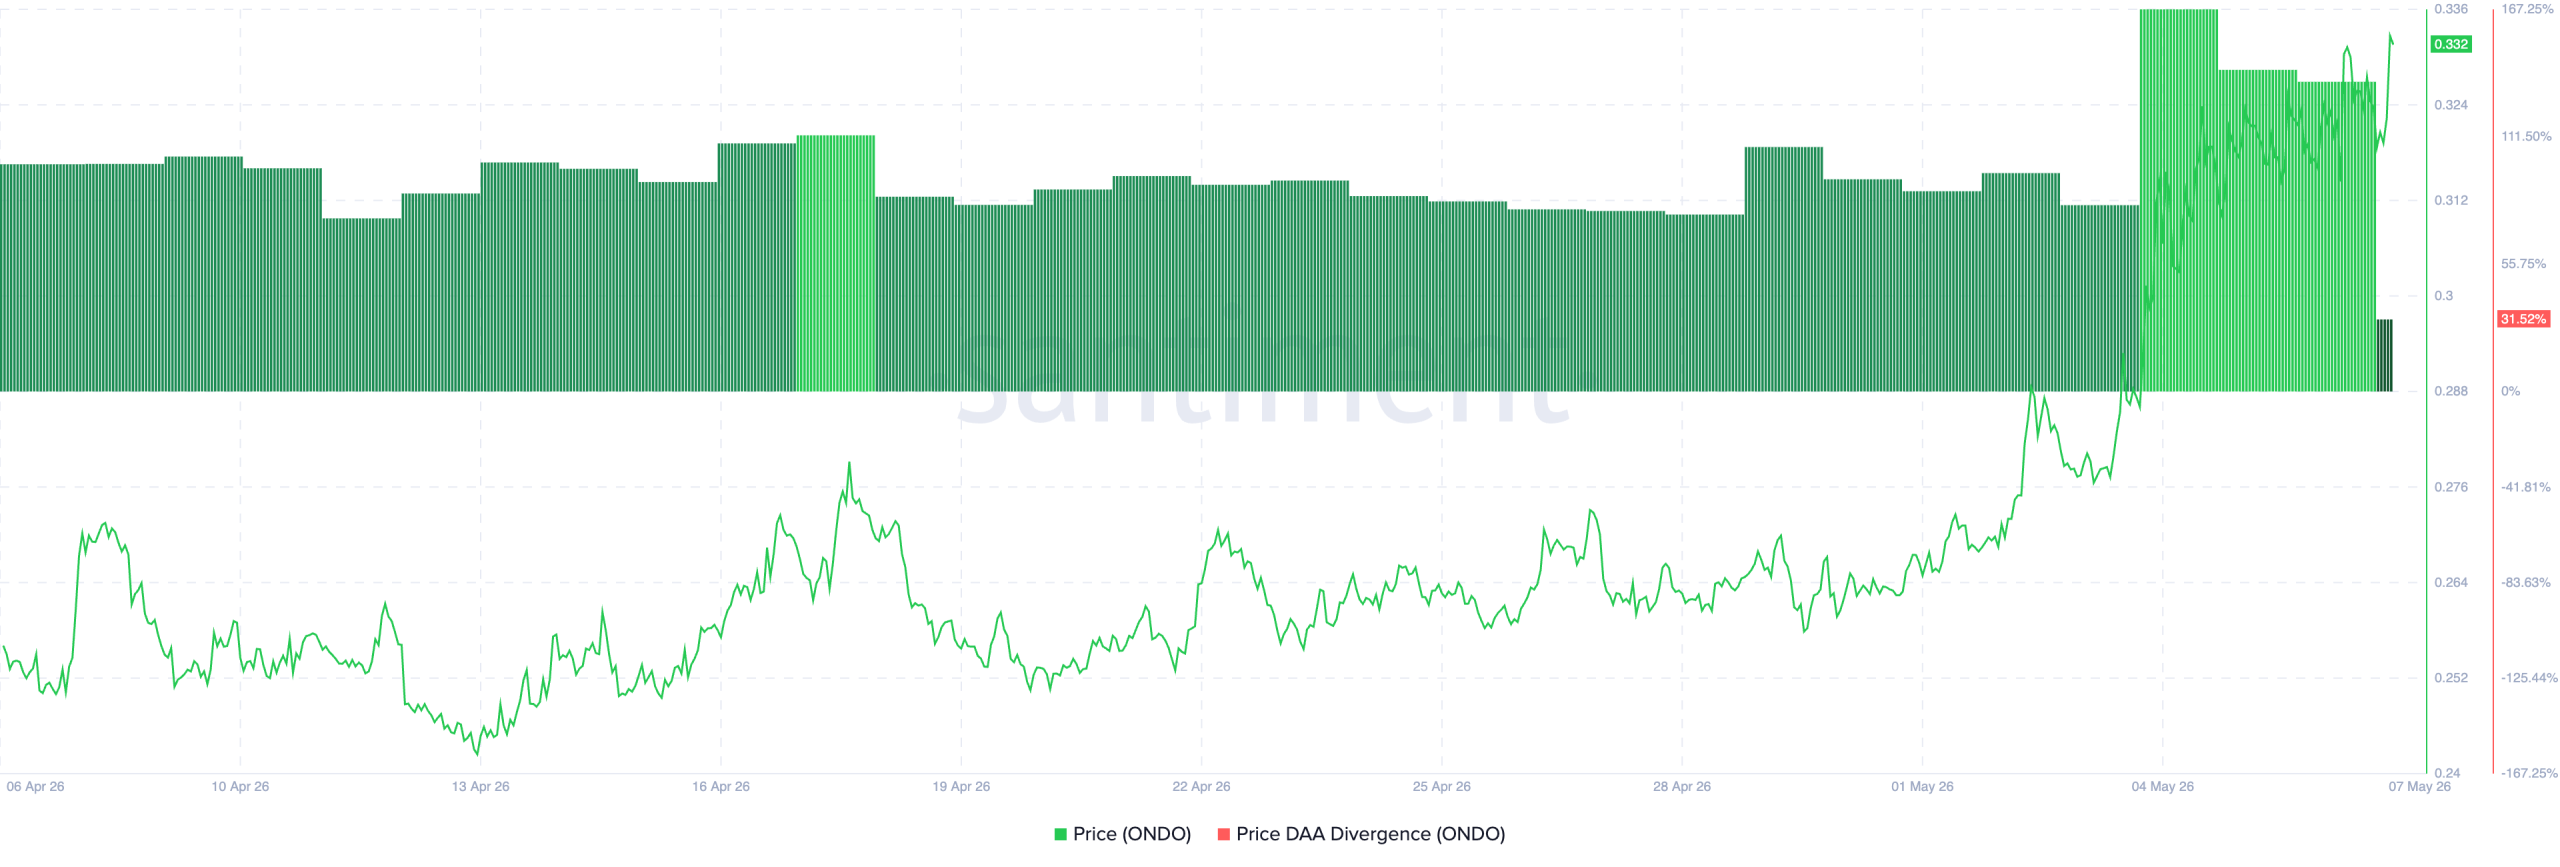
Moreover, ONDO’s positive Price-DAA Divergence supports this bullish outlook.
This metric, which measures an asset’s price movements with the changes in its number of daily active addresses, is currently at 31.52%, indicating that price is moving in tandem with on-chain user activity.
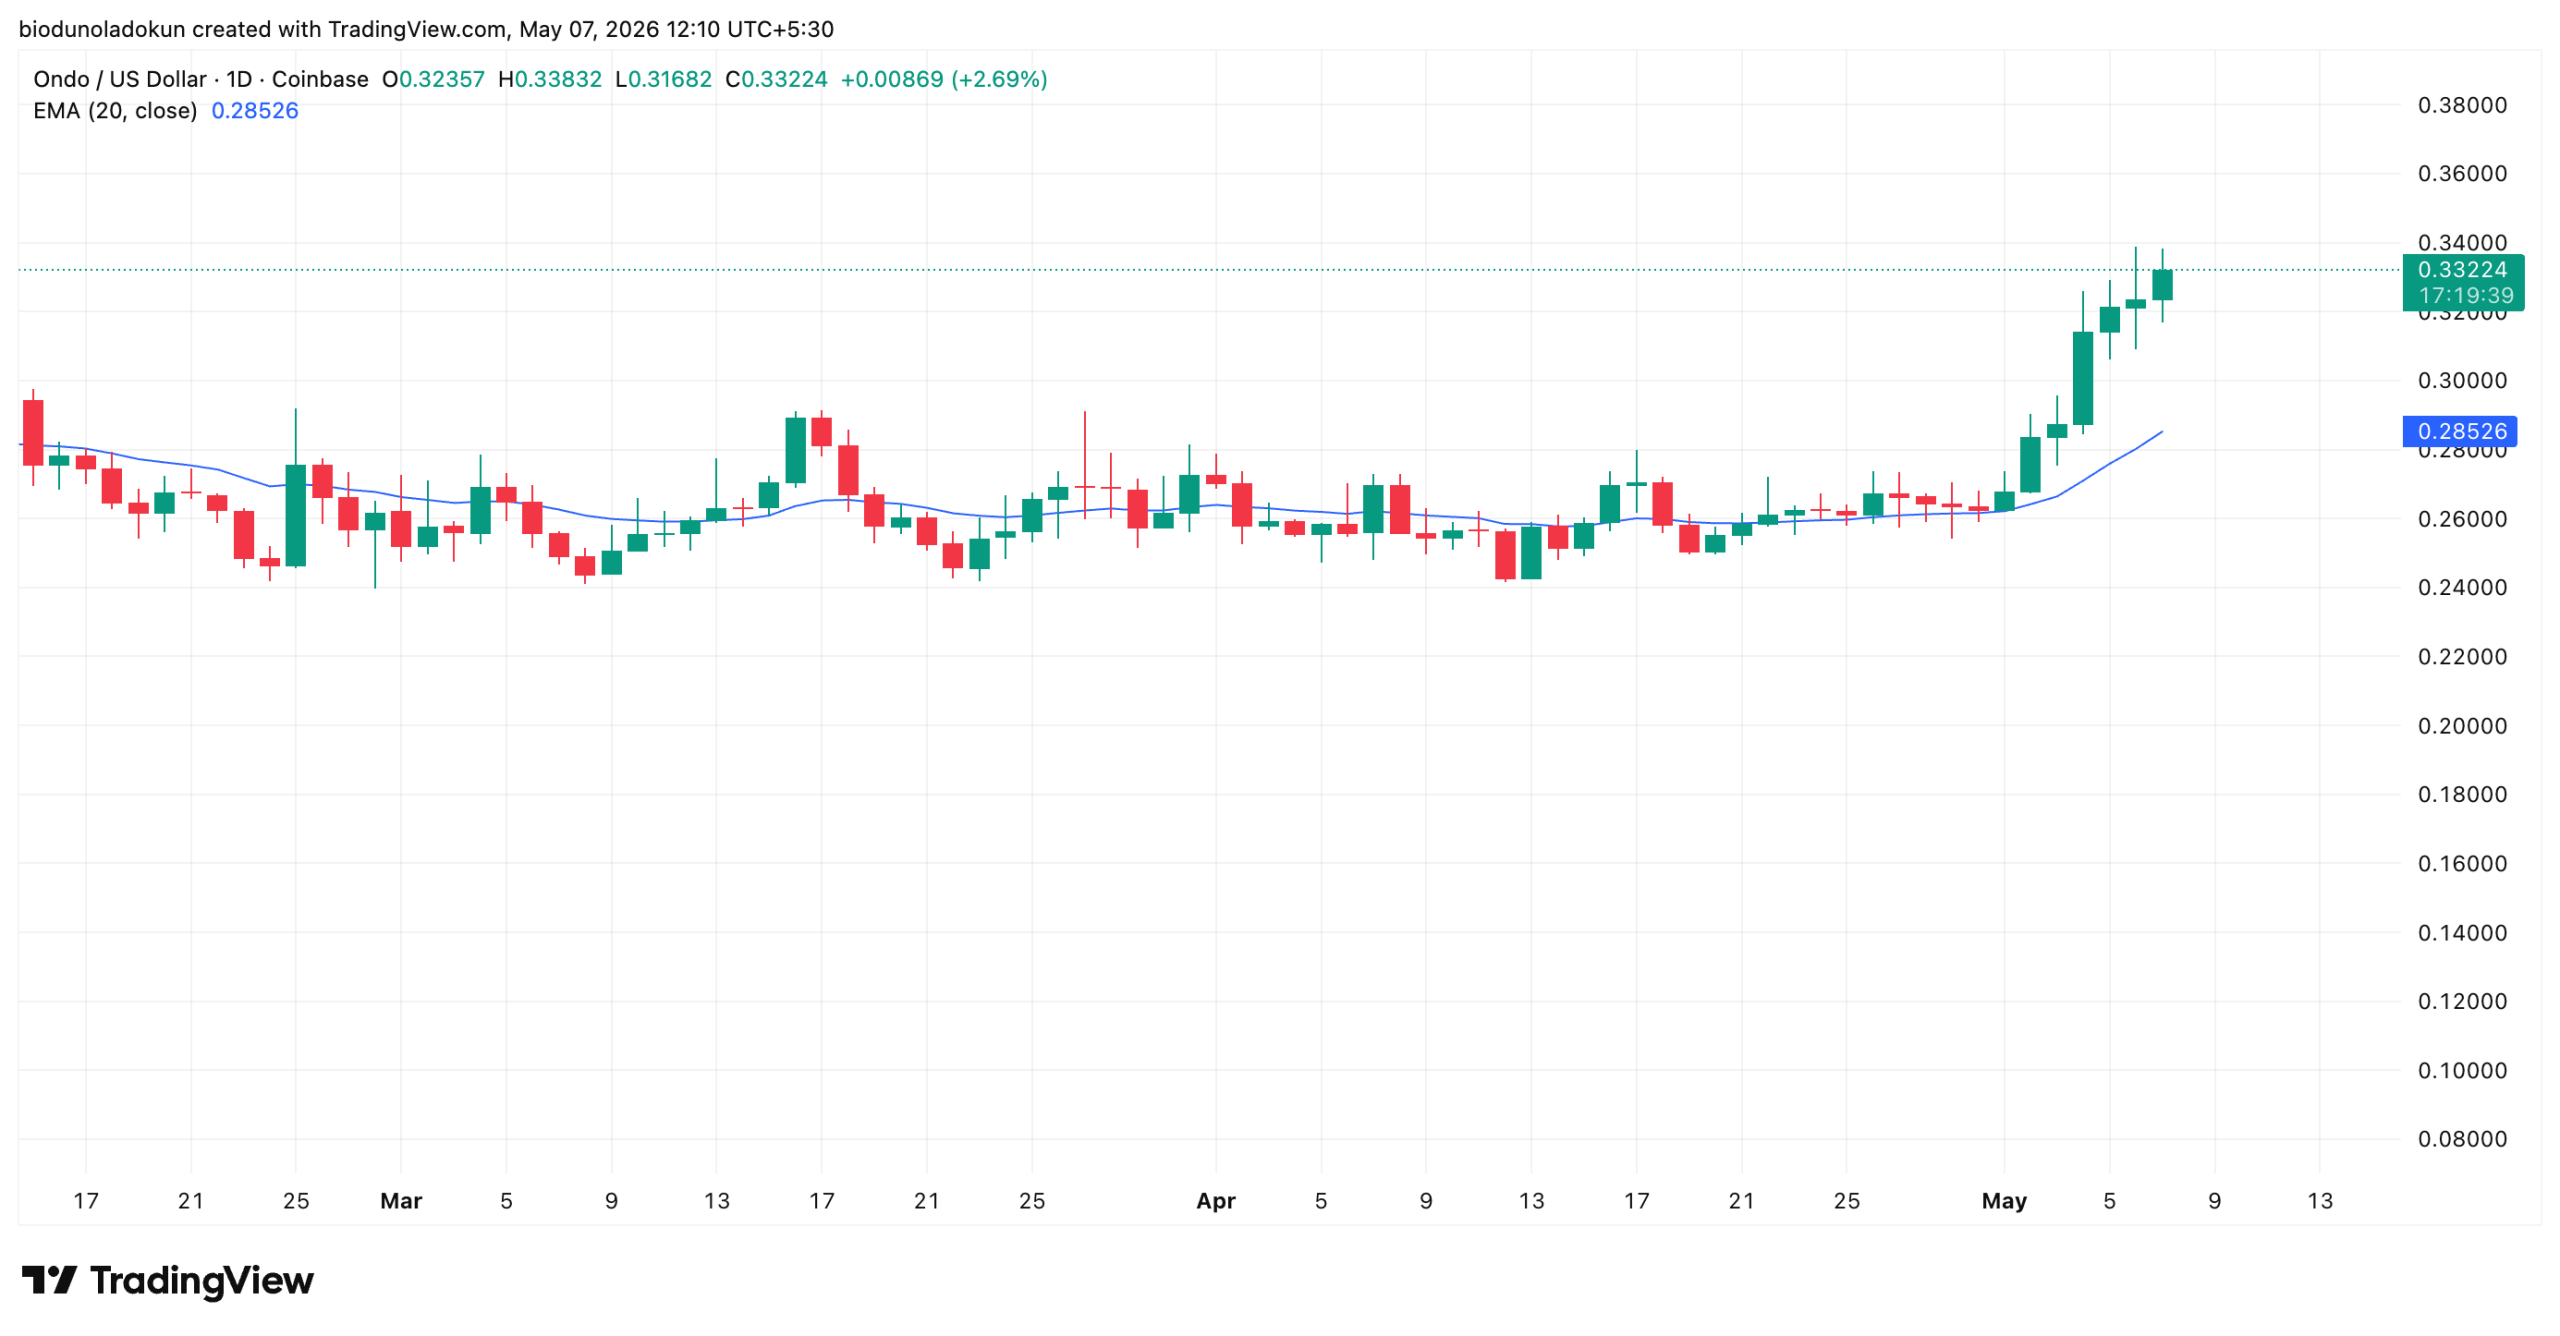
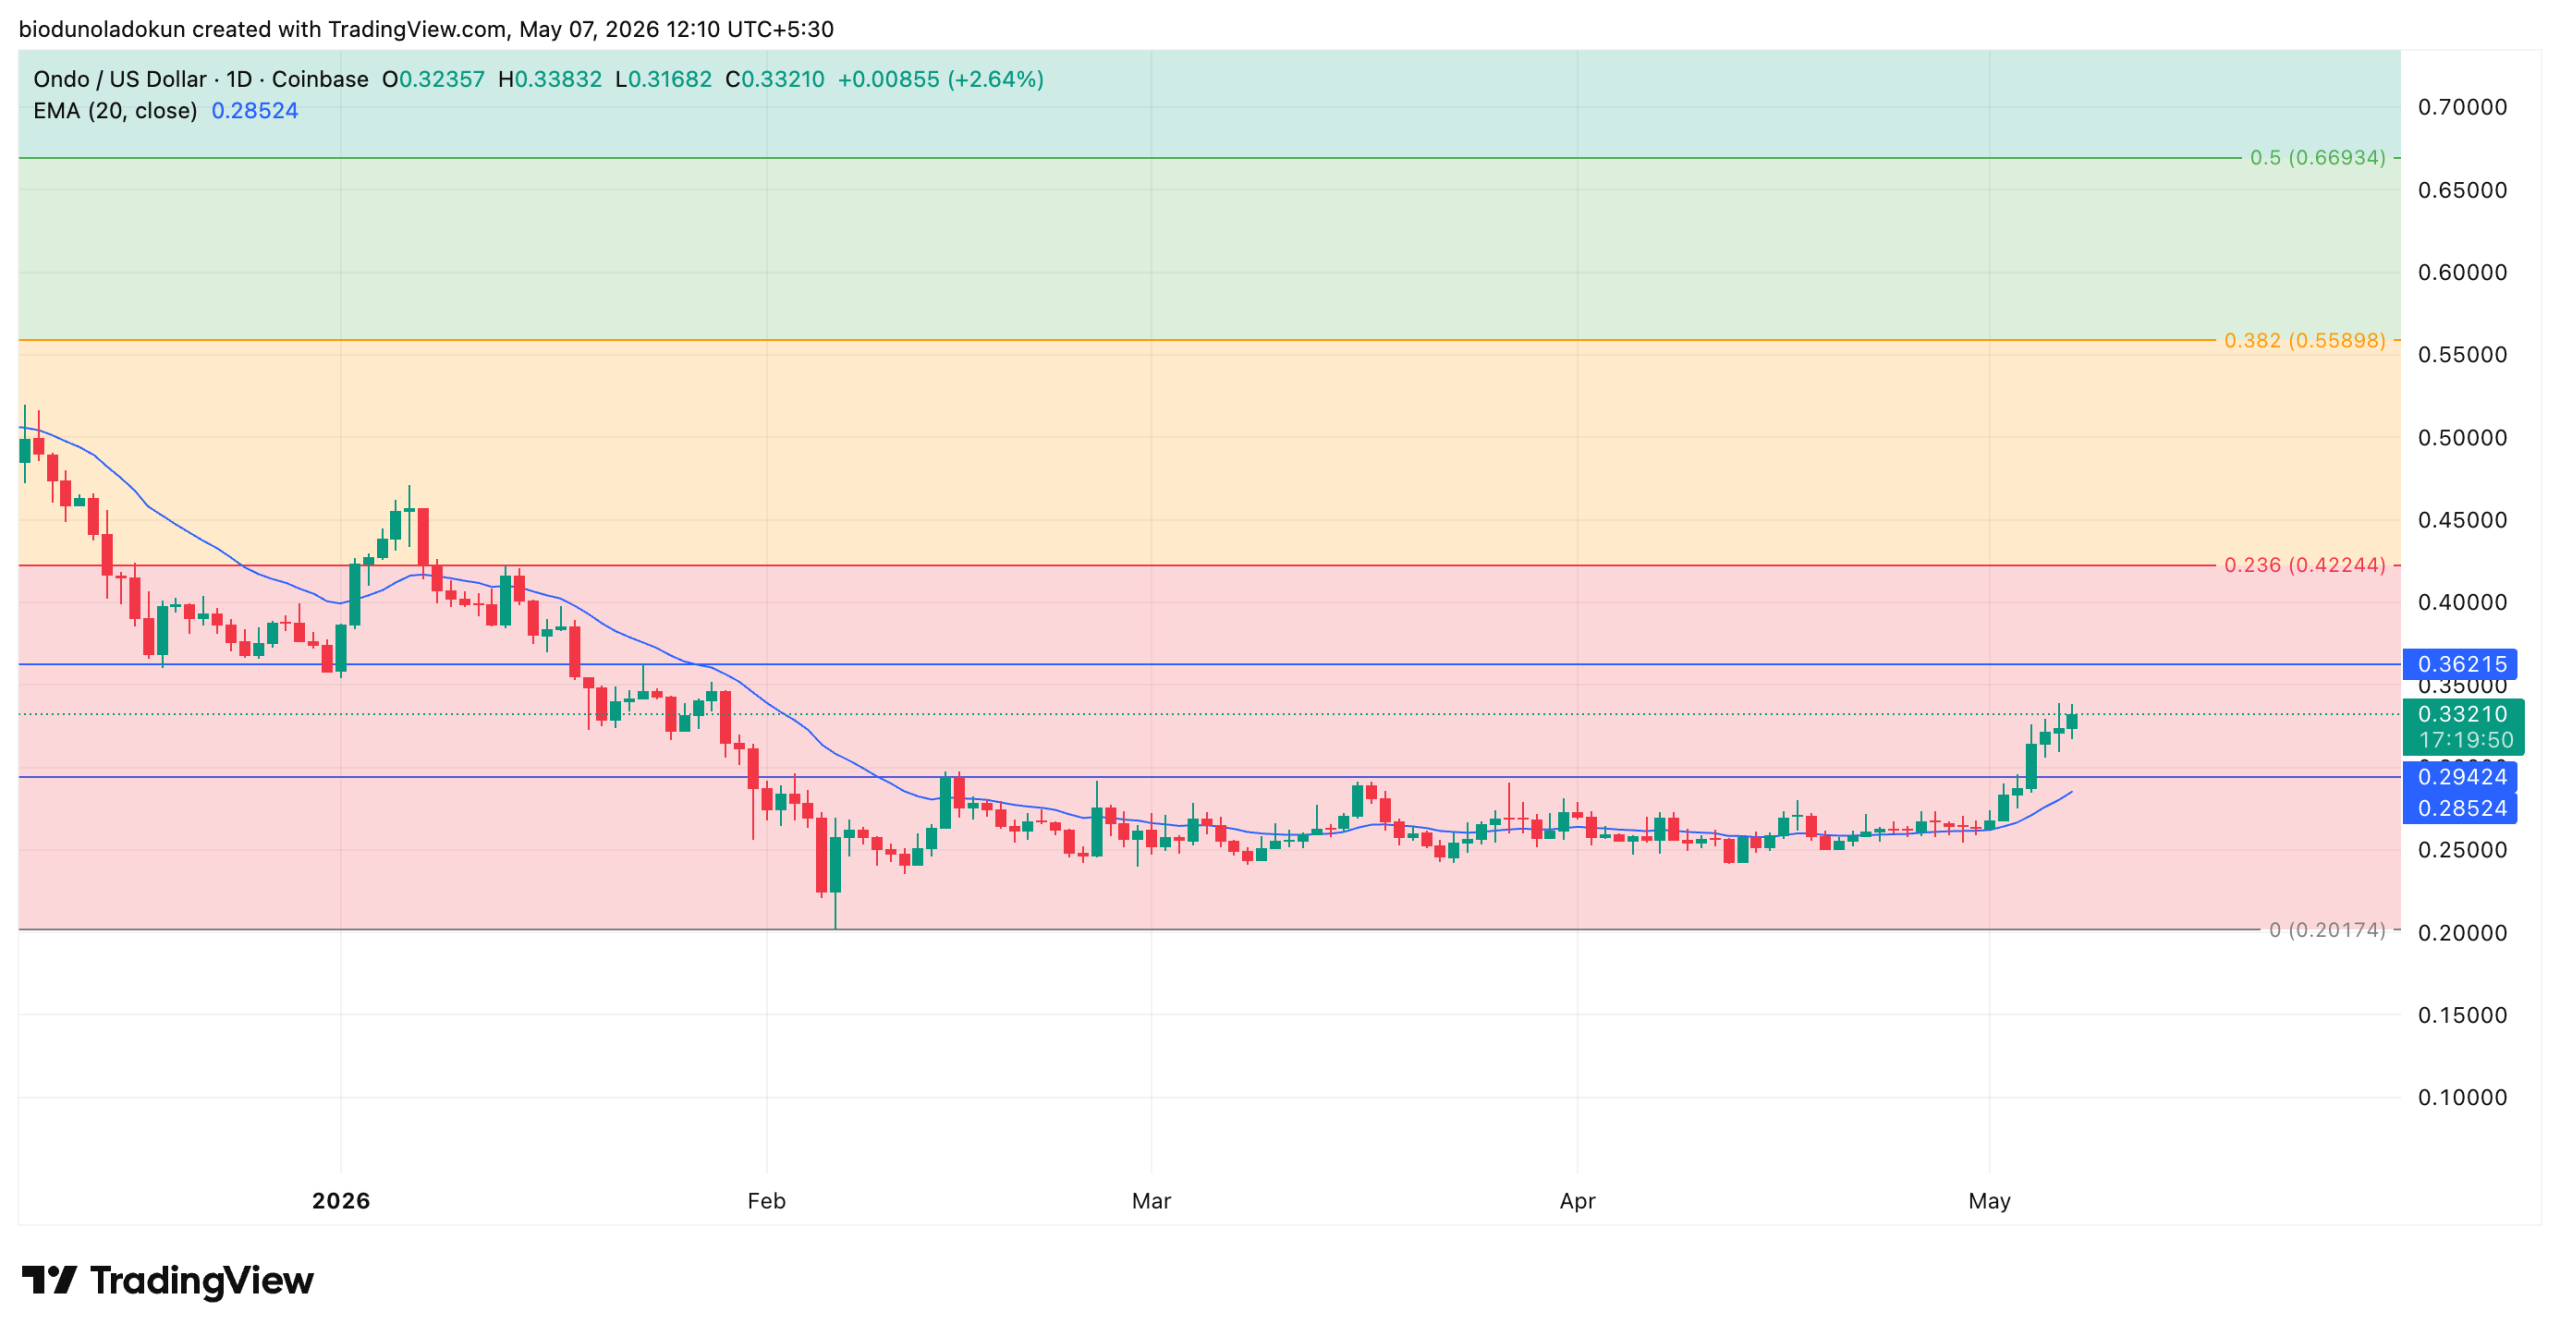
The 20-day EMA measures an asset’s average price over the past 20 trading days, giving more weight to recent prices.
When an asset is trading above its 20-day EMA, it generally signals that short-term momentum has flipped bullish, with buyers in control of the immediate trend.
The indicator also doubles as a dynamic support level.
This means that on pullbacks, ONDO bulls will be watching the $0.2853 region as the first line of defense to keep the broader uptrend intact.
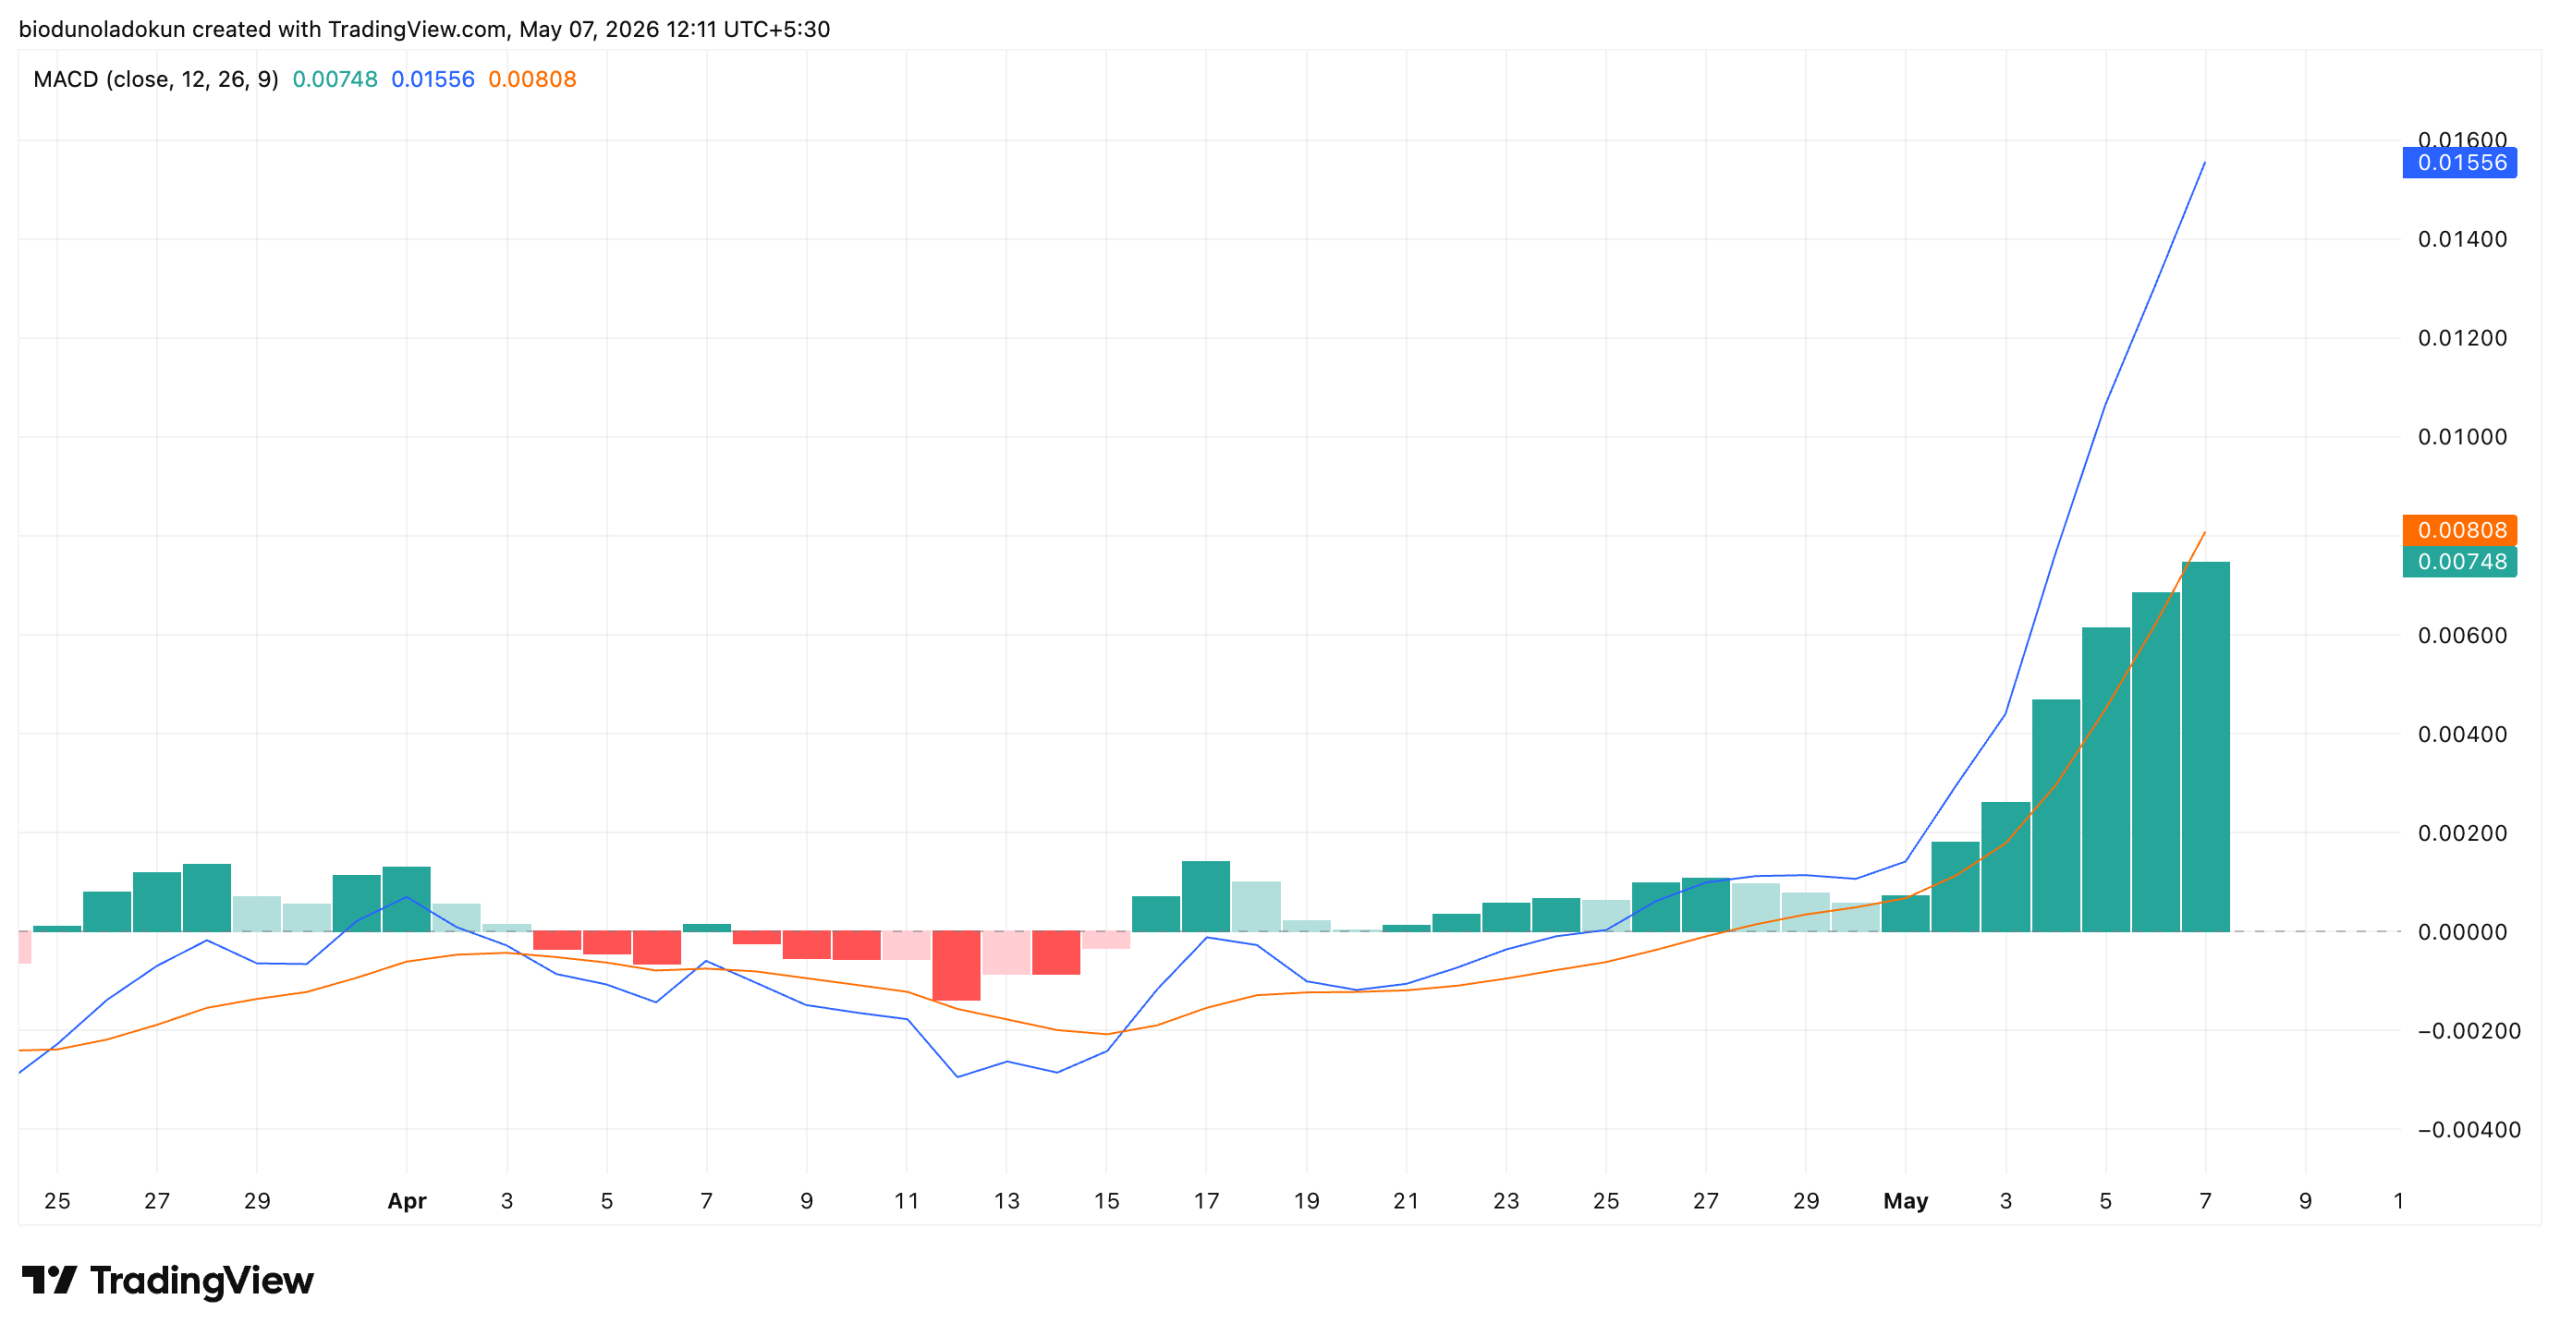
Moreover, ONDO’s Moving Average Convergence Divergence (MACD) indicator is firmly in bullish territory on the daily chart.
Since the most recent bullish crossover on April 15, ONDO’s MACD line (blue) has continued to extend higher above its signal line (orange) with the histogram printing increasingly tall green bars.
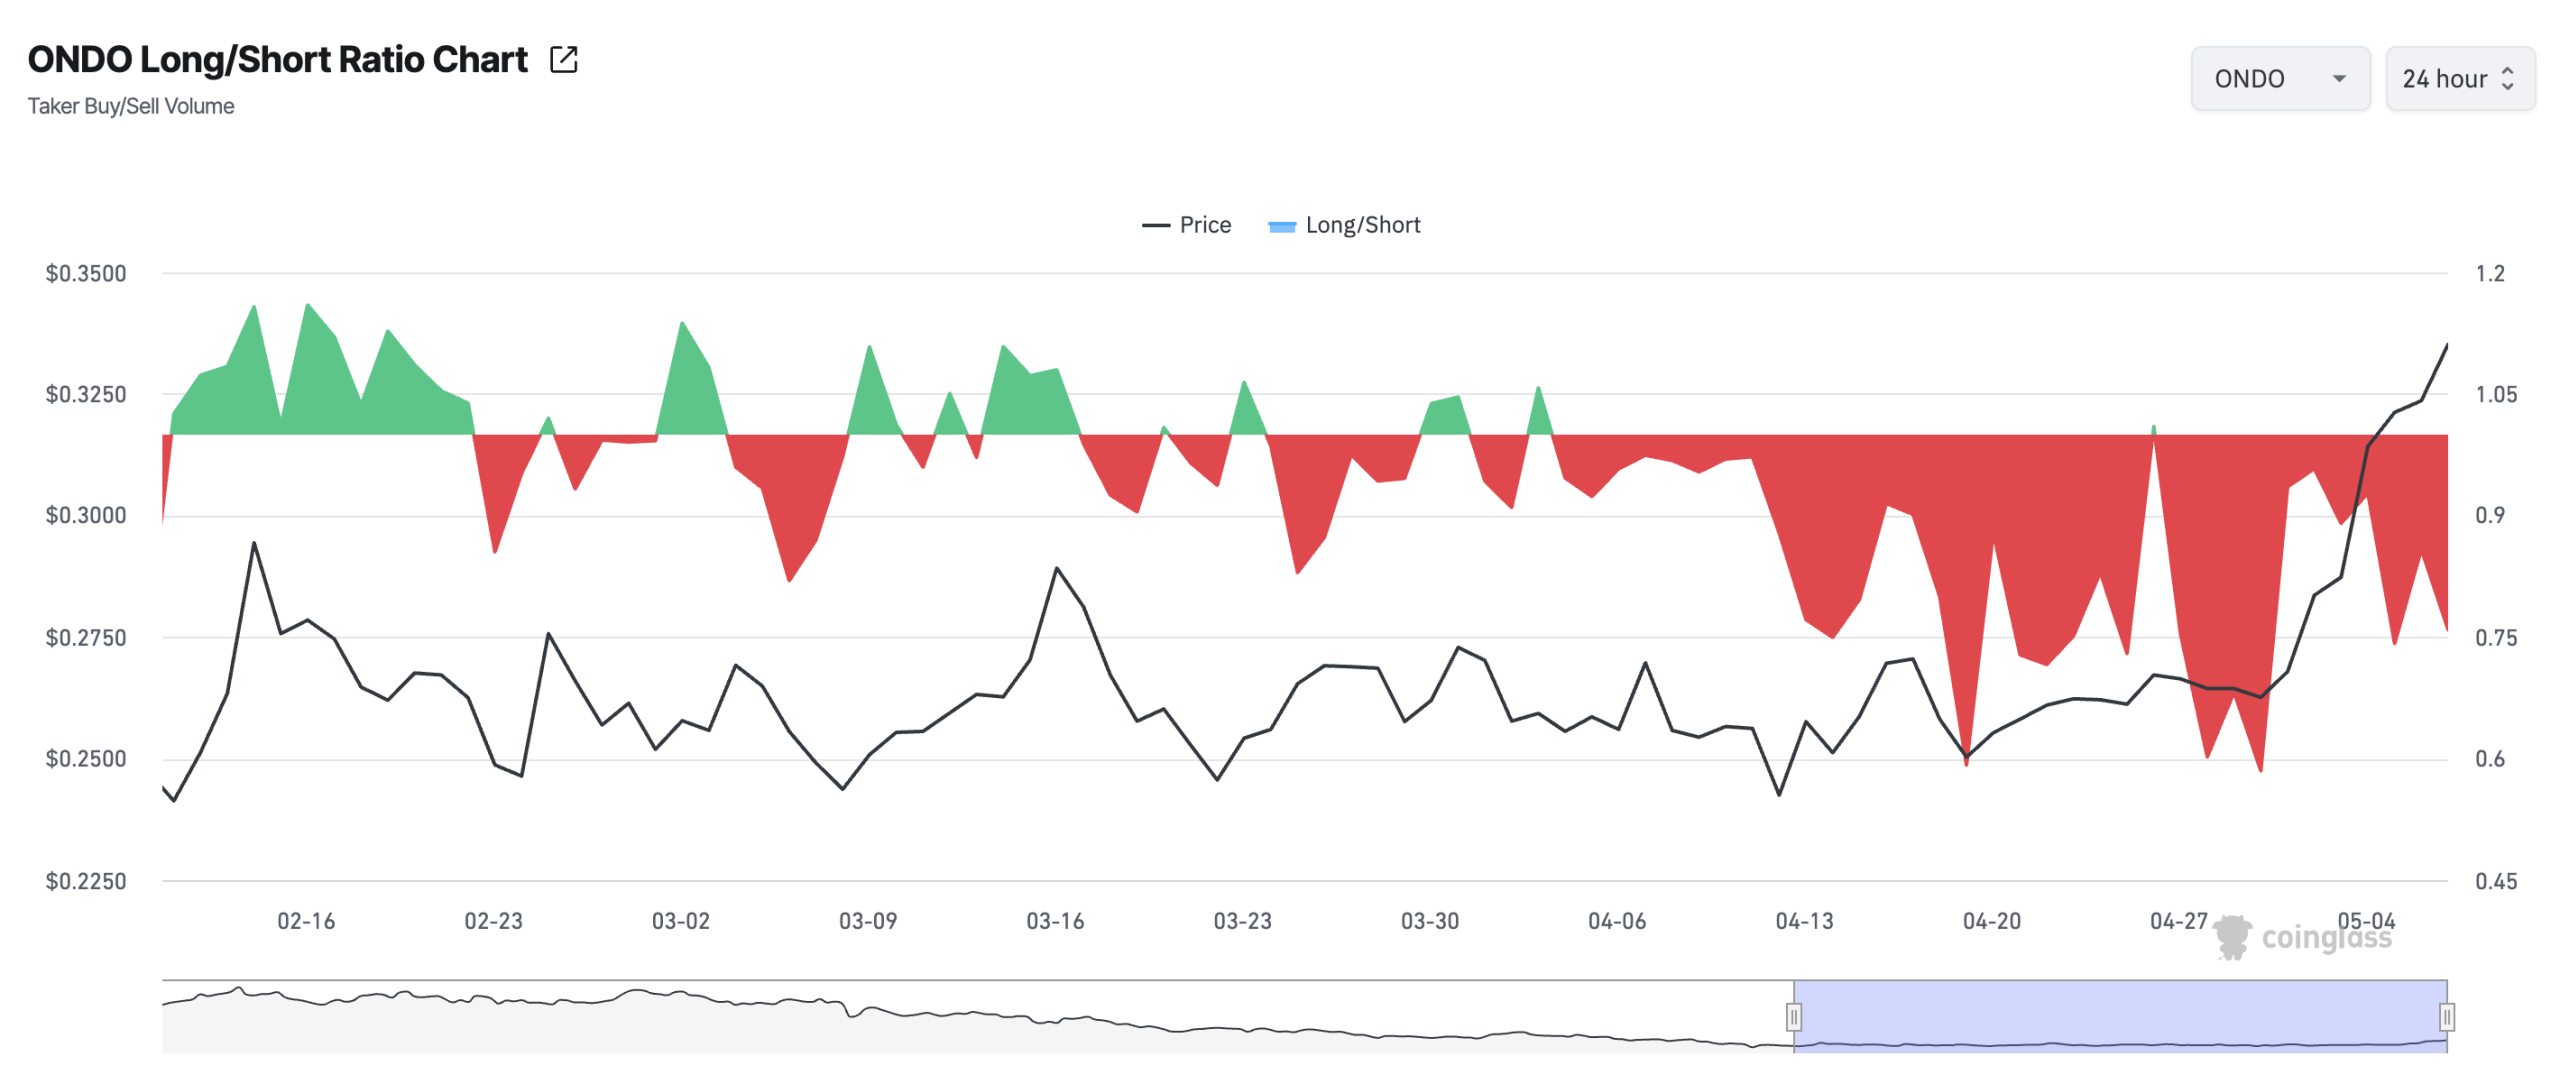
However, the token’s long/short ratio is currently tilted toward shorts. At press time, this sits at 0.758, maintaining a trend of holding below 1 since early May.
The long/short ratio measures the proportion of long positions versus short positions in the futures market.
A reading above 1 means more traders are positioned long, while a reading below 1 means short positions outweigh longs.
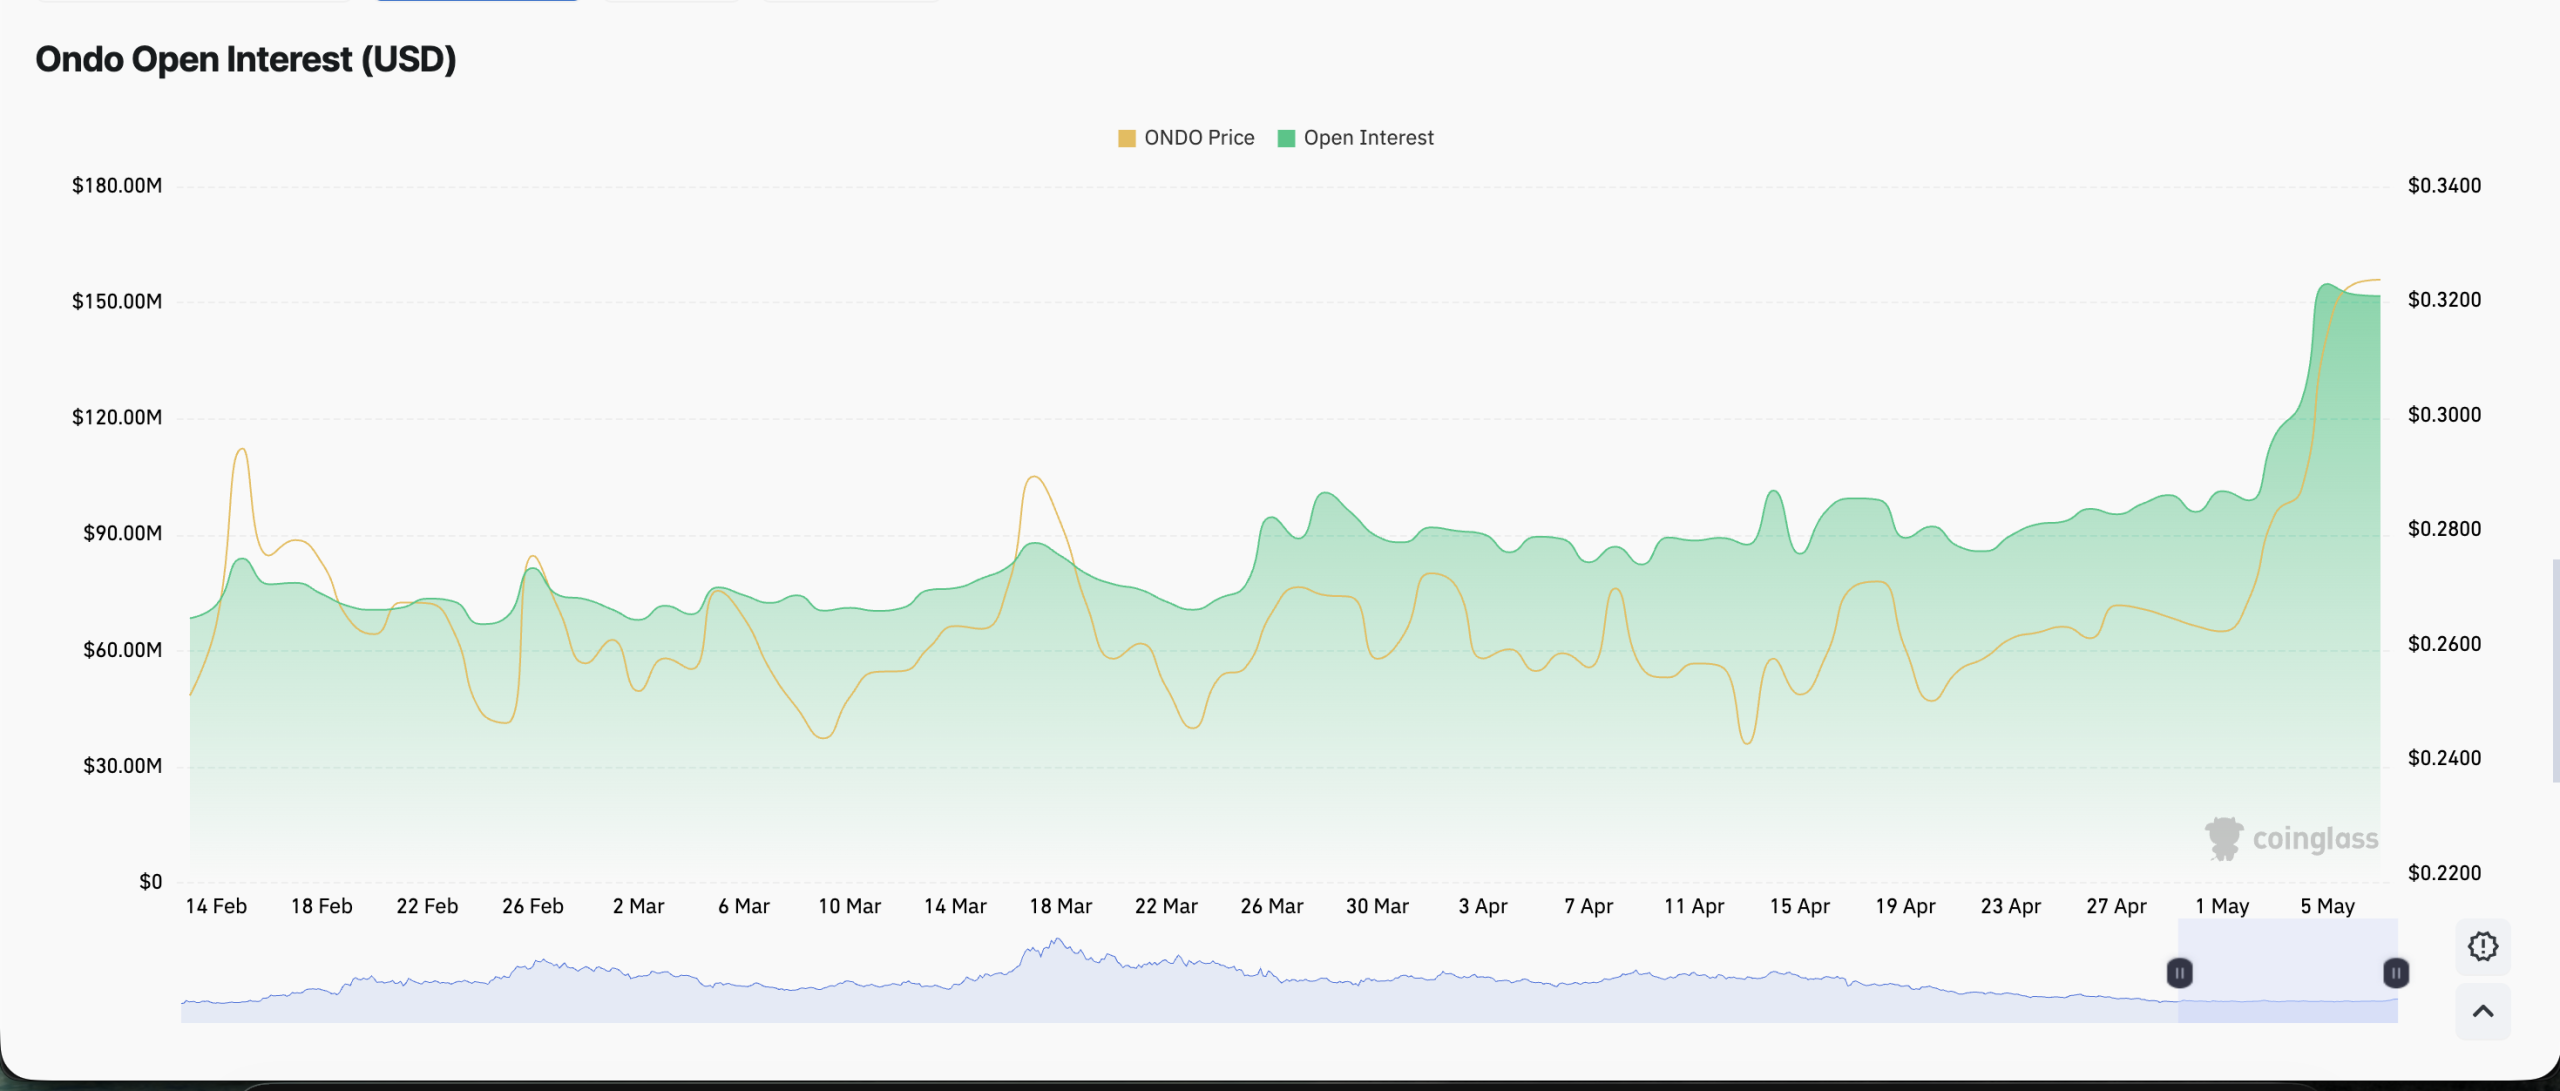
When this ratio sits below 1 while open interest climbs and price rises, it means a meaningful share of the capital flowing into futures is positioning for a pullback rather than chasing the rally.
While this can fuel a short squeeze if the price keeps grinding higher and forces shorts to cover, it also shows that ONDO futures traders are not convinced the current rally is sustainable at these levels.
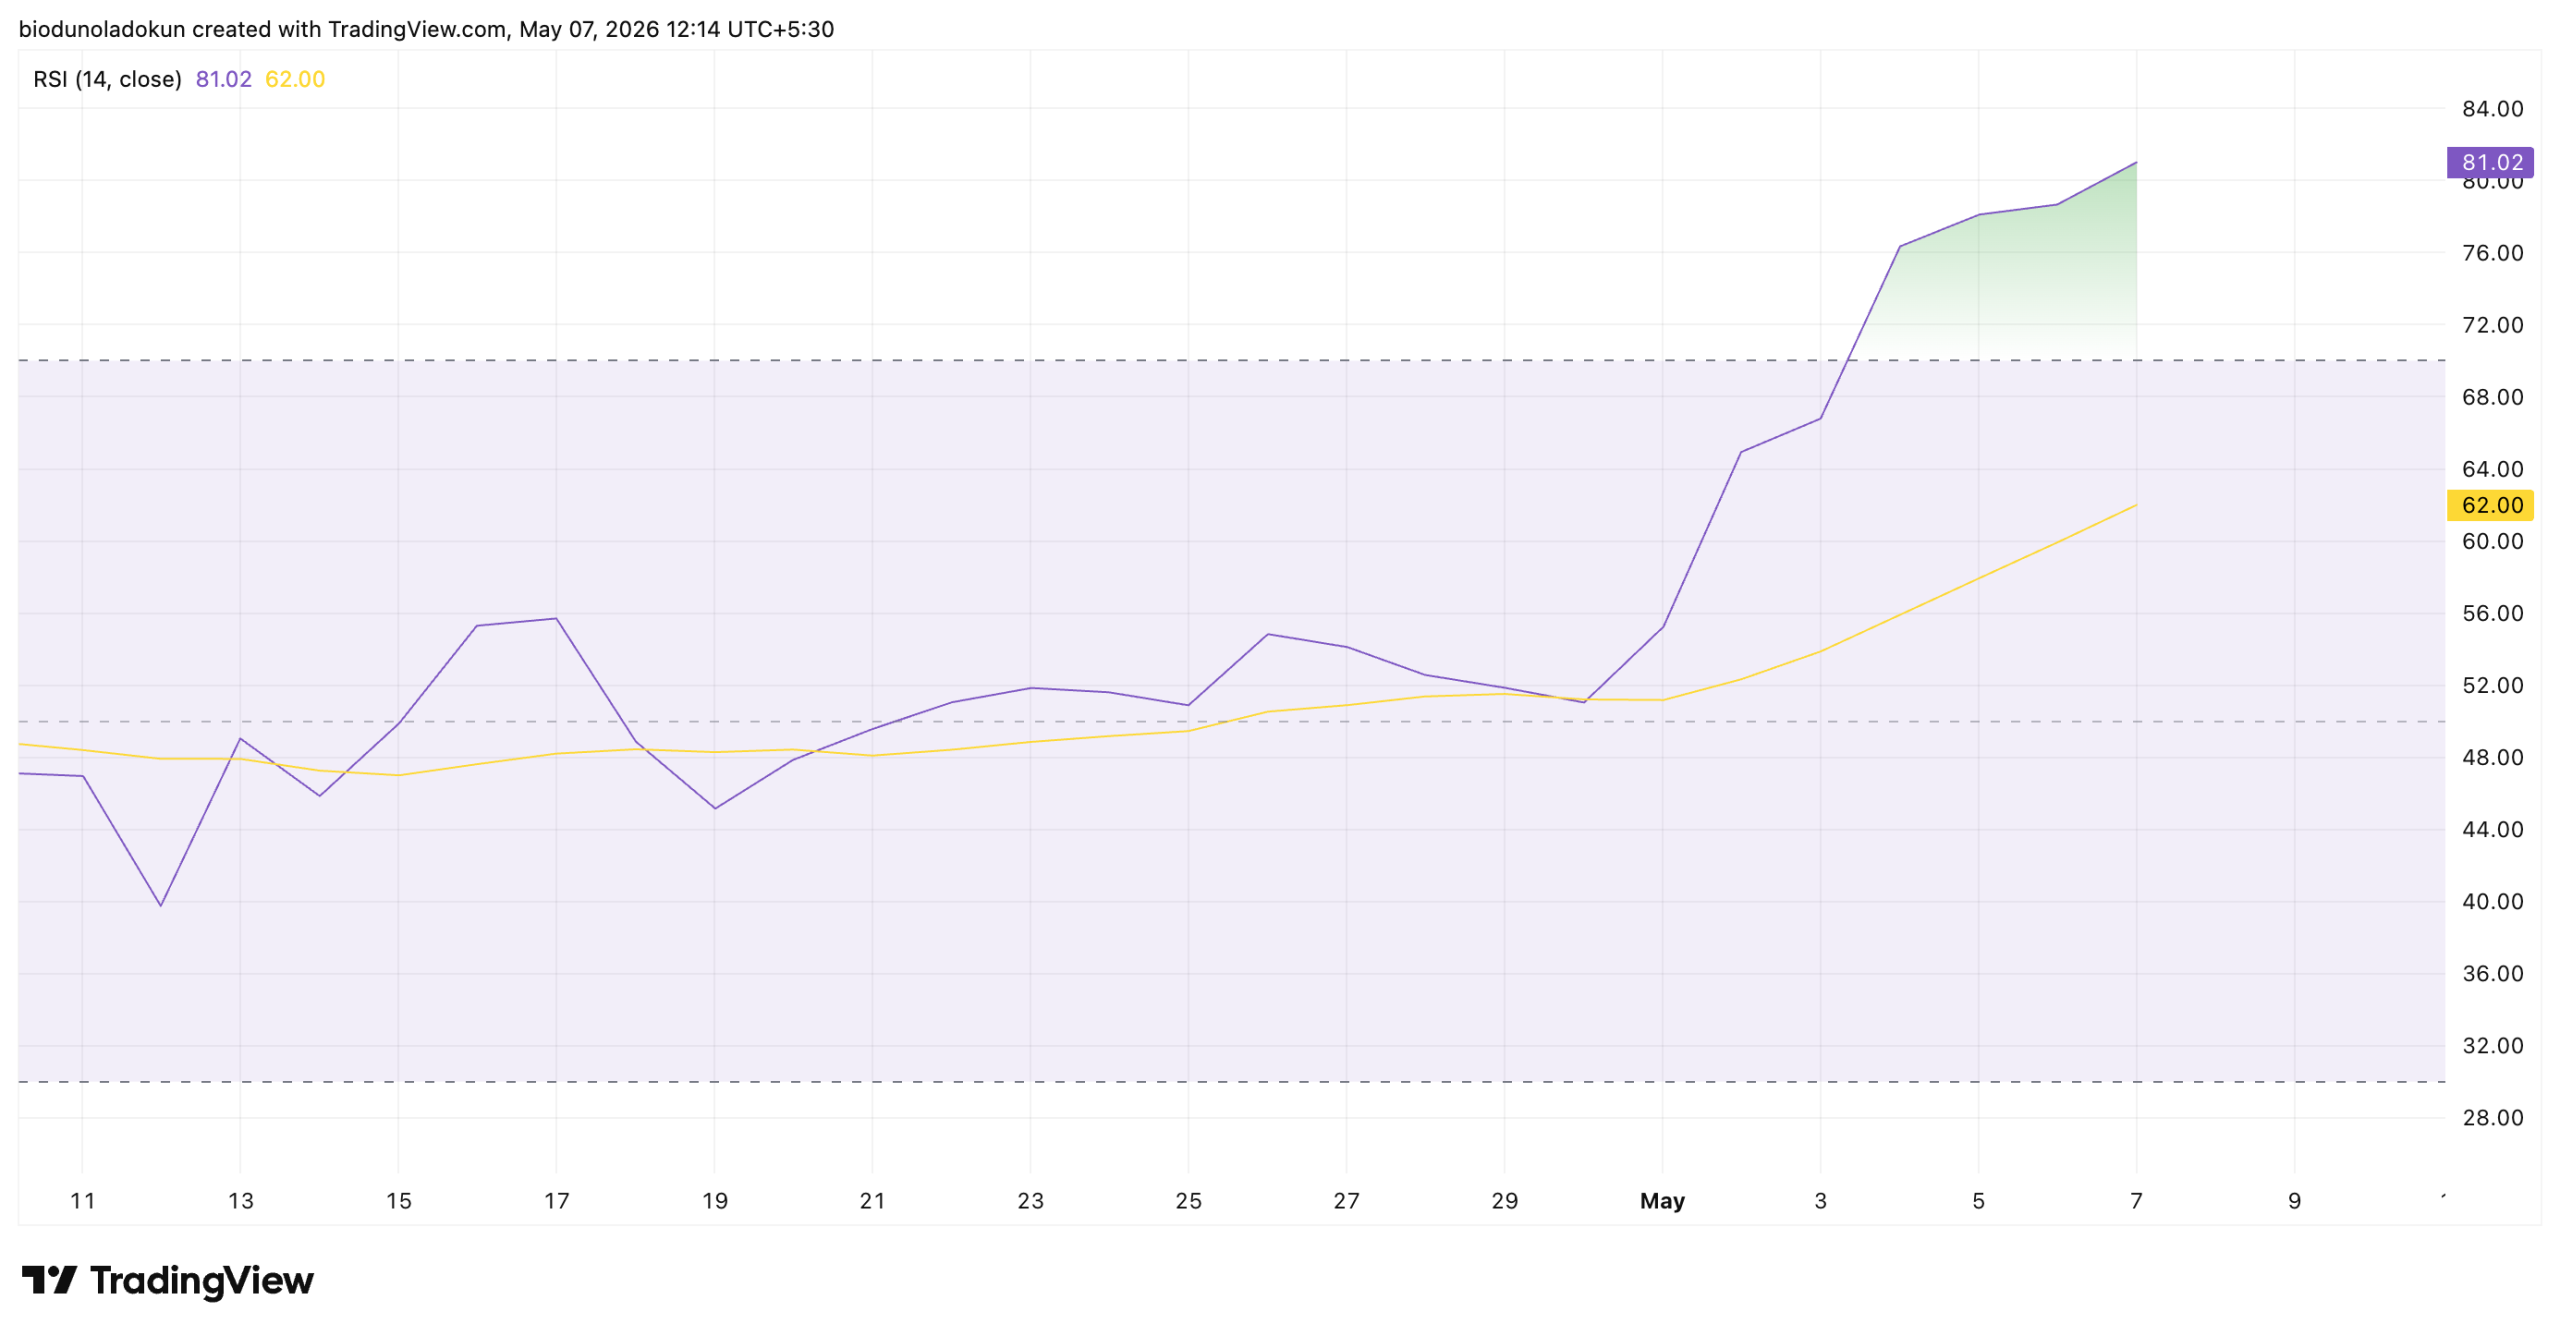
In addition, on the daily chart, ONDO’s Relative Strength Index (RSI) has pushed into overbought territory, indicating that a price cooldown may be near.
At press time, this momentum indicator sits at 81.02.
Values above 70 suggest the asset is overbought and due for a price decline, while values below 30 indicate the asset is oversold and due for a rebound.
At 81.02, ONDO’s RSI tells us it is overbought, and buyer exhaustion may soon set in, bringing prices lower.
ONDO Price Prediction: $0.3621 In Sight, But $0.2017 Risk Looms
ONDO’s near-30% rally this week has pushed its price above two key resistance levels — first reclaiming the 20-day EMA at $0.2853, then breaking through the $0.2942 level that had capped price growth since early February.
If spot demand continues to climb on the back of the JPMorgan-Mastercard-Ripple cross-border tokenization news, ONDO’s price may extend its gains and attempt to breach the $0.3621 zone.
On the flip side, if short bets win out and ONDO suffers a bearish reversal, the token could break below these newly reclaimed support floors.
A loss of both the $0.2942 level and the 20-day EMA would open the door for a deeper retracement toward the $0.2017 swing low last seen in early February.
Disclaimer:
The information provided in this article is for informational purposes only. It is not intended to be, nor should it be construed as, financial advice. We do not make any warranties regarding the completeness, reliability, or accuracy of this information. All investments involve risk, and past performance does not guarantee future results. We recommend consulting a financial advisor before making any investment decisions.
Abiodun Oladokun is a Research Analyst at CCN, where he covers cryptocurrency markets with a focus on on-chain analysis, technical assessments, and emerging trends across decentralized finance (DeFi), real-world assets (RWA), artificial intelligence (AI), decentralized physical infrastructure networks (DePIN), Layer 2s, and meme coins.
Prior to CCN, he served as a Senior On-Chain Analyst at BeInCrypto, producing market reports spanning diverse crypto sectors.
Before that, he conducted technical analysis and market assessments of various altcoins at AMBCrypto, where he also contributed long-form quarterly research papers on DeFi, NFTs, DAOs, and scaling architectures, leveraging on-chain platforms including Messari, Santiment, DefiLlama, and Dune Analytics.
He began his crypto career as a research analyst at SixthSense DAO, developing blockchain forensic tools to trace the history of stolen assets.
Abiodun is a lawyer called to the Nigerian Bar and the founder of Ilé Ijó, a Lagos-based electronic dance music collective.