The volume followed the price spikes to $277 million.
BIRB is likely to reach a new high after the pullback.
Moonbirds (BIRB) didn’t drift into attention; it forced its way there.
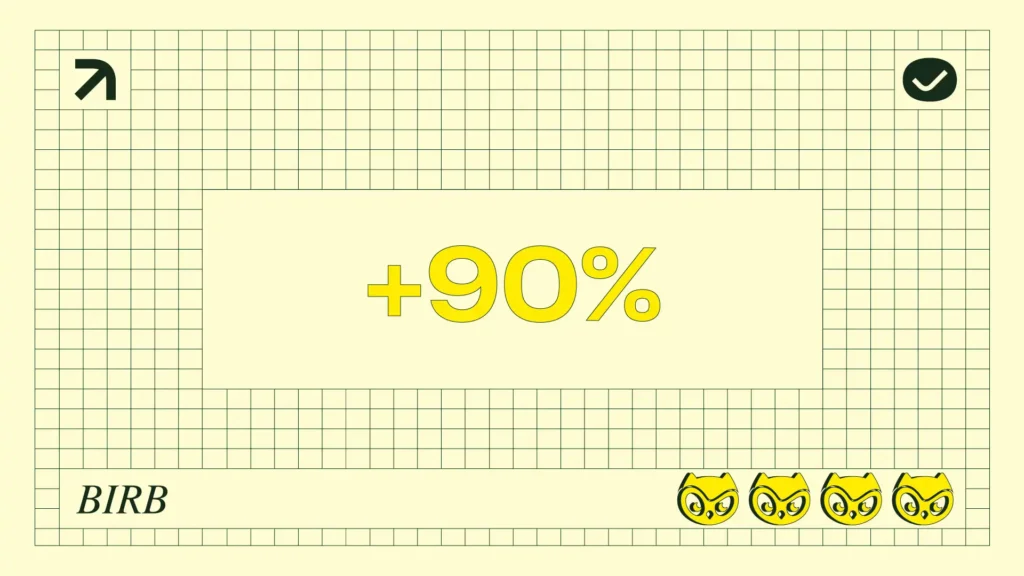
After launching over the past week, the token has ripped more than 90% in the last 24 hours.
Notably, the move didn’t happen in a vacuum.
Fresh listings on LBank, Bithumb, and Upbit acted like an ignition switch, pulling in liquidity and pushing participation high.
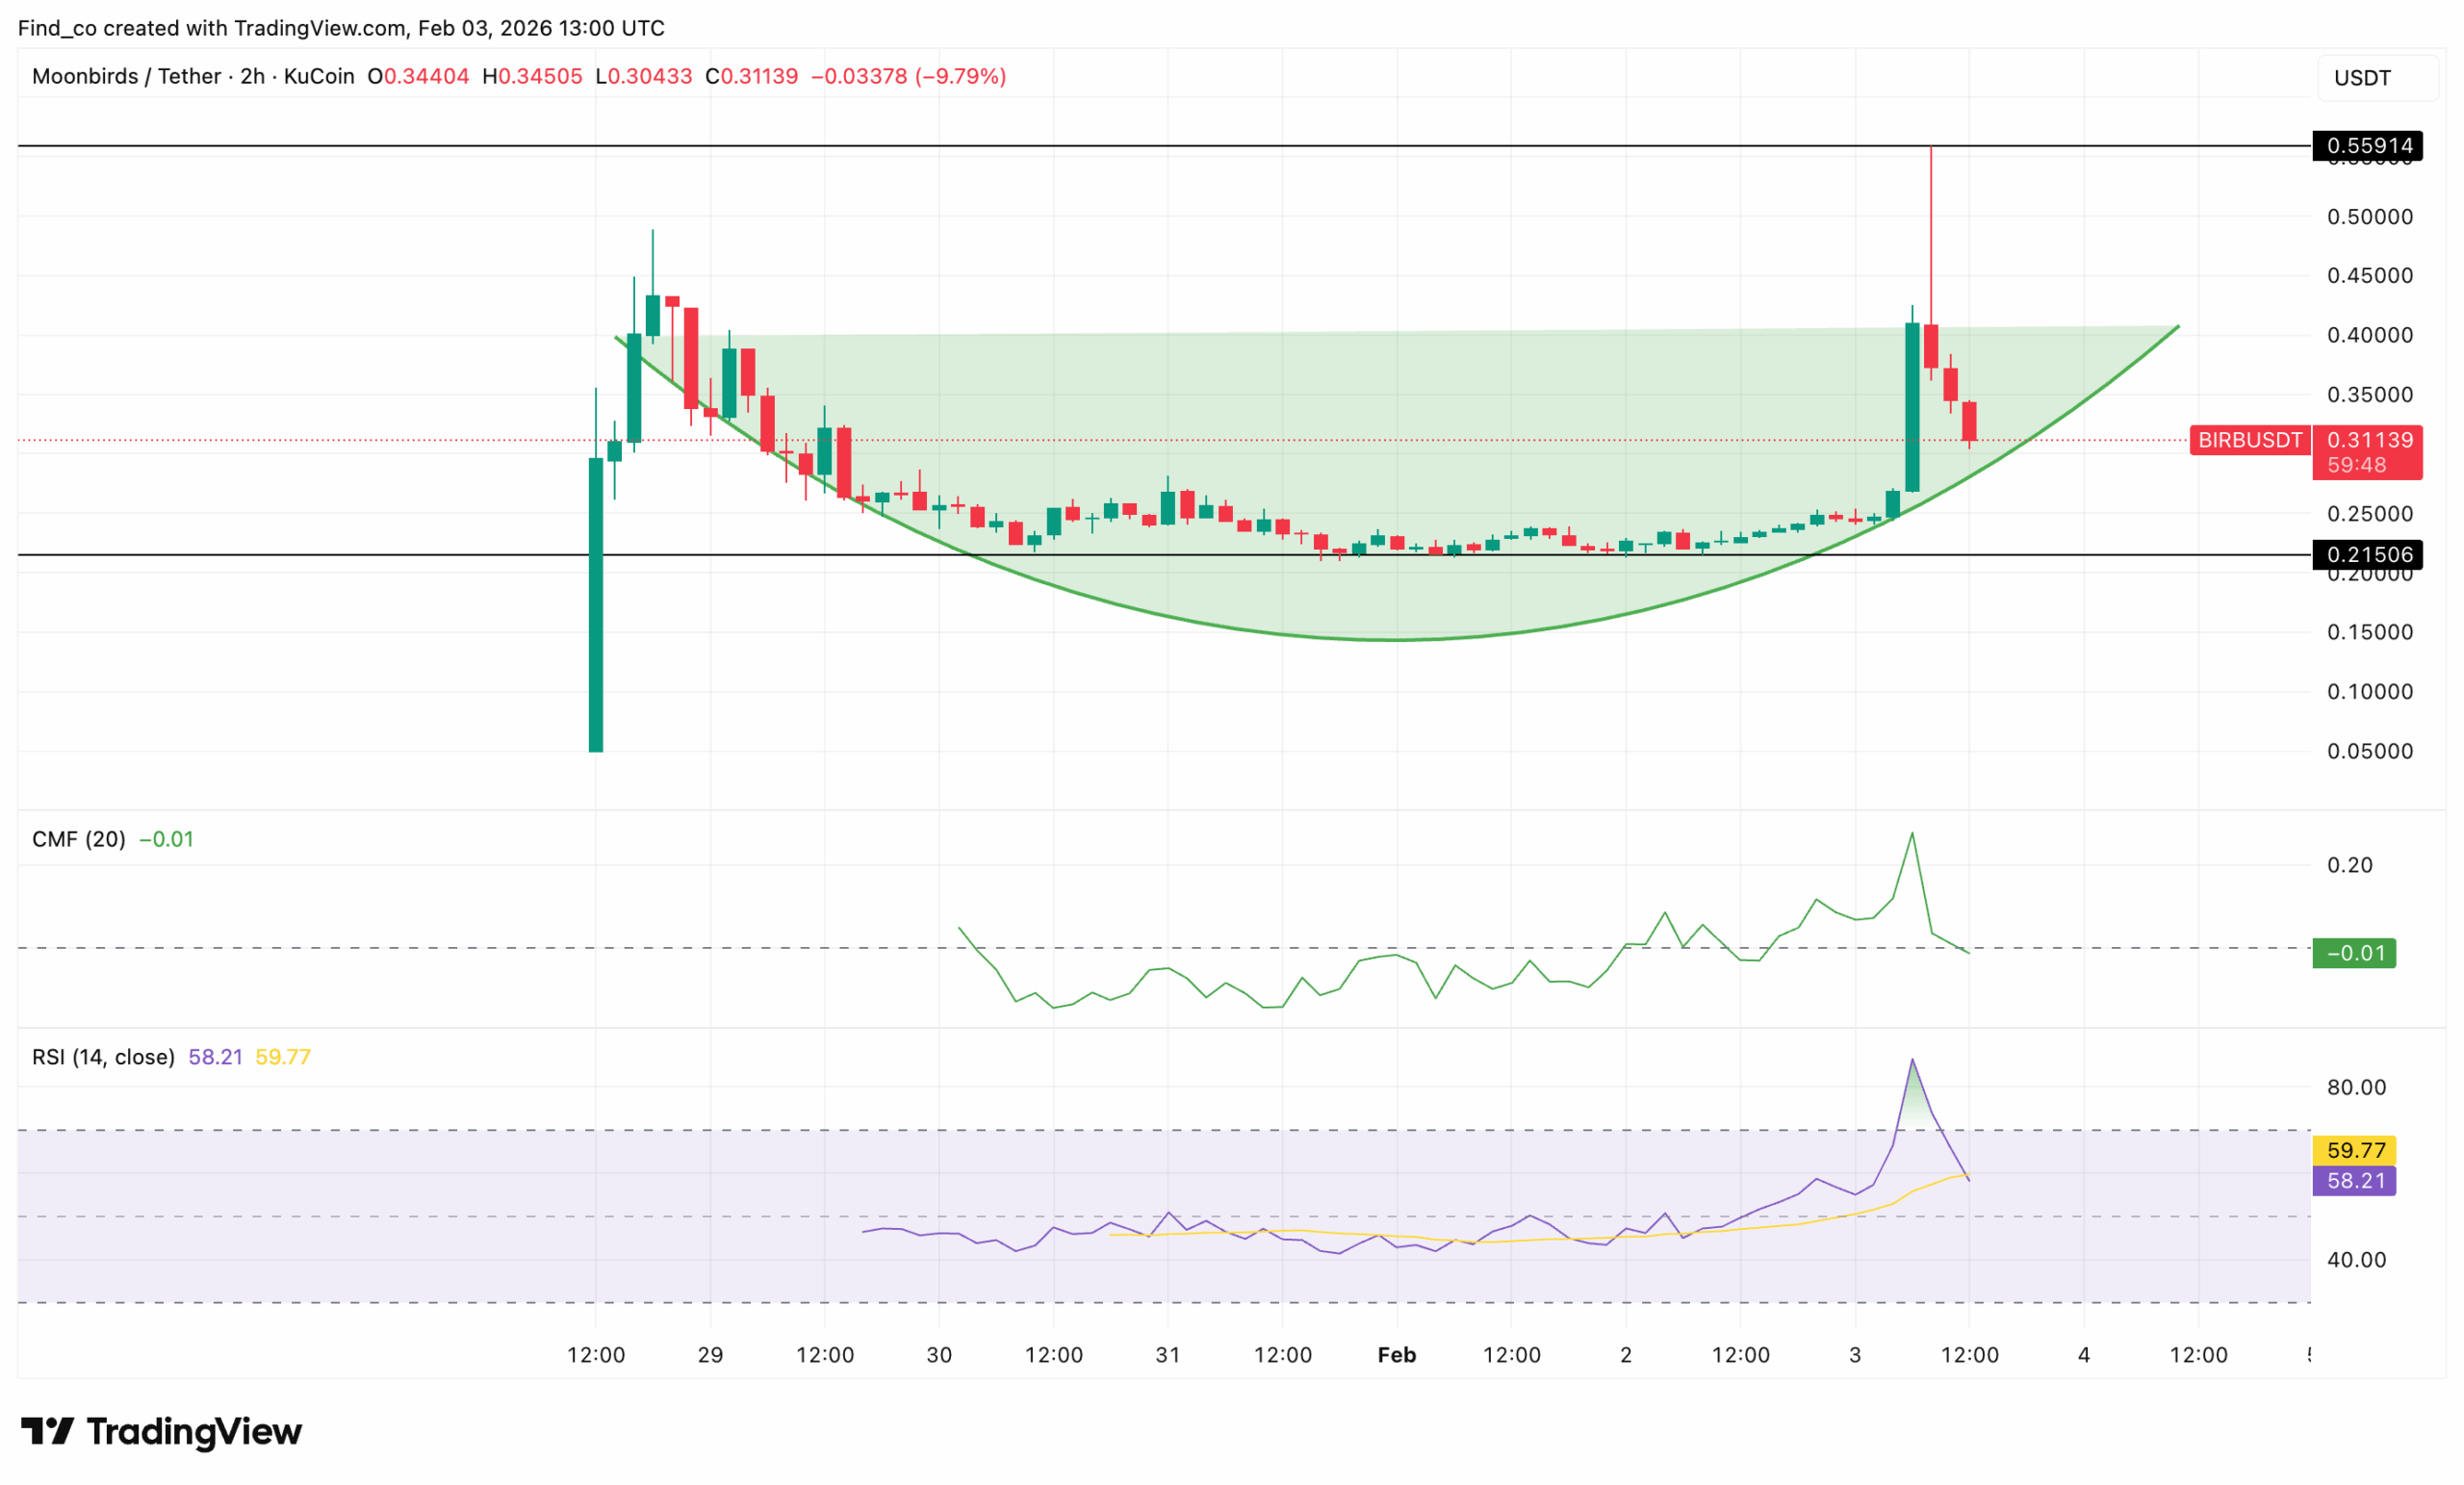
At the time of writing, the Moonbirds price briefly hit $0.48 before retracing. Here is a breakdown of what the project is about and what lies ahead for BIRB’s price.
What Is Moonbirds?
For those unfamiliar, Moonbirds has recently made a major transition from being an Ethereum-based NFT collection to a full-fledged cross-chain ecosystem.
As of this writing, the project has launched its native utility token, BIRB, on the Solana blockchain.
Originally launched in April 2022 by the PROOF Collective, Moonbirds is a collection of 10,000 pixel-art owl NFTs.
It became a “blue-chip” project known for its Nesting mechanism—a form of soft-staking where holding the NFT in your wallet “upgraded” its status and unlocked rewards without moving the asset.
In 2025, the brand shifted focus toward a “phygital” business model under Orange Cap Games, expanding into gaming (Vibes TCG) and physical consumer goods.
How About the BIRB Token?
BIRB is Moonbirds’ native ecosystem token powering this new economy. Here are the key things to note about it:
Blockchain: Solana (migrated from its Ethereum roots for lower fees and speed).
Total Supply: 1 Billion tokens.
Launch Date: Jan. 28, 2026.
Utility:Governance: Voting on ecosystem proposals.
Gaming: Primary currency for the Vibes Trading Card Game (TCG).
Commerce: Used to redeem physical collectibles and merchandise.
27% of the total supply is dedicated to the community (NFT holders).
Eligibility
Primarily based on holding Moonbirds NFTs and your “Talon” balance (points earned via nesting/engagement).
Vesting
Important: Tokens are subject to a 24-month linear vesting schedule. You get roughly 4.17% of your allocation per month to prevent immediate mass sell-offs.
Where to Claim
Claims are handled through the official PROOF.xyz website or the dedicated Moonbirds portal.
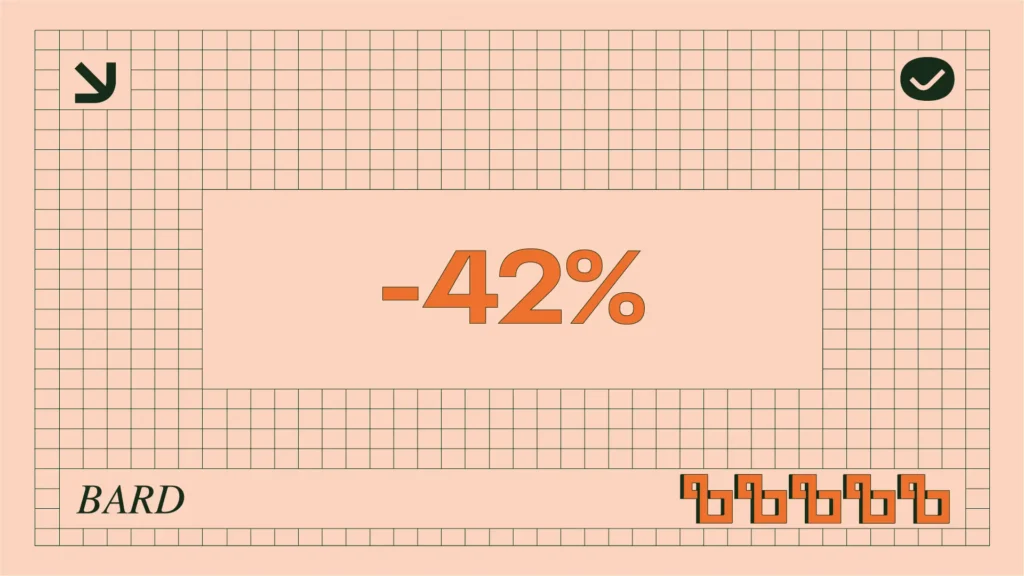
Volume Surges
What’s notable is that Moonbirds’ move isn’t happening on price alone. The volume is expanding with it.
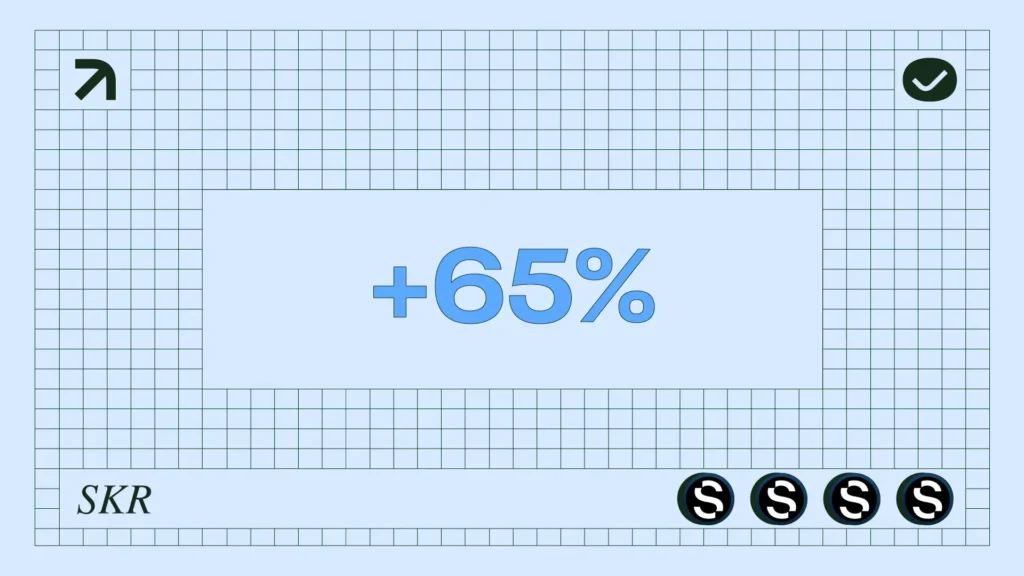
Over the past 24 hours, trading activity has surged roughly 570%, pushing turnover to around $277 million.
That matters because breakouts backed by rising volume tend to be more durable.
The flip side is that volume spikes at this scale can also mark a “crowded candle.”
When turnover explodes that quickly, it often reflects a mix of fresh buyers and early holders distributing into strength.
If the added volume shows up as steady bid support on pullbacks, it can help BIRB’s price grind higher and build acceptance above resistance.
But if the volume is mostly churn at the top, it can precede sharp volatility and faster retracements even if the broader trend remains intact.
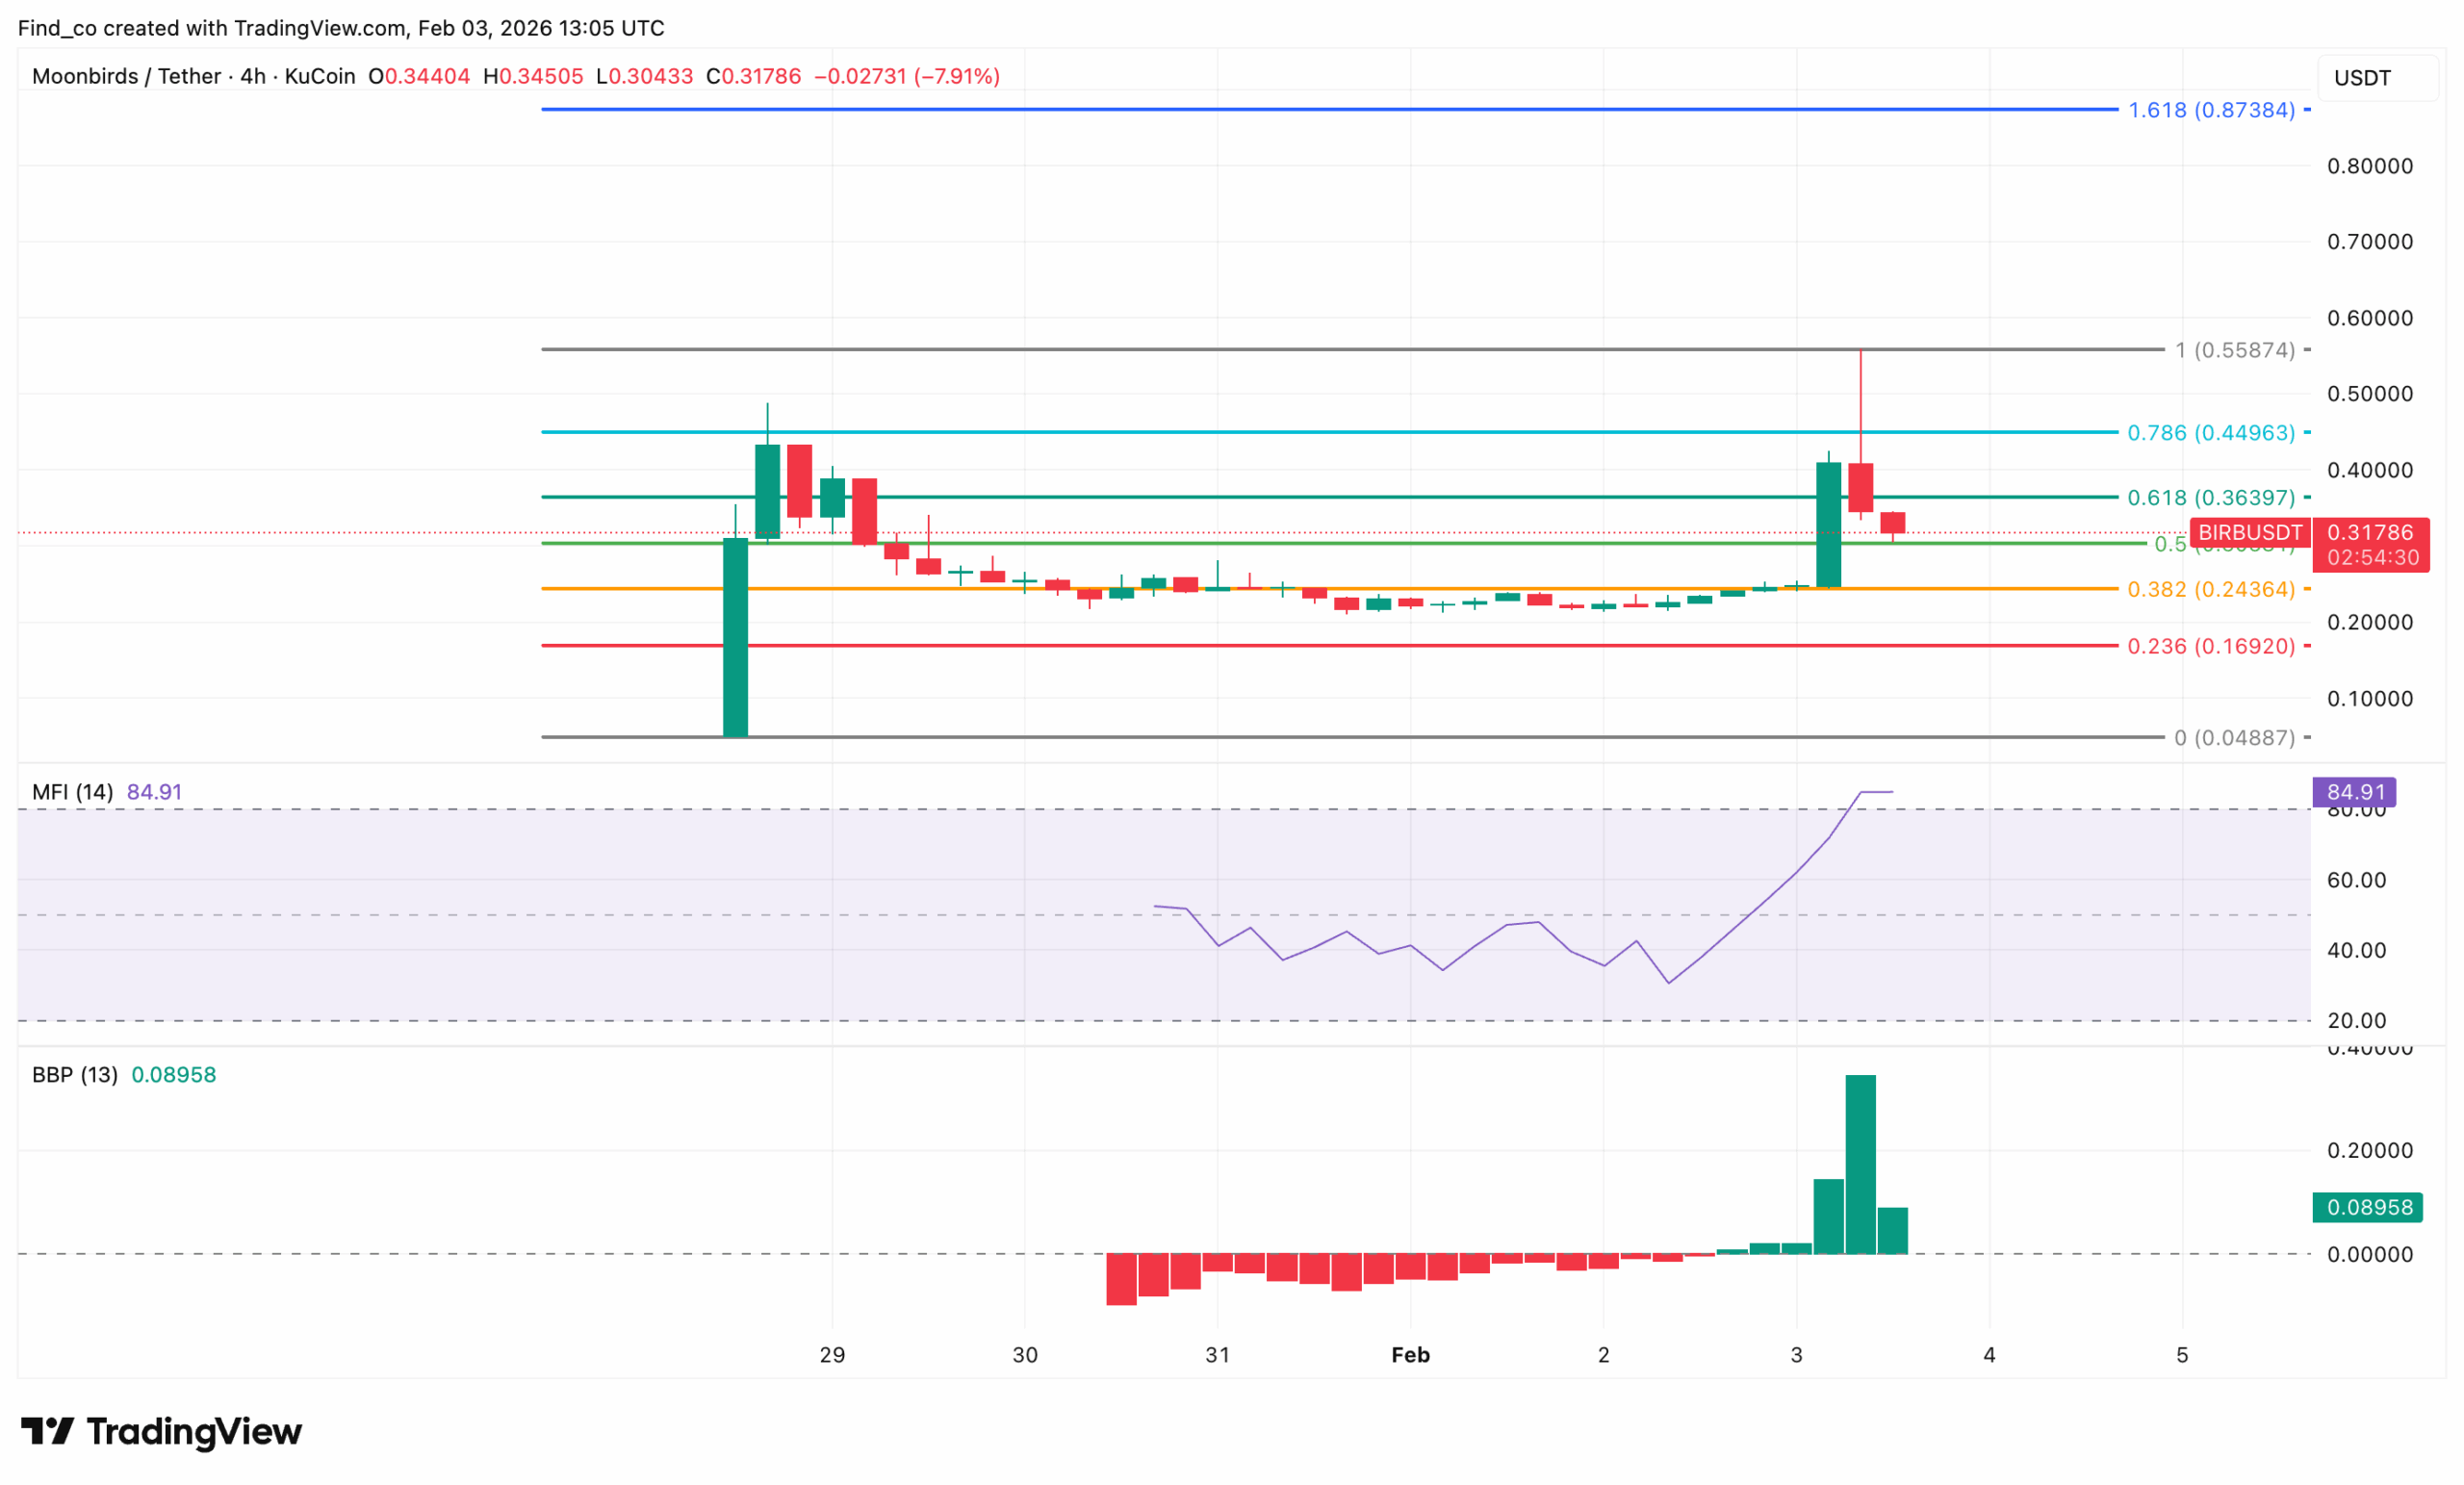
BIRB Price 4-Hour Analysis
On the 2-hour chart, flows are still leaning supportive. For context, the Chaikin Money Flow (CMF) is slightly above the zero line, around 0.07, suggesting capital is still entering rather than quietly exiting.
The Relative Strength Index (RSI) is already stretched near 74, indicating the market is admitting the move is extended.
However, overbought readings tend to show up early in impulsive runs, not just at tops.
The more important signal is that price is still printing higher highs and higher lows, and that the breakout through the $0.30–$0.32 band has flipped prior resistance into support.
As long as that zone holds, dips look more like resets than failures.
MFI being deep into overbought territory confirms heavy buying pressure. But it has also raised the odds of sharp pullbacks that feel violent even if they’re technically normal.
Furthermore, the Bull Bear Power (BBP) has stayed positive, reinforcing that bulls still have the upper hand.
The key technical reference right now is the 0.618 Fibonacci level around $0.44.
A break and hold above it would act like a green light for continuation, because it signals the market is absorbing supply at a level that often stalls rallies.
If Moonbird’s price fails there, the risk isn’t necessarily trend death — it’s a sharp mean reversion back toward the mid-$0.20s, with $0.24 as the more obvious reset zone inside the broader uptrend channel.
Disclaimer:
The information provided in this article is for informational purposes only. It is not intended to be, nor should it be construed as, financial advice. We do not make any warranties regarding the completeness, reliability, or accuracy of this information. All investments involve risk, and past performance does not guarantee future results. We recommend consulting a financial advisor before making any investment decisions.
Victor Olanrewaju is a crypto analyst and reporter at CCN with deep roots in on-chain research and technical analysis. His crypto journey began in 2017, but it was the 2020 Uniswap airdrop that sparked a full-time pivot into the space.
With a foundation in copywriting, Victor honed his craft creating high-converting content for leading crypto brokers — most notably an XRP price prediction that ranked #1 on Google during the 2021 bull run.
He later joined AMBCrypto in 2022, where he combined storytelling with technical and on-chain analysis to cover key market narratives.
In 2024, he expanded his expertise at BeInCrypto, collaborating with analysts and using tools like Glassnode, Santiment, and IntoTheBlock to break down Bitcoin and altcoin trends.
At CCN, Victor covers the top cryptocurrencies, memecoins, macro shifts, blending real-time insights with deep-dive metrics.
He holds a Bachelor’s degree in Physics from the University of Ibadan, equipping him to simplify complex data for a wide audience. Follow his work or connect on LinkedIn or X.