Meet the Top 101 in Crypto

Crypto Market Stages Comeback as Stock Market Nearly Hits All-Time High

Last Updated 27 November 2025
Valdrin Tahiri
Authors
Edited by Insha Zia

Key Takeaways

  • The cryptocurrency market rebounded over the weekend and has continued its upward trend throughout the week.

  • The Stock Market also rebounded, and the S&P 500 is less than 2% away from its all-time high price.

  • Traders are wondering why the cryptocurrency market is rising, and whether the upward movement marks a bullish trend reversal.

The question “why is crypto going up?” has become the dominant narrative this week.

Crypto rebounded sharply over the weekend, despite sentiment being profoundly negative following a 30 percent crash from the October highs.

At the same time, the stock market surged, Google hit fresh all-time highs, and the S&P 500 broke back above significant resistance, erasing last week’s fear of an AI-driven bubble.

Meanwhile, tensions between JPMorgan and MicroStrategy escalated again, adding to the already tense backdrop.

Here’s what’s actually driving the bounce.

Why Is Crypto Going Up?

The crypto market has collapsed by 30% since its October all-time highs.

There are numerous theories as to why the crash occurred, the most notable being presented by Tom Lee.

Get These Top Crypto Casino Offers Now!
Sponsored
Disclosure
Opened in 2023
Promotions
200% deposit bonus up to 20,000 USDT + up to 100 FS (promo code: CG100)
Coins
Tether Bitcoin Ethereum USD Coin TRON +7
Opened in 2021
Promotions
Casino No Wagering 100 Free Spins
Coins
Bitcoin Tether USD Coin Ethereum Solana +11
Opened in 2018
Promotions
500% Welcome Bonus up to $90,000 + 100 Free Spins
Coins
Bitcoin Ethereum Litecoin Tether Dogecoin +3
Show More

Tom Lee believes that a stablecoin crash to $0.65, likely USDe, caused forced liquidations.

Its decline has been swift, with only a little retracement in the form of weak bounces.

Crypto Daily
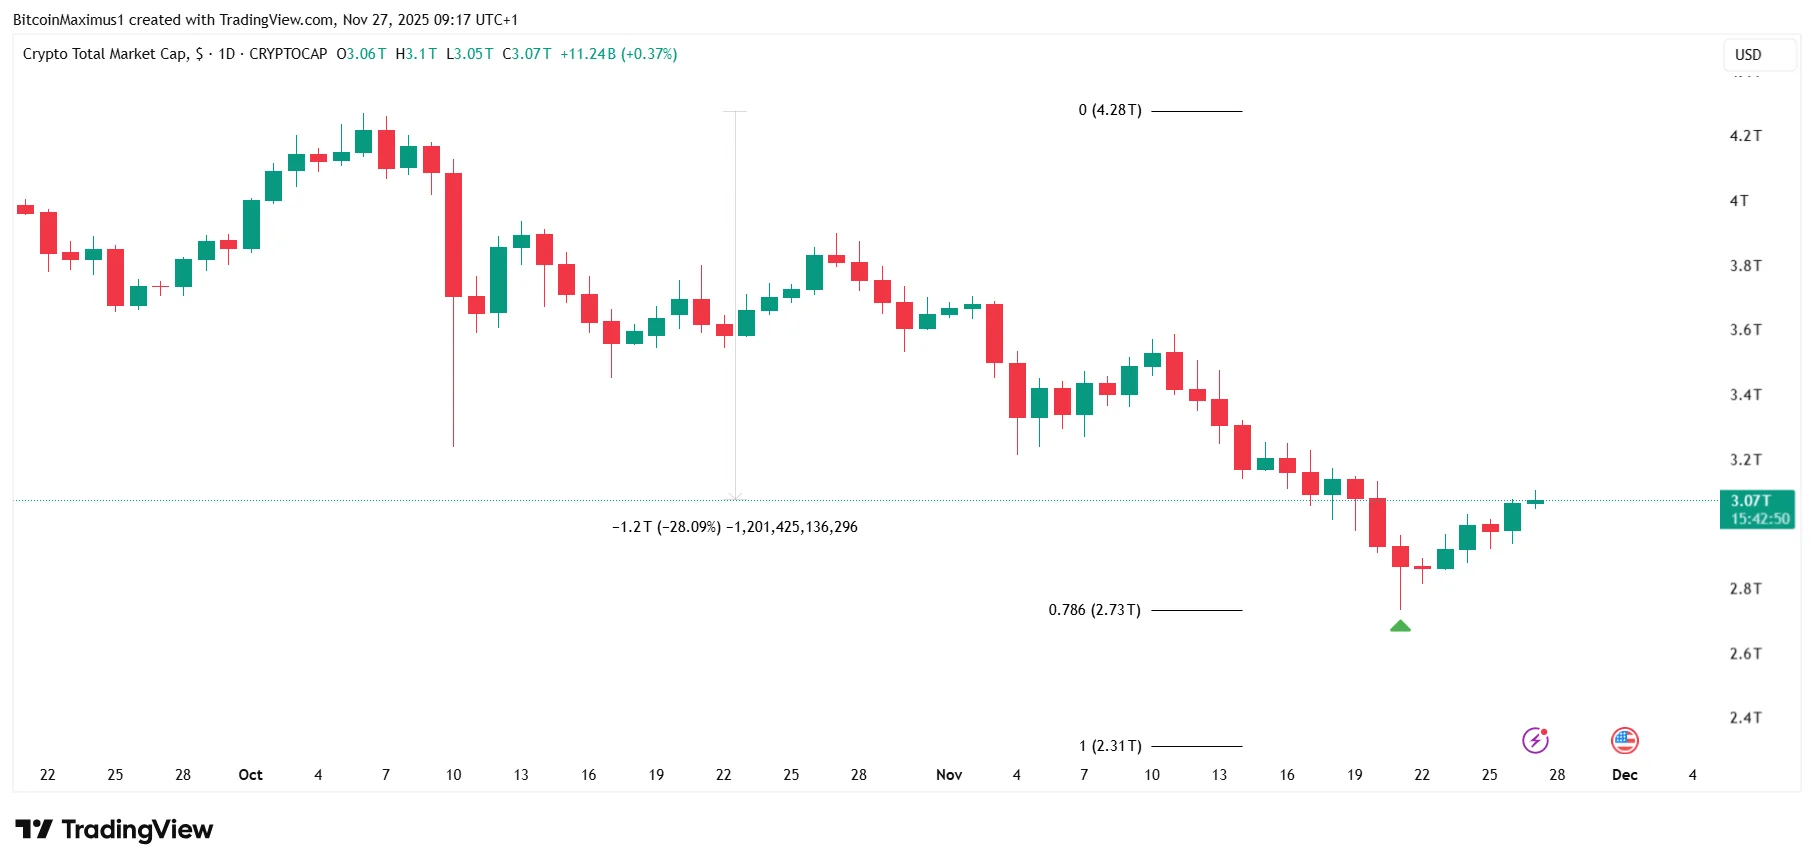
TOTALCAP Daily Chart | Credit: Valdrin Tahiri/TradingView

Friday’s rebound marked a clear turning point.

The charts show the exact spot when the previous crypto market decline ended (green icon).

More specifically, it is right at the 0.786 Fibonacci retracement support level at $2.73 trillion.

Trend is Gradually Turning Bullish

Several encouraging signals are forming when zooming in.

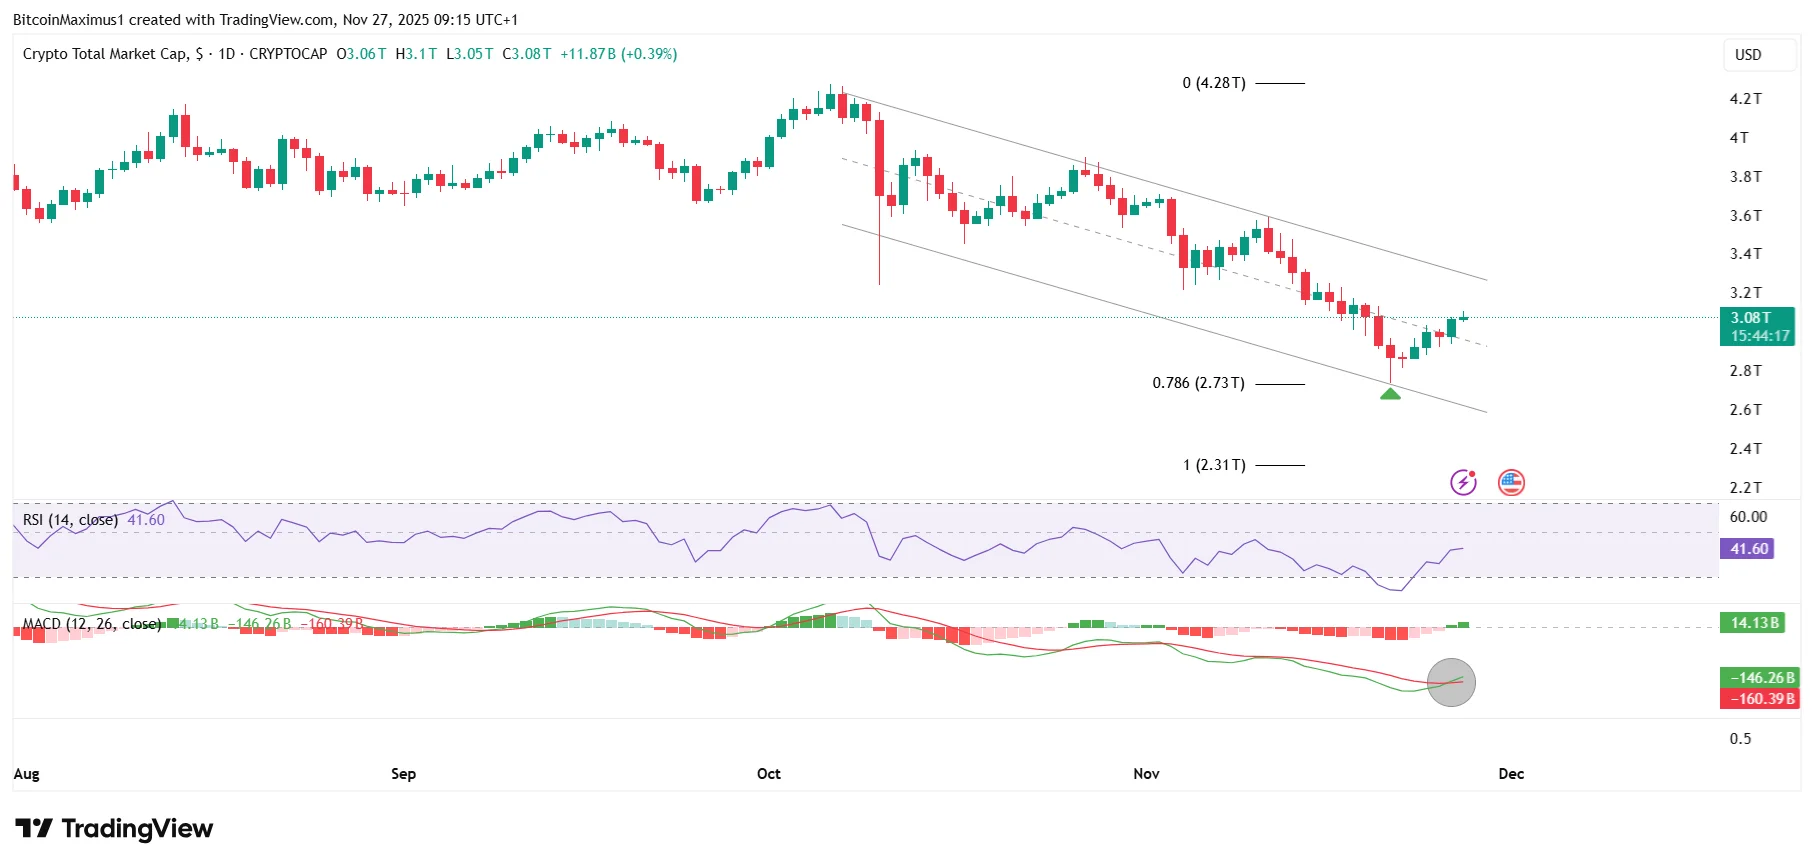
After the bounce, TOTALCAP moved into the upper portion of its descending parallel channel.

This is a constructive shift that has not happened in weeks.

The channel’s midline is likely to provide support if a pullback occurs.

Momentum indicators are also improving. The Relative Strength Index (RSI) has moved above 30, indicating that bulls are gaining the upper hand.

TOTALCAP Daily
TOTALCAP Daily Chart | Credit: Valdrin Tahiri/TradingView

The Moving Average Convergence/Divergence (MACD) indicator made a bullish cross (indicated by a black circle), a sign of positive momentum.

These signals indicate that the short-term bounce may continue until the channel’s resistance trend line.

Then, traders should closely watch the channel’s resistance at $3.3 trillion for signs of a reaction.

S&P 500 Approaches All-Time High

One of the biggest drivers behind the crypto market rebound is the strength in global markets.

The Stock market surged on the back of positive performance from Google, negating Nvidia’s previous crash.

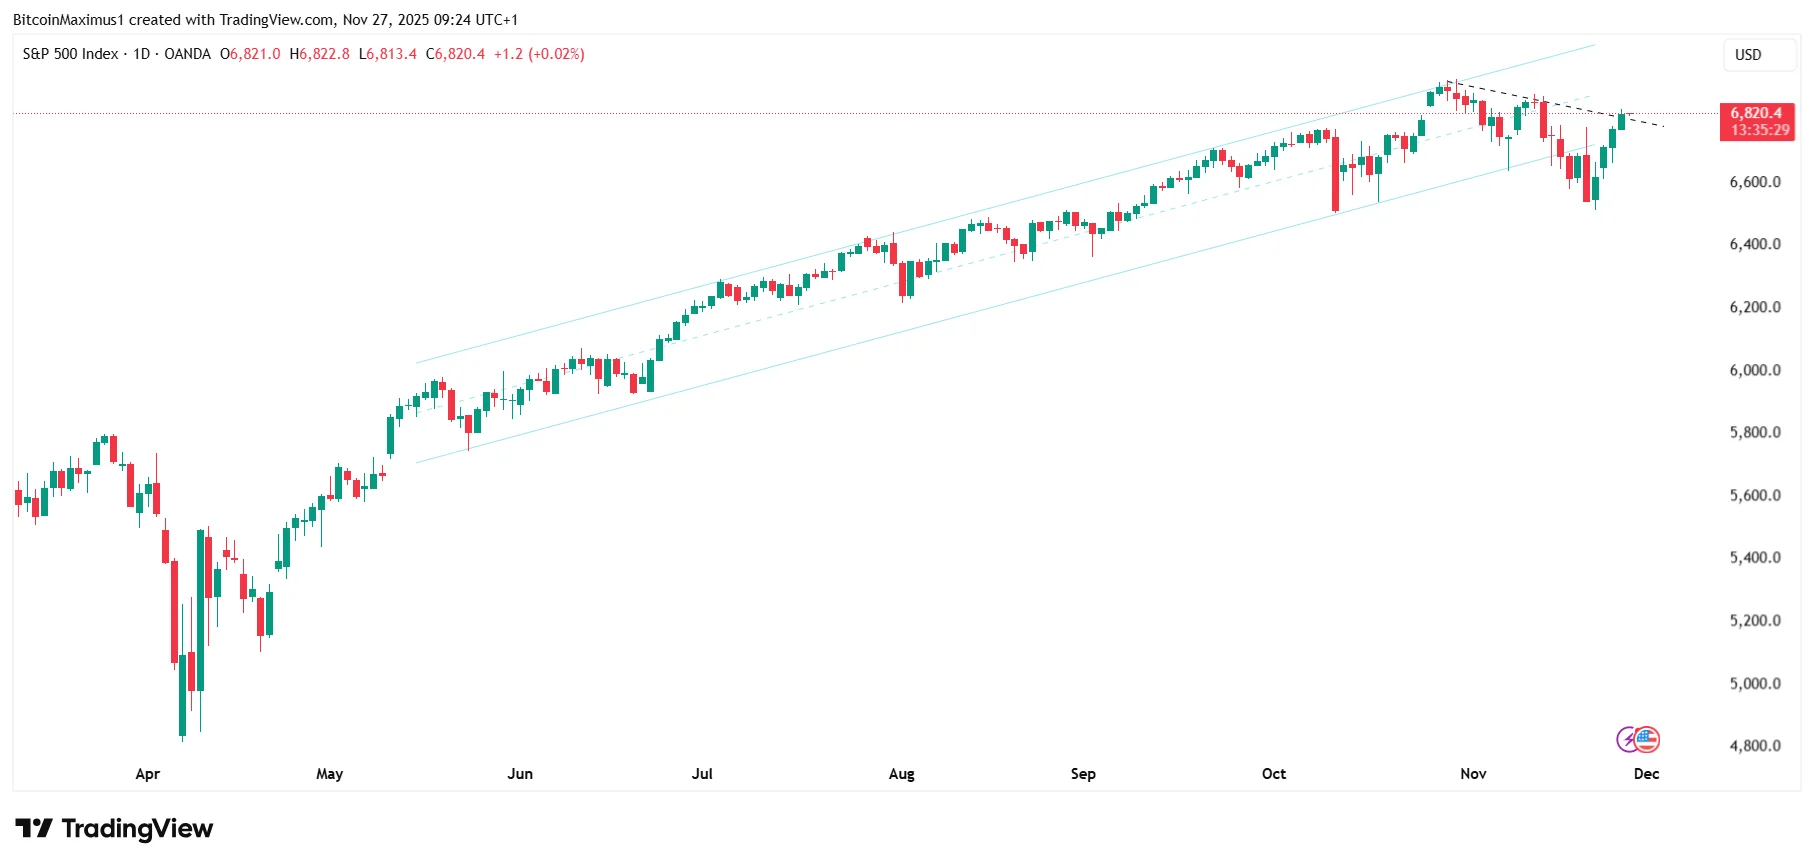
Today, the S&P 500 is breaking out from a diagonal resistance trend line (dashed).

However, this is not the most critical chart movement.

SP500
S&P 500 Daily Chart | Credit: Valdrin Tahiri/TradingView

This is because the S&P 500 has reclaimed the previous ascending parallel channel.

As a result, it negated a breakdown from a six-month structure.

Failed breakdowns often lead to rapid upward movements, so traders are closely watching to see if the S&P 500 will continue surging.

Well-known investor Amit captured the mood shift perfectly.

“Last week the S&P was down 4% and people feared an AI bubble. Today it’s 1% from all-time highs, rate cuts look likely, retail is recovering, and the labor market is weak but not disastrous.”

JPMorgan–Strategy Feud

While markets recover, JPMorgan reignited its clash with MicroStrategy (rebranded as Strategy).

Recently, JPMorgan research issued a note, warning that MicroStrategy could be removed from major equity indices, most notably the MSCI USA Index, one of Morgan Stanley’s flagship benchmarks.

The warning comes at a time when Strategy is already struggling to trade above its net asset value (NAV).

In practical terms, the market now values the company at less than the Bitcoin it owns.

As of today, Strategy remains the world’s largest corporate holder of Bitcoin, with 649,870 BTC worth approximately $56 billion.

Yet its market cap sits at just $49 billion—underscoring the depth of the discount and the concerns JPMorgan raised.

Michael Saylor Pushes Back

Strategy CEO Michael Saylor pushed back at JPMorgan’s assessment.

He retorted by saying that Strategy is not a fund or a trust, but a company with a software business.

In its view, the Bitcoin holdings are only a unique treasury strategy.

The crypto community is also pushing back.

They perceive the JPMorgan note as a coordinated attack by traditional finance.

Billionaire Max Keiser added fuel to the fire.

He warned that JPMorgan’s massive short position could be liquidated if MSTR’s price increases by 50%.

If that happens, a GameStop-style short squeeze could erupt. Although this remains unconfirmed, the rumors are intensifying.

It will be interesting to see what happens if MSTR begins approaching $250.

Here’s What Happens Next

The weekend bounce has brought much-needed relief to the crypto market.

The market is attempting to form a higher low for the first time since October.

Stocks are strengthening, Google is at record highs, and the S&P 500 is within striking distance of a new all-time high.

For now, this is the most straightforward answer to why crypto is going up:

  • technical exhaustion
  • macro strength
  • rapid shift in market narrative.
Disclaimer: The information provided in this article is for informational purposes only. It is not intended to be, nor should it be construed as, financial advice. We do not make any warranties regarding the completeness, reliability, or accuracy of this information. All investments involve risk, and past performance does not guarantee future results. We recommend consulting a financial advisor before making any investment decisions.
Valdrin Tahiri

Valdrin Tahiri is a cryptocurrency analyst and reporter at CCN, specializing in technical analysis with a focus on Elliott Wave theory, on-chain metrics, and fundamental research. He brings over seven years of experience in the crypto space as both a trader and writer.

He discovered cryptocurrencies in 2017 while earning his MSc in Financial Markets at the Barcelona School of Economics, which sparked a deep interest in blockchain and market dynamics. Since then, he’s contributed to top crypto outlets like BeInCrypto and CoinGape.

Valdrin also served as Community Manager of BeInCrypto’s Telegram group for three years, helping grow it into one of the largest crypto communities worldwide. His expertise in market structure and price patterns allows him to break down complex trends into clear, actionable insights.

He’s published thousands of articles covering altcoins, Bitcoin cycles, and macro trends.

Related

Survey Icon
Help us improve
1 of 4
Is this your first time here?
What brought you here today?
What are you most interested in?
Would you be interested in:
Thank you icon
Thank you for your feedback!
DMCA.com Protection Status