What's Behind This Weekend's Crypto Bounce? | Credit: Veronica Cestari
Share
Key Takeaways
The Total Crypto Market Cap (TOTALCAP) trades inside resistance.
Small-cap altcoins appear poised for a delayed bounce.
Will the crypto market bounce continue, or will November be bearish?
The cryptocurrency market bounced back over the weekend as U.S. President Donald Trump proposed a $2,000 stimulus check paid for by tariff revenue.
However, it is still unclear if the U.S. Supreme Court will rule against the Tariffs, and even if approved, there is no guarantee it will be a flat payment.
The previous stimulus was issued on March 27, 2020, and led to a massive crypto bull run, as evidenced by the increased deposits in Coinbase and Binance for the exact stimulus amount.
Another interesting development over the weekend is the intention of normalizing 50-year mortgages instead of 30-year ones.
While some are optimistic because lower monthly interest payments could free up extra cash to invest in cryptocurrencies, it’s clear that the total amount of interest paid over time will increase substantially.
The cryptocurrency market fell to start the week but has since regained its footing and is attempting to break out from a critical resistance level. Let’s examine the charts and determine what lies ahead.
Why is Crypto Going Up?
The TOTALCAP has fallen since its all-time high of $4.27 trillion in October. The decline was swift, causing a breakdown of the $2.60 trillion horizontal area.
This area is critical, since TOTALCAP had previously broken out above it on the way to the all-time high, and the area was expected to provide support.
However, that did not happen, as the crypto market fell to a low of $3.20 trillion three times before bouncing (green icons).
Get These Top Crypto Casino Offers Now!
Sponsored
Disclosure
We sometimes use affiliate links in our content, when clicking on those we might receive a commission at no extra cost to you. By using this website you agree to our terms and conditions and privacy policy.
The bounce validated the previous diagonal resistance trend line, which is the final level for a potential bounce before the crypto market breaks down.
As a result, there is still hope for a bullish trend reversal as long as this trend line remains intact and provides support.
For this to happen, the crypto market must continue to rise and close above the $3.60 trillion area, which did not happen on the first attempt (red icon).
However, while the price action does show bullish signs, technical indicators do not.
Total Crypto Market Cap | Credit: Valdrin Tahiri/TradingView
On the contrary, the Relative Strength Index (RSI) and Moving Average Convergence/Divergence (MACD) generated bearish divergence.
Not only did they generate divergences, but they broke down into bearish territory at 50 and 0, respectively.
Therefore, the crypto market price action still leans bearish despite the ongoing bounce. Only a reclaim of the $3.60 trillion level, combined with an RSI and MACD bounce, will invalidate this prediction.
Smaller Altcoins Surge
One chart that has positive price action and could lead to an eventual breakout is the small-cap altcoin chart.
These altcoins have fallen since they were rejected by the $325 trillion resistance area, which is close to the 0.618 Fibonacci retracement resistance level at $346 billion.
The resistance is a very likely area for the trend to reverse, especially if the upward movement is corrective.
Small-cap altcoins have been increasing within an ascending parallel channel since April, a sign that the rally is indeed corrective.
While this does not bode well for the long-term movement, the short-term outlook is much more promising.
Altcoin Market Cap | Credit: Valdrin Tahiri/TradingView
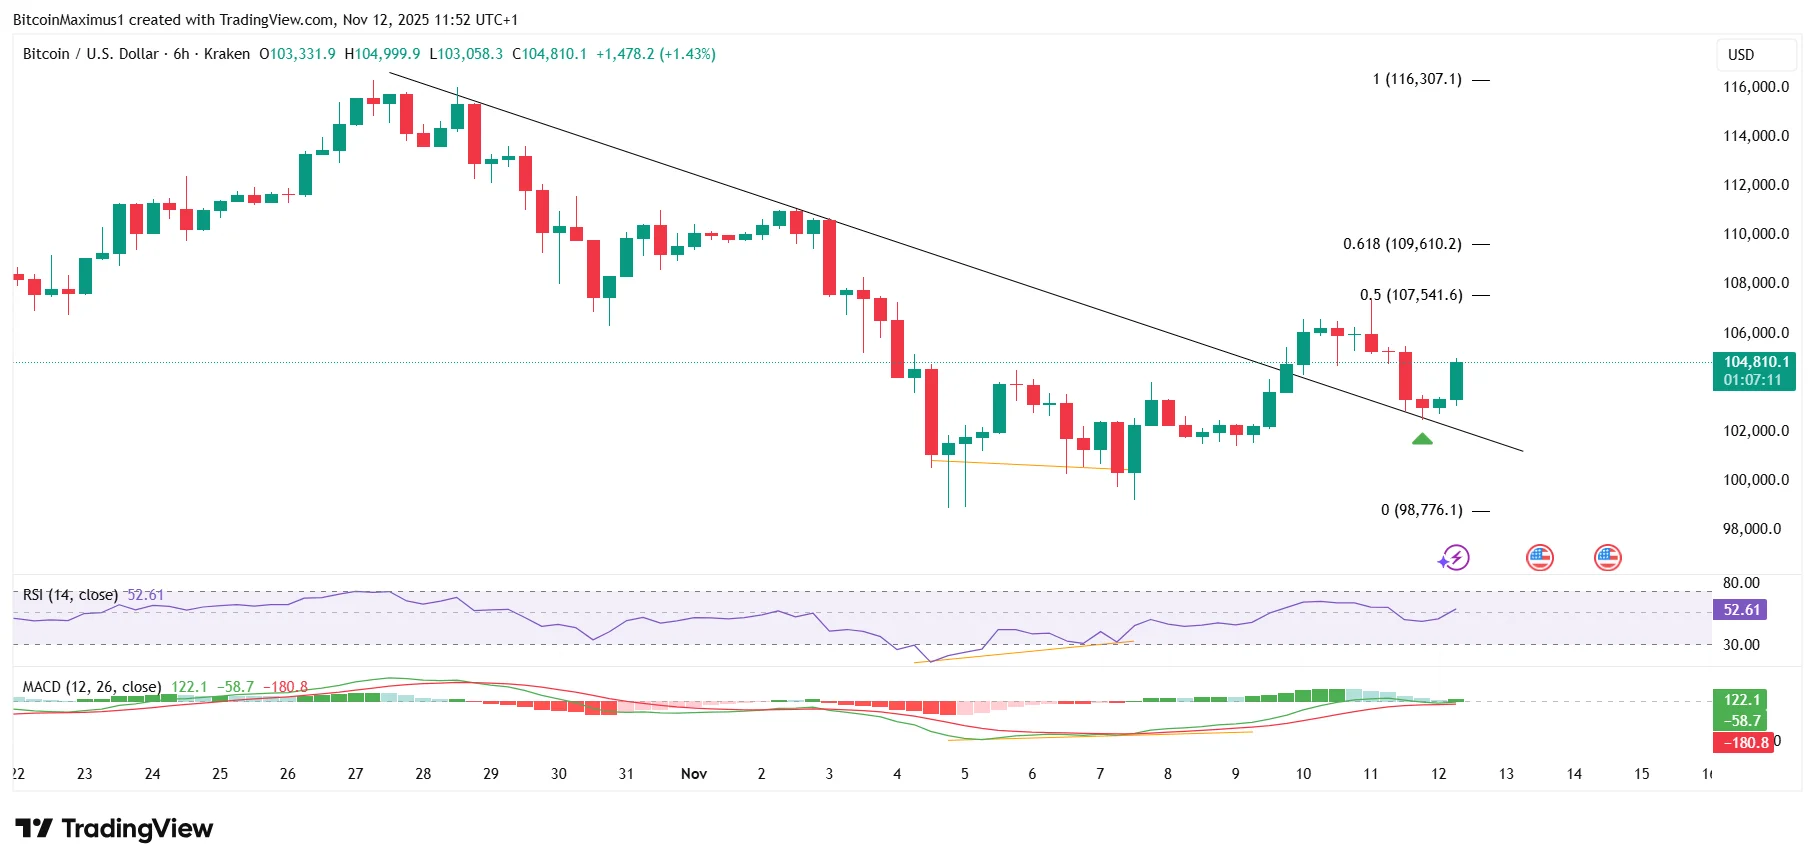
However, Bitcoin’s price bounced at the resistance trend line today and might have started another upward movement.
Nevertheless, like the crypto market and altcoin charts, the Bitcoin chart shows that the price has a long way to go to confirm that its trend is finally bullish.
The reaction to the $107,500-$109,600 area will be key to determining whether the rally marks a bullish trend reversal or if the BTC price will reverse and fall to new lows.
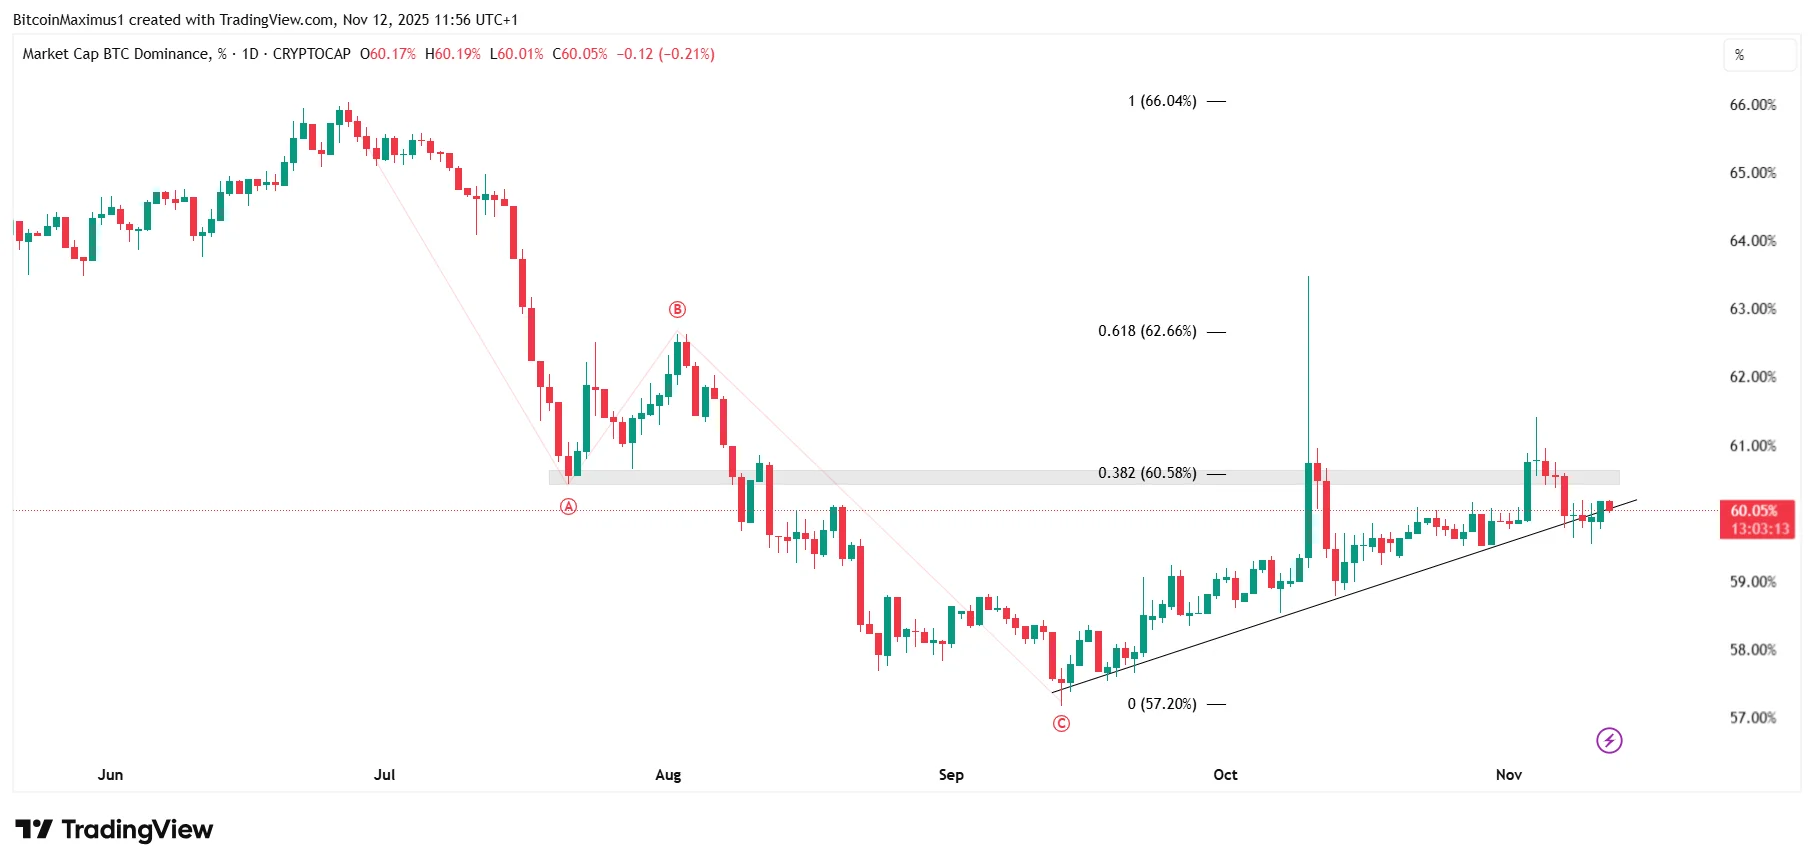
While the Bitcoin price increased, the BTC dominance fell, as several altcoins rose at a much faster pace than Bitcoin.
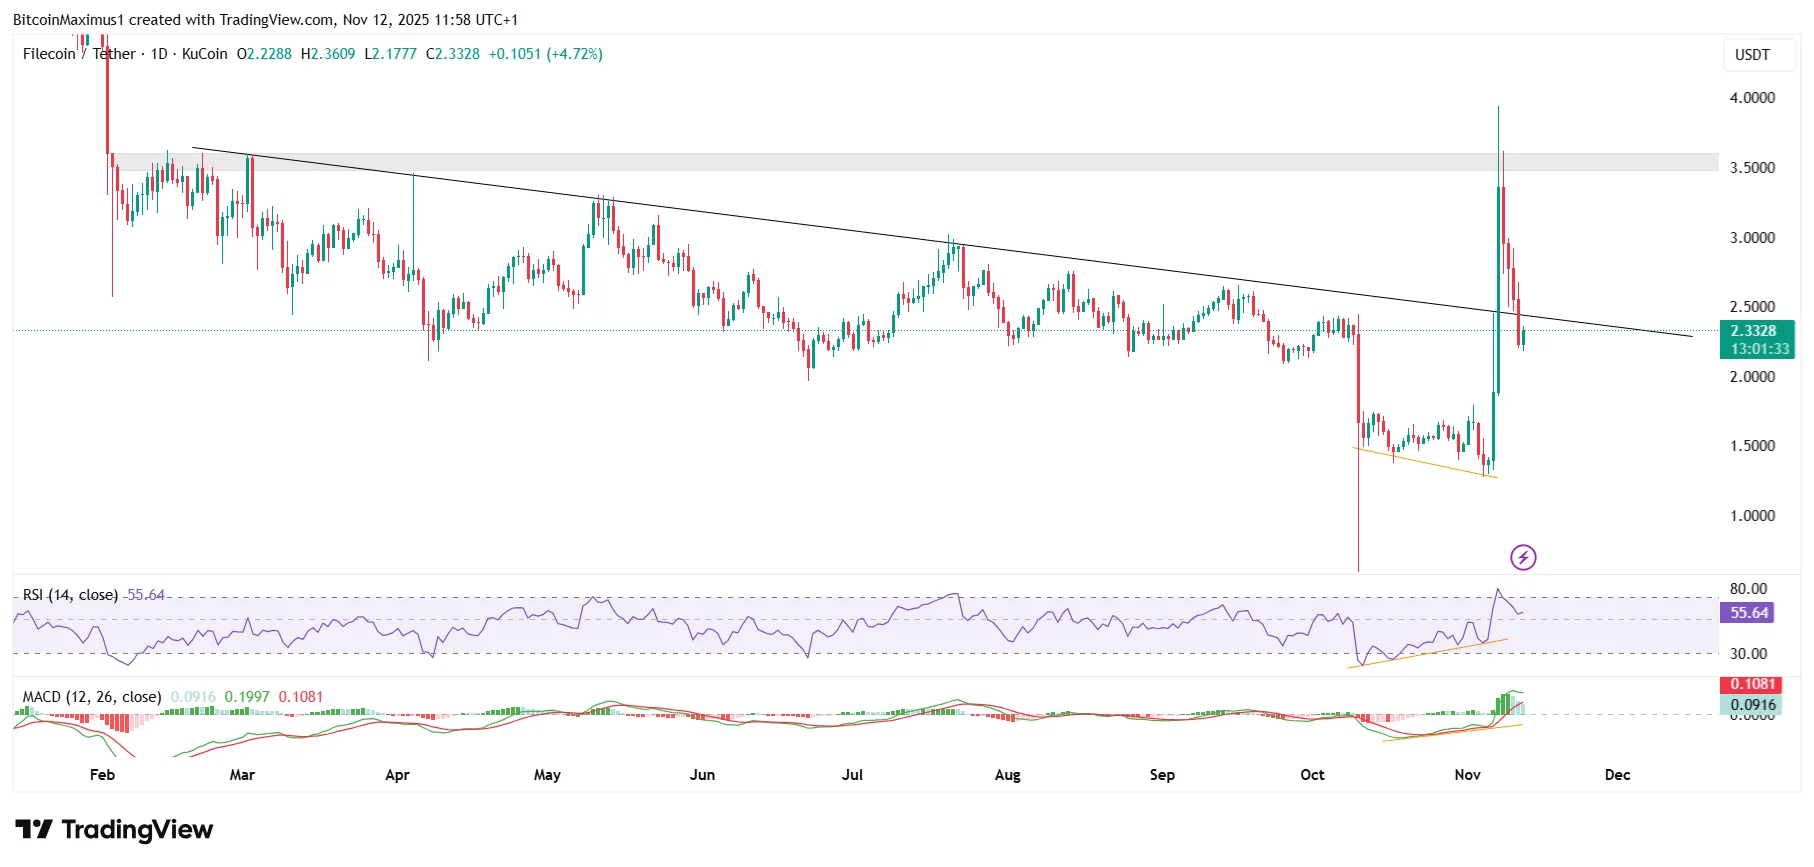
The next closest resistance is at $3.50, and the Filecoin price will confirm its bullish trend reversal if it clears it.
On the other side of the spectrum, the ZEC price increase has already extended, and a local top could be reached soon.
The Bounce Could be Short-Lived
The crypto market is showing early signs of recovery, but confirmation of a complete bullish reversal will depend on TOTALCAP reclaiming key resistance and indicators turning positive.
Bitcoin’s recent breakout adds momentum, though resistance levels could still trigger a reversal.
Meanwhile, small-cap altcoins are leading short-term gains, hinting at a more risk-on appetite.
For now, cautious optimism is warranted as the market navigates a critical resistance zone.
Disclaimer:
The information provided in this article is for informational purposes only. It is not intended to be, nor should it be construed as, financial advice. We do not make any warranties regarding the completeness, reliability, or accuracy of this information. All investments involve risk, and past performance does not guarantee future results. We recommend consulting a financial advisor before making any investment decisions.
Valdrin Tahiri is a cryptocurrency analyst and reporter at CCN, specializing in technical analysis with a focus on Elliott Wave theory, on-chain metrics, and fundamental research. He brings over seven years of experience in the crypto space as both a trader and writer.
He discovered cryptocurrencies in 2017 while earning his MSc in Financial Markets at the Barcelona School of Economics, which sparked a deep interest in blockchain and market dynamics. Since then, he’s contributed to top crypto outlets like BeInCrypto and CoinGape.
Valdrin also served as Community Manager of BeInCrypto’s Telegram group for three years, helping grow it into one of the largest crypto communities worldwide. His expertise in market structure and price patterns allows him to break down complex trends into clear, actionable insights.
He’s published thousands of articles covering altcoins, Bitcoin cycles, and macro trends.