Meet the Top 101 in Crypto

Merlin Chain’s (MERL) Price Suddenly Doubled Today — Here’s Why

Published 27 November 2025
Valdrin Tahiri
Authors
Edited by Insha Zia

Key Takeaways

  • Merlin Chain underwent an infrastructure upgrade to improve its scalability on Nov. 26.
  • The Merlin Chain (MERL) price pumped today but has crashed in the last few hours.
  • Is the Merlin Chain price increase just a pump and dump scheme, or will it continue this week?

Merlin Chain is suddenly back on traders’ radar after MERL doubled in price today, igniting the question: Why is Merlin Chain going up?

The spike follows a major network upgrade aimed at improving scalability and clearing long-standing performance bottlenecks.

Now, after MERL’s first breakout attempt failed earlier this month, traders are trying to figure out whether this rally has real momentum—or if another sharp reversal is waiting in the wings.

Why Is Merlin Chain Going Up?

Merlin Chain has been steadily climbing since its lows in June.

Its rally accelerated once the price broke out from a diagonal resistance trend line in September.

The breakout was significant since it confirmed that the previous correction had ended.

Get These Top Crypto Casino Offers Now!
Sponsored
Disclosure
Opened in 2023
Promotions
200% deposit bonus up to 20,000 USDT + up to 100 FS (promo code: CG100)
Coins
Tether Bitcoin Ethereum USD Coin TRON +7
Opened in 2021
Promotions
Casino No Wagering 100 Free Spins
Coins
Bitcoin Tether USD Coin Ethereum Solana +11
Opened in 2018
Promotions
500% Welcome Bonus up to $90,000 + 100 Free Spins
Coins
Bitcoin Ethereum Litecoin Tether Dogecoin +3
Show More

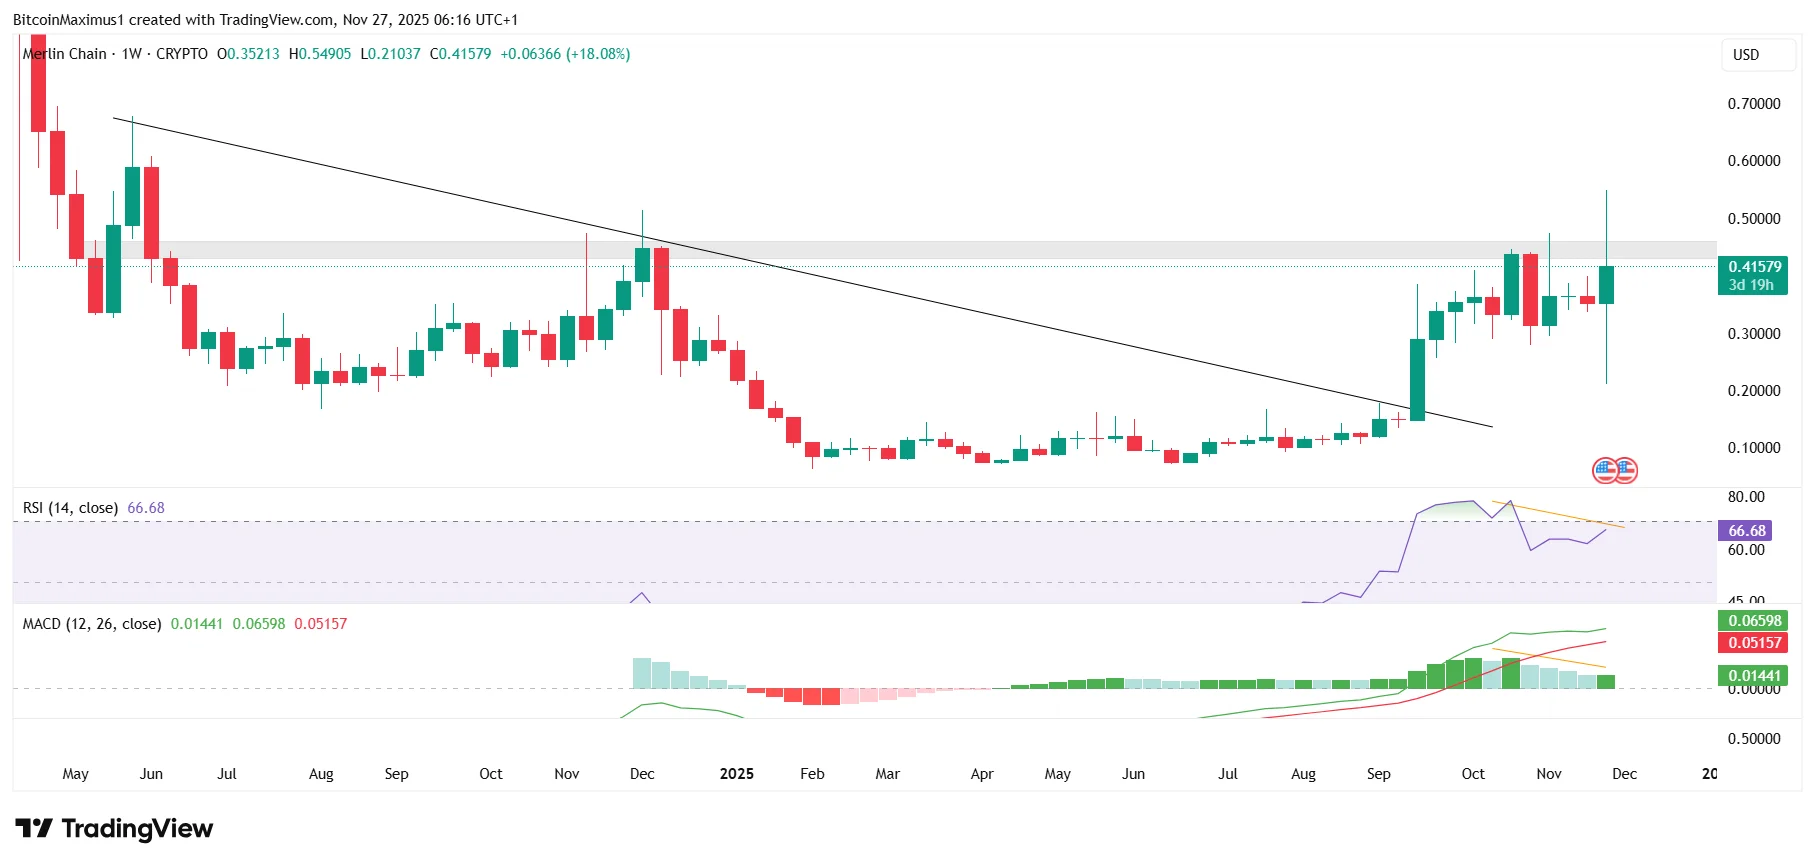
Shortly after the breakout, MERL struggled with the $0.45 horizontal resistance area.

This all changed today, as the Merlin Chain price surged once more, finally moving above the resistance.

However, things aren’t perfect just yet.

MERL Weekly
MERL/USDT Weekly Chart | Credit: Valdrin Tahiri/TradingView

The resistance is evident in the weekly time frame, and MERL has not yet closed above the $0.45 area.

Until it does, the possibility remains that the rally will be just a failed breakout attempt.

Is Weakness Brewing Underneath?

Things get messier when looking at momentum indicators. 

The Relative Strength Index (RSI) and Moving Average Convergence/Divergence (MACD) have created bearish divergences.

These divergences are a sign of weakness, indicating that they reduce the likelihood of a breakout.

MERL Weekly
MERL/USDT Weekly Chart | Credit: Valdrin Tahiri/TradingView

Outside of the MERL price action, some users are concerned about concentrated supply.

More specifically, a single wallet holds nearly 50% of the total supply, meaning that a sell-off could cause the price to drop significantly.

Short-Term Breakdown

Merlin Chain’s hourly chart is starting to tilt bearish.

This is because the price broke down from an ascending support trend line that had been in place since the rally accelerated.

The breakdown triggered a MERL price crash that is still ongoing.

MERL Crash
MERL/USDT Hourly Chart | Credit: Valdrin Tahiri/TradingView

It is possible that the crash occurred as a result of the large wallet sale.

Hence, traders should exercise caution when interacting with Merlin Chain, as coordinated selling could lead to a sharp price crash.

Where Merlin Chain Goes Next

Despite the hype surrounding the upgrade and breakout, Merlin Chain trades at a precarious position.

A weekly close above $0.45 would validate the bullish structure and open the door for higher targets.

But weakening momentum, a short-term breakdown, and a concentrated supply pool raise the risk of a sudden reversal.

Disclaimer: The information provided in this article is for informational purposes only. It is not intended to be, nor should it be construed as, financial advice. We do not make any warranties regarding the completeness, reliability, or accuracy of this information. All investments involve risk, and past performance does not guarantee future results. We recommend consulting a financial advisor before making any investment decisions.
Valdrin Tahiri

Valdrin Tahiri is a cryptocurrency analyst and reporter at CCN, specializing in technical analysis with a focus on Elliott Wave theory, on-chain metrics, and fundamental research. He brings over seven years of experience in the crypto space as both a trader and writer.

He discovered cryptocurrencies in 2017 while earning his MSc in Financial Markets at the Barcelona School of Economics, which sparked a deep interest in blockchain and market dynamics. Since then, he’s contributed to top crypto outlets like BeInCrypto and CoinGape.

Valdrin also served as Community Manager of BeInCrypto’s Telegram group for three years, helping grow it into one of the largest crypto communities worldwide. His expertise in market structure and price patterns allows him to break down complex trends into clear, actionable insights.

He’s published thousands of articles covering altcoins, Bitcoin cycles, and macro trends.

Related

Survey Icon
Help us improve
1 of 4
Is this your first time here?
What brought you here today?
What are you most interested in?
Would you be interested in:
Thank you icon
Thank you for your feedback!
DMCA.com Protection Status