Will Litecoin Break Down Below $100? | Credit: Hameem Sarwar
Share
Key Takeaways
Litecoin (LTC) trades inside an ascending parallel channel.
Litecoin’s price decreased by 25% in the last two weeks.
Will Litecoin continue to fall until it breaks down from the channel?
Litecoin is entering dangerous territory.
After a sharp 25% decline in just two weeks, the risk of a Litecoin price breakdown is now the highest it has been all year.
At the start of the month, LTC showed strength by trading in the upper portion of its long-term channel.
But the recent collapse wiped out those gains, and now the price is clinging to support as bulls attempt a final defense.
Let’s analyze the charts to see whether they can hold the line.
Litecoin’s Price Risks Breakdown
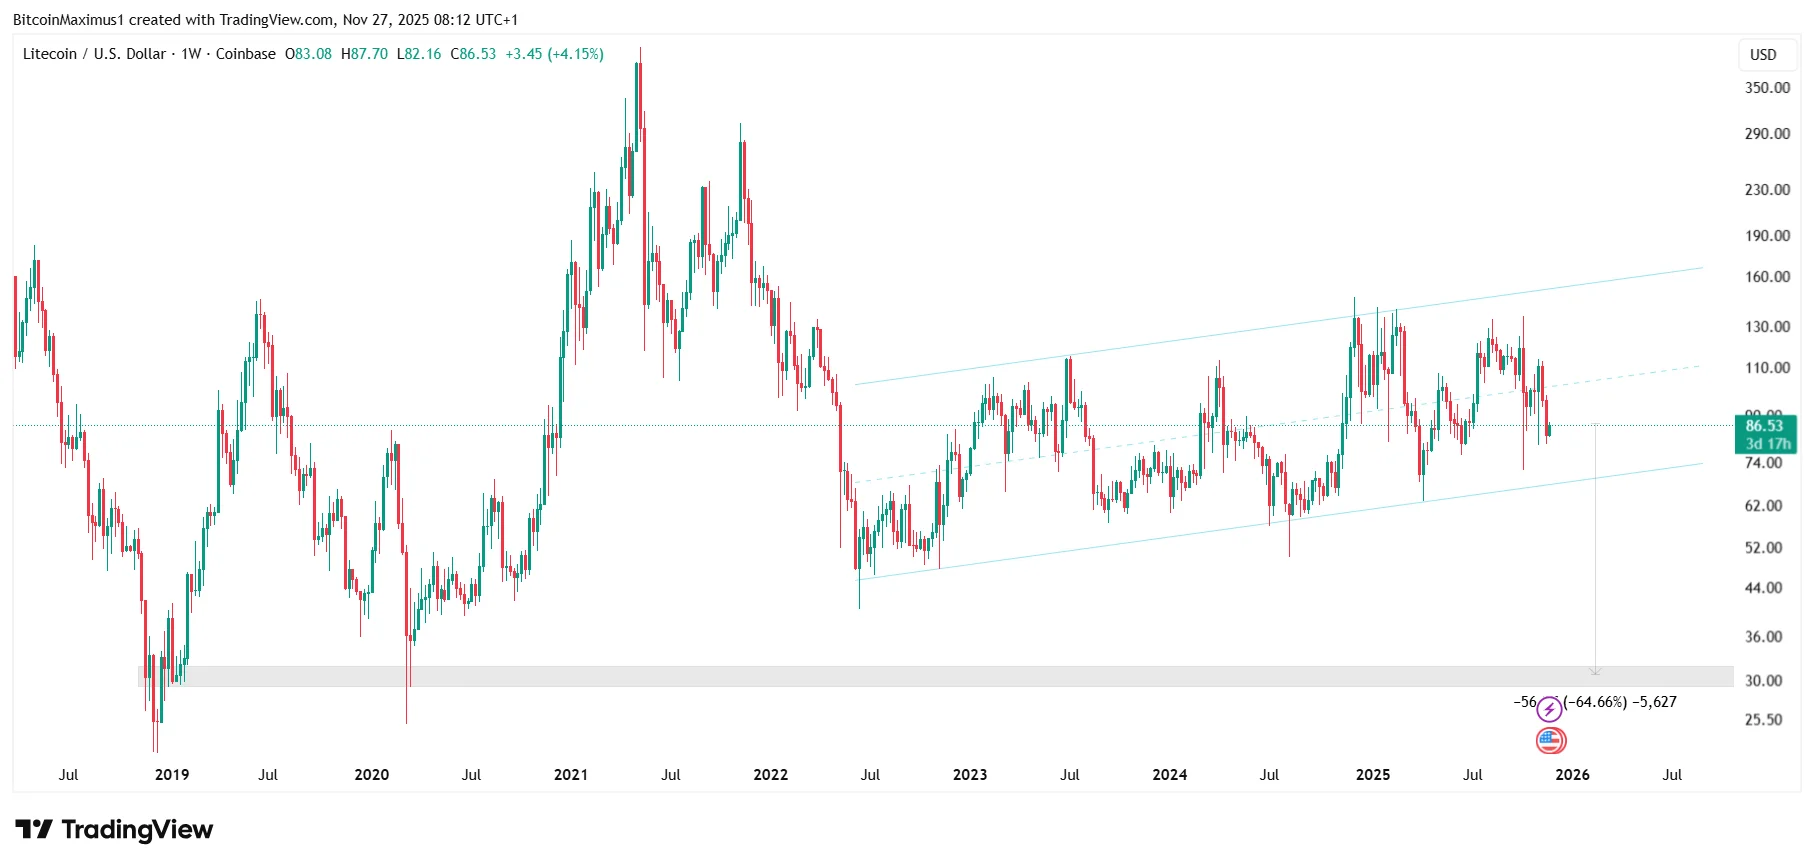
Litecoin’s price has been rising inside an ascending parallel channel since June.
However, the choppy movement within the channel suggests the upward trend may be corrective rather than the start of a true reversal.
Get These Top Crypto Casino Offers Now!
Sponsored
Disclosure
We sometimes use affiliate links in our content, when clicking on those we might receive a commission at no extra cost to you. By using this website you agree to our terms and conditions and privacy policy.
Because of this, traders are closely watching the channel’s support trend line to see if it will give way and trigger a breakdown to $30, a 65% plunge from the current price.
Bearish Momentum Builds
This is where the outlook becomes even more concerning.
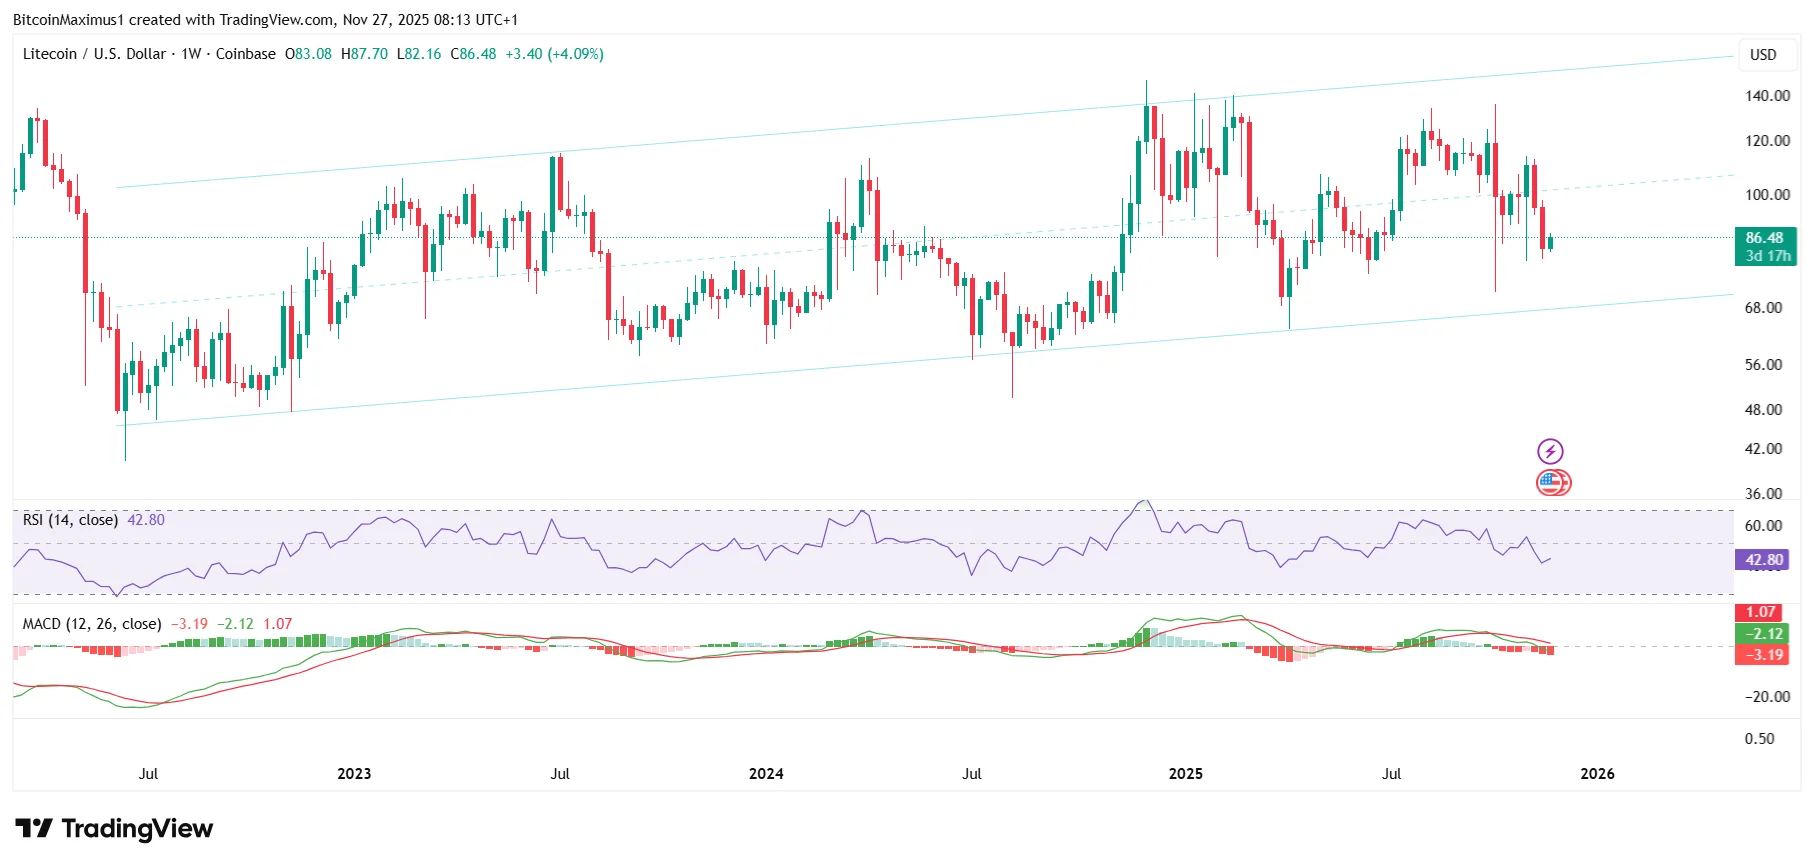
Momentum indicators show that bears are entirely in control, and a price breakdown is inevitable.
The Relative Strength Index (RSI) is firmly below 50, a decisive sign of a bearish trend.
After making a bearish cross (black circle), the MACD broke down from its support trend line.
The indicator’s breakdown often precedes the prices, so Litecoin is likely next.
Once it breaks down from the confines of the short-term channel, Litecoin could fall to the long-term one at $75.
Litecoin Breakdown Now Looks Unavoidable
Litecoin sits in a very fragile position today.
Momentum has flipped decisively bearish, both timeframes show identical weakening structures, and price continues to grind along the bottom of the channel.
The MACD’s collapse below support and the RSI firmly under 50 only add to the urgency.
If LTC loses the final trend line, the next stop becomes the long-term support near $75, with the broader structure even allowing for a deeper slide toward $30.
Unless Litecoin’s price reclaims the middle of the channel soon, the charts suggest that the breakdown is inevitable.
Disclaimer:
The information provided in this article is for informational purposes only. It is not intended to be, nor should it be construed as, financial advice. We do not make any warranties regarding the completeness, reliability, or accuracy of this information. All investments involve risk, and past performance does not guarantee future results. We recommend consulting a financial advisor before making any investment decisions.
Valdrin Tahiri is a cryptocurrency analyst and reporter at CCN, specializing in technical analysis with a focus on Elliott Wave theory, on-chain metrics, and fundamental research. He brings over seven years of experience in the crypto space as both a trader and writer.
He discovered cryptocurrencies in 2017 while earning his MSc in Financial Markets at the Barcelona School of Economics, which sparked a deep interest in blockchain and market dynamics. Since then, he’s contributed to top crypto outlets like BeInCrypto and CoinGape.
Valdrin also served as Community Manager of BeInCrypto’s Telegram group for three years, helping grow it into one of the largest crypto communities worldwide. His expertise in market structure and price patterns allows him to break down complex trends into clear, actionable insights.
He’s published thousands of articles covering altcoins, Bitcoin cycles, and macro trends.