How Much Longer Will Google's Price Increase Continue? | Credit: Gemini
Share
Key Takeaways
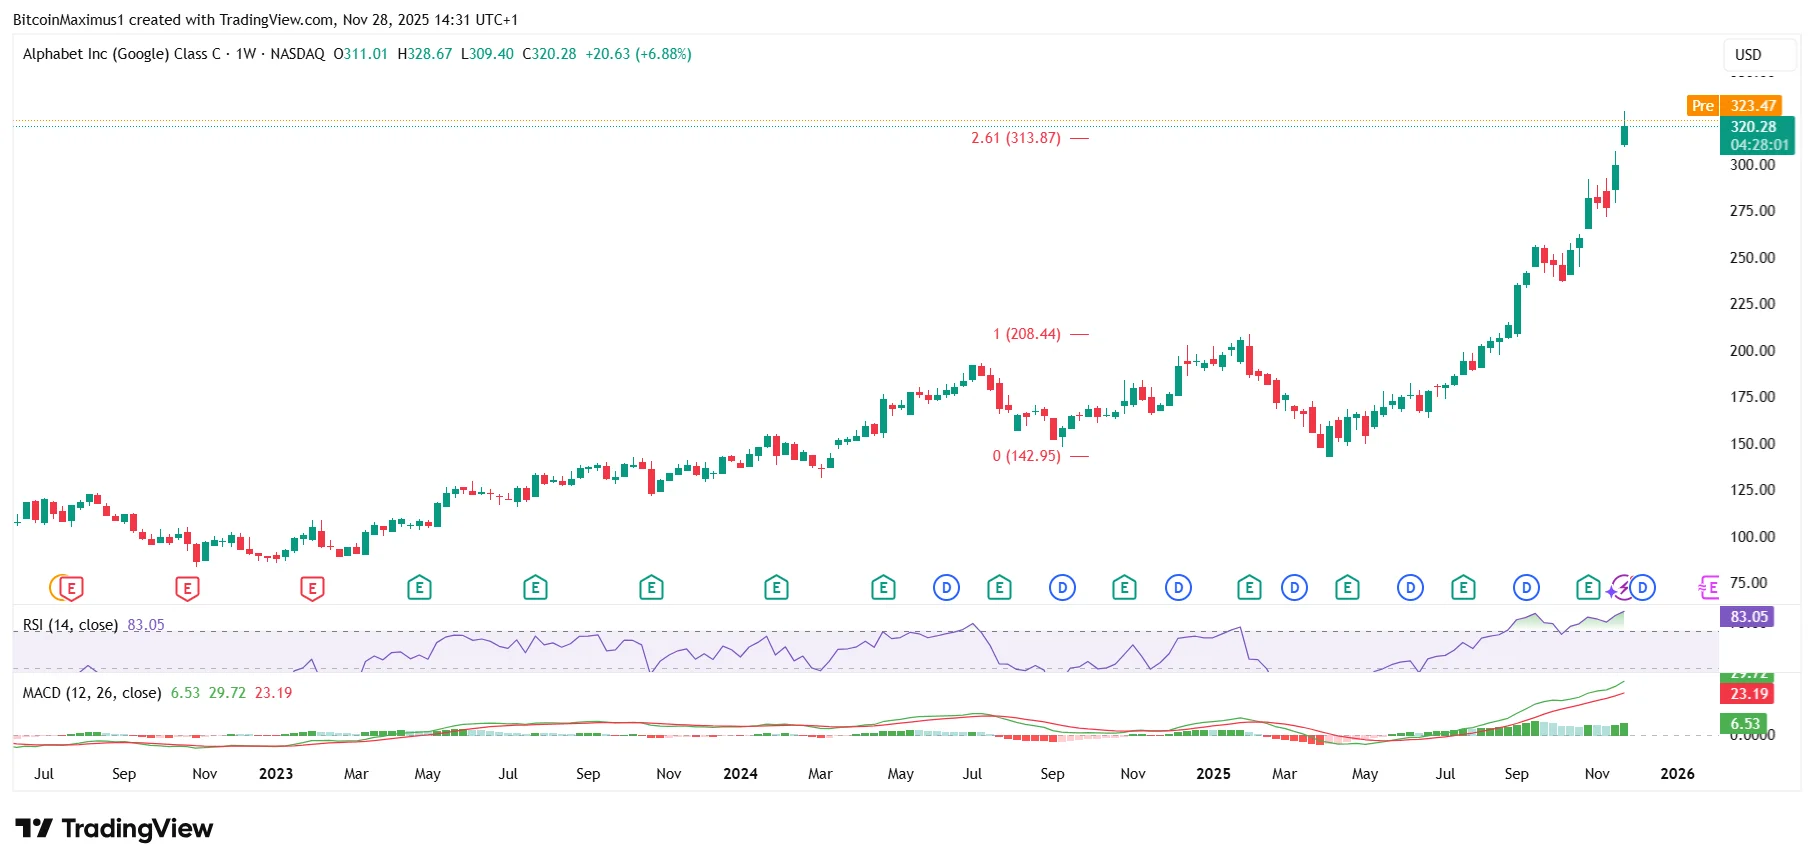
Alphabet Inc’s (Google) stock hit a new all-time high price yesterday
The Google stock price has surged by more than 120% since April.
Can Google sustain its increase and end the year on a bullish note?
The Google stock price hit a new all-time high yesterday, rising more than 120 percent since April and outperforming other assets.
The rally accelerated after Warren Buffett’s Berkshire Hathaway disclosed a $4 billion stake, and now even Nvidia is publicly praising Google’s momentum.
With Google breaking records and Big Tech watching closely, traders want to know whether this surge can continue or if a significant reversal is brewing beneath the surface.
Google Hits All-Time High Price
The Google price has surged since April, hitting a new all-time high price yesterday.
Its explosion since the April lows (green icon) amounts to a massive 120% rally, outperforming nearly every other asset.
Get These Top Crypto Casino Offers Now!
Sponsored
Disclosure
We sometimes use affiliate links in our content, when clicking on those we might receive a commission at no extra cost to you. By using this website you agree to our terms and conditions and privacy policy.
Instead, some are suggesting that the phrase “NVIDIA is a generation ahead of the industry” is a subtle dig at Google’s Artificial Intelligence (AI) capabilities.
The Nvidia team also said that it offers “greater performance, versatility, and fungibility than ASICs”, adding even more fuel to the fire.
The post also comes at an interesting time, since the NVDA stock price has fallen by 15% since its all-time high.
Meanwhile, Google continues to rise and is poised to surge even higher.
Where Google’s Record-Breaking Rally Goes From Here
The Google stock price continues to defy expectations, surging past resistance levels with considerable momentum.
Technical indicators show no real weakness yet, and the breakout above all-time highs supports the argument for a push toward the $380 zone.
Its strength in the face of a global futures trading halt is awe-inspiring.
However, Google is also sitting directly on a significant Fibonacci extension, a level where many rallies historically cool off.
With Nvidia’s comments stirring speculation and the tech sector becoming increasingly competitive, traders are watching closely to see whether Google’s rise accelerates or finally pauses.
Disclaimer:
The information provided in this article is for informational purposes only. It is not intended to be, nor should it be construed as, financial advice. We do not make any warranties regarding the completeness, reliability, or accuracy of this information. All investments involve risk, and past performance does not guarantee future results. We recommend consulting a financial advisor before making any investment decisions.
Valdrin Tahiri is a cryptocurrency analyst and reporter at CCN, specializing in technical analysis with a focus on Elliott Wave theory, on-chain metrics, and fundamental research. He brings over seven years of experience in the crypto space as both a trader and writer.
He discovered cryptocurrencies in 2017 while earning his MSc in Financial Markets at the Barcelona School of Economics, which sparked a deep interest in blockchain and market dynamics. Since then, he’s contributed to top crypto outlets like BeInCrypto and CoinGape.
Valdrin also served as Community Manager of BeInCrypto’s Telegram group for three years, helping grow it into one of the largest crypto communities worldwide. His expertise in market structure and price patterns allows him to break down complex trends into clear, actionable insights.
He’s published thousands of articles covering altcoins, Bitcoin cycles, and macro trends.