What Caused Yesterday's Stock Market Crash? | Credit: Derek Fenech
Share
Key Takeaways
The 30-year Japanese Bond yield has hit a multi-decade high.
The S&P 500, NASDAQ, and Nvidia (NVDA) all experienced significant declines yesterday.
What was the reason behind the U.S. stock market crash?
Markets were on edge yesterday as bearish signals emerged simultaneously across bonds, stocks, and the AI sector.
Japan’s 30-year bond yield spiked to multi-decade highs, raising global concerns about debt, inflation, and the unwind of the yen carry trade.
The U.S. stock market did not fare any better, with the S&P 500 and NASDAQ suffering their sharpest single-day declines in months.
Even market darling Nvidia finally buckled, hinting that the AI boom may be hitting a critical turning point.
Keeping that in mind, let’s examine a few charts and figure out what lies ahead.
Japanese Bond Implosion
Since the news emerged that Japan is considering launching a $110 billion stimulus, the 30-year government bond yield has surged to a new high of 3.77%.
This massive increase in Bond Yields could be a warning sign to the U.S. government if they do not resolve its deficit spending crisis.
The increased yield in Japanese bonds is not a new phenomenon. For years, the Bank of Japan (BOJ) kept rates near zero, allowing global players to borrow cheap yen and deploy it somewhere else.
This was known as the Yen Carry Trade, and was one of the strongest liquidity vehicles for financial markets.
However, Japan faces rising inflation, a weakening yen, and a new fiscal stimulus, which is turning the trade in its favor.
Inflation is stuck near three percent while defense spending rises, leaving the Bank of Japan trapped between raising rates and risking a debt crisis, or keeping them low and allowing inflation to erode savings.
The BOJ has stated that it may intervene if the USD/JPY pair reaches 160, meaning we are less than 2% away from this potential intervention.
U.S. Stock Market Crashes
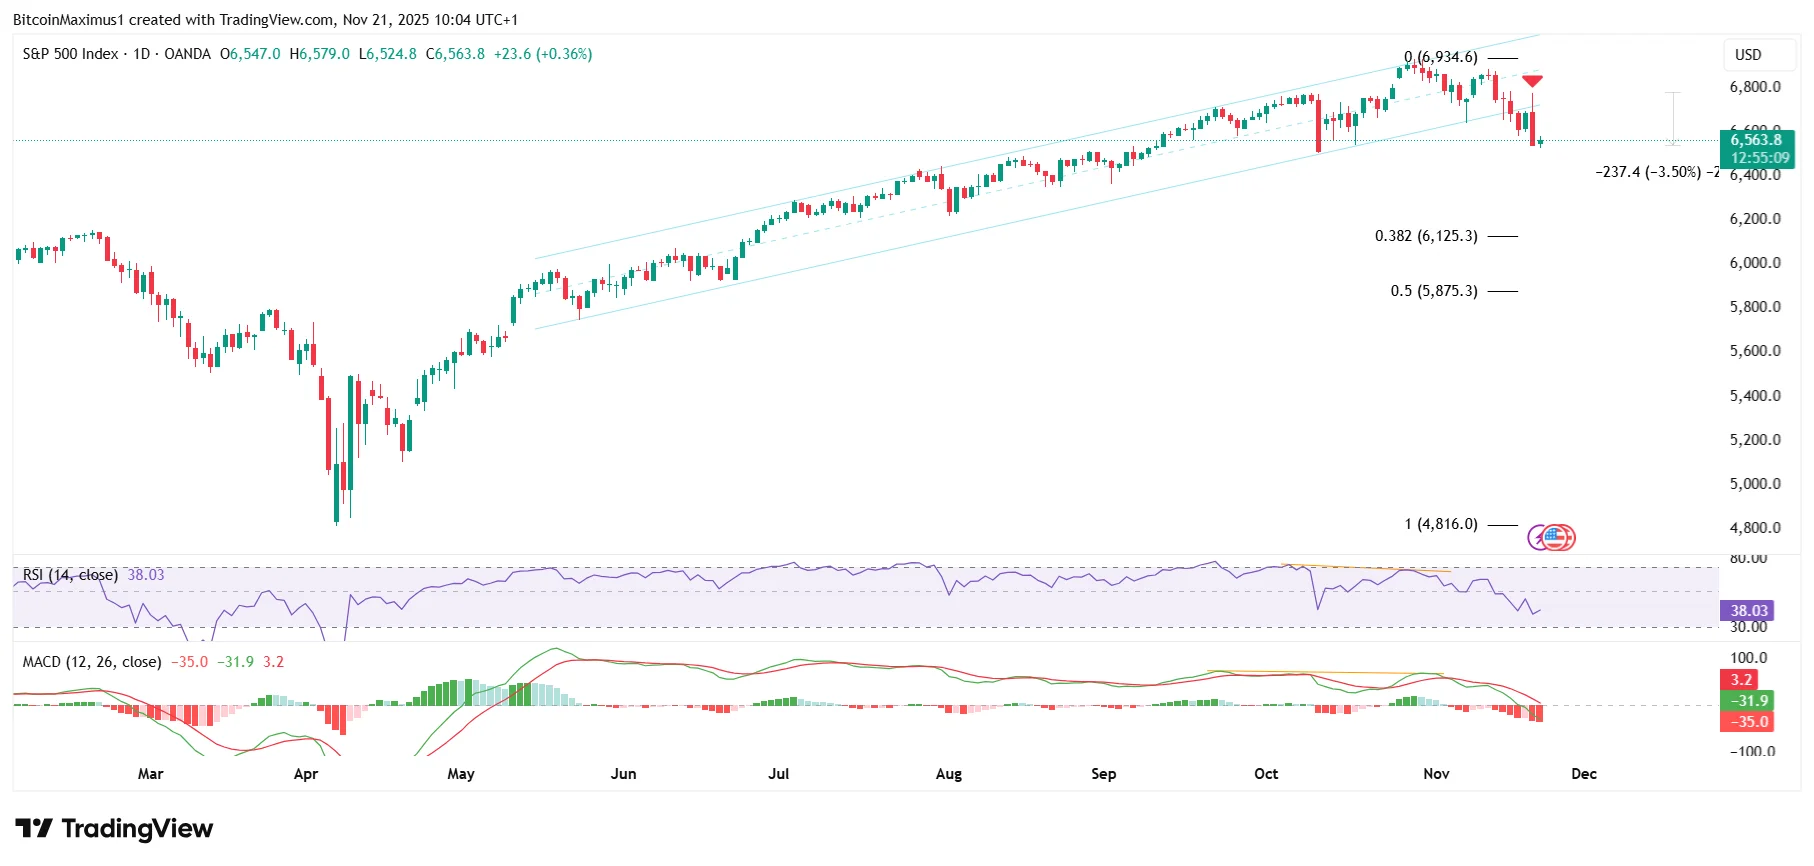
The S&P 500 crashed yesterday, falling 3.5% since its daily high, marking the most significant single-day decline since Oct. 10. The NASDAQ posted a similar but slightly larger drop.
Besides the severity of the decline, the breakdown was critical because it confirmed the previous ascending parallel channel as resistance (red icon).
Get These Top Crypto Casino Offers Now!
Sponsored
Disclosure
We sometimes use affiliate links in our content, when clicking on those we might receive a commission at no extra cost to you. By using this website you agree to our terms and conditions and privacy policy.
The channel had existed since June, and the breakdown below it confirms that the upward movement is over and a new downward one has started.
The Relative Strength Index (RSI) and Moving Average Convergence/Divergence (MACD) confirm this. Both indicators created bearish divergences (orange) before the drop and are now in bearish territory.
Well-known analyst Shanaka Anslem Perera stated that the AI bubble has begun to unwind, as a circular funding loop between major AI firms inflates revenue without actual payment.
Nvidia gave $2 billion to xAI. xAI borrowed $12.5 billion to buy Nvidia chips. Microsoft gave OpenAI $13 billion. OpenAI committed $50 billion to buy Microsoft cloud. Microsoft ordered $100 billion in Nvidia chips for that cloud. Oracle gave OpenAI $300 billion in cloud credits. OpenAI ordered Nvidia chips for Oracle data centers. The same dollars circle through different companies and get counted as revenue multiple times. Nvidia books sales, but nobody actually pays. The bills age. The inventory piles up. The cash never comes.
Nvidia’s chart is also concerning, as the price action indicates a completed five-wave upward movement since April. The increase concluded with an ending diagonal, which often marks the top of such rallies.
The surge in the 30-year Japanese bond yields has put a strain on global liquidity.
While it is uncertain whether they are the primary cause of yesterday’s stock market crash, the surge in Japanese bond yields, combined with a weakening yen, is a cause for concern.
Additionally, Nvidia’s price returned all of the previous gains resulting from the positive earnings report.
As a result, the AI bubble voices have resurfaced again and could become louder if the decline continues.
Disclaimer:
The information provided in this article is for informational purposes only. It is not intended to be, nor should it be construed as, financial advice. We do not make any warranties regarding the completeness, reliability, or accuracy of this information. All investments involve risk, and past performance does not guarantee future results. We recommend consulting a financial advisor before making any investment decisions.
Valdrin Tahiri is a cryptocurrency analyst and reporter at CCN, specializing in technical analysis with a focus on Elliott Wave theory, on-chain metrics, and fundamental research. He brings over seven years of experience in the crypto space as both a trader and writer.
He discovered cryptocurrencies in 2017 while earning his MSc in Financial Markets at the Barcelona School of Economics, which sparked a deep interest in blockchain and market dynamics. Since then, he’s contributed to top crypto outlets like BeInCrypto and CoinGape.
Valdrin also served as Community Manager of BeInCrypto’s Telegram group for three years, helping grow it into one of the largest crypto communities worldwide. His expertise in market structure and price patterns allows him to break down complex trends into clear, actionable insights.
He’s published thousands of articles covering altcoins, Bitcoin cycles, and macro trends.