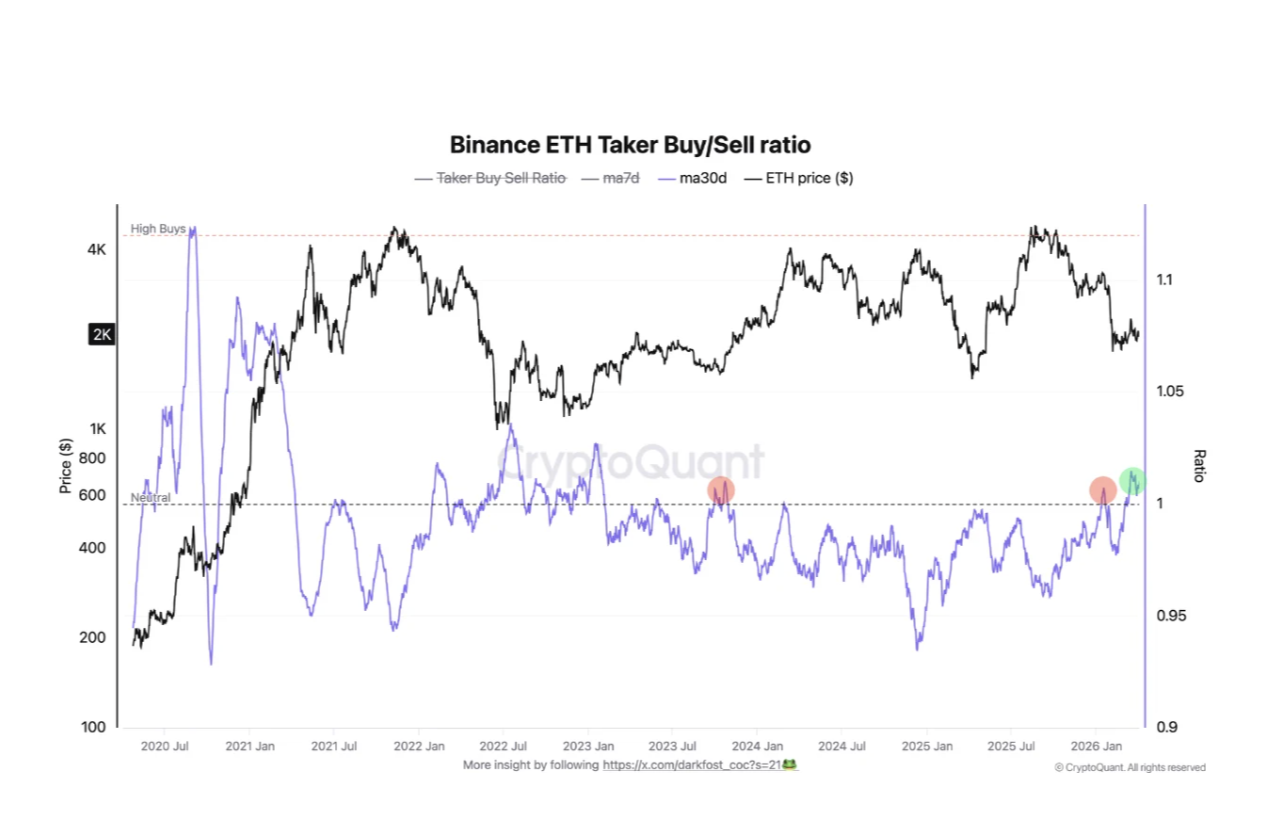
Ethereum’s Taker Buy/Sell Ratio on Binance has held above 1.0 for several consecutive days, a setup last seen in 2023, suggesting a sustained return of buyer dominance in derivatives markets.
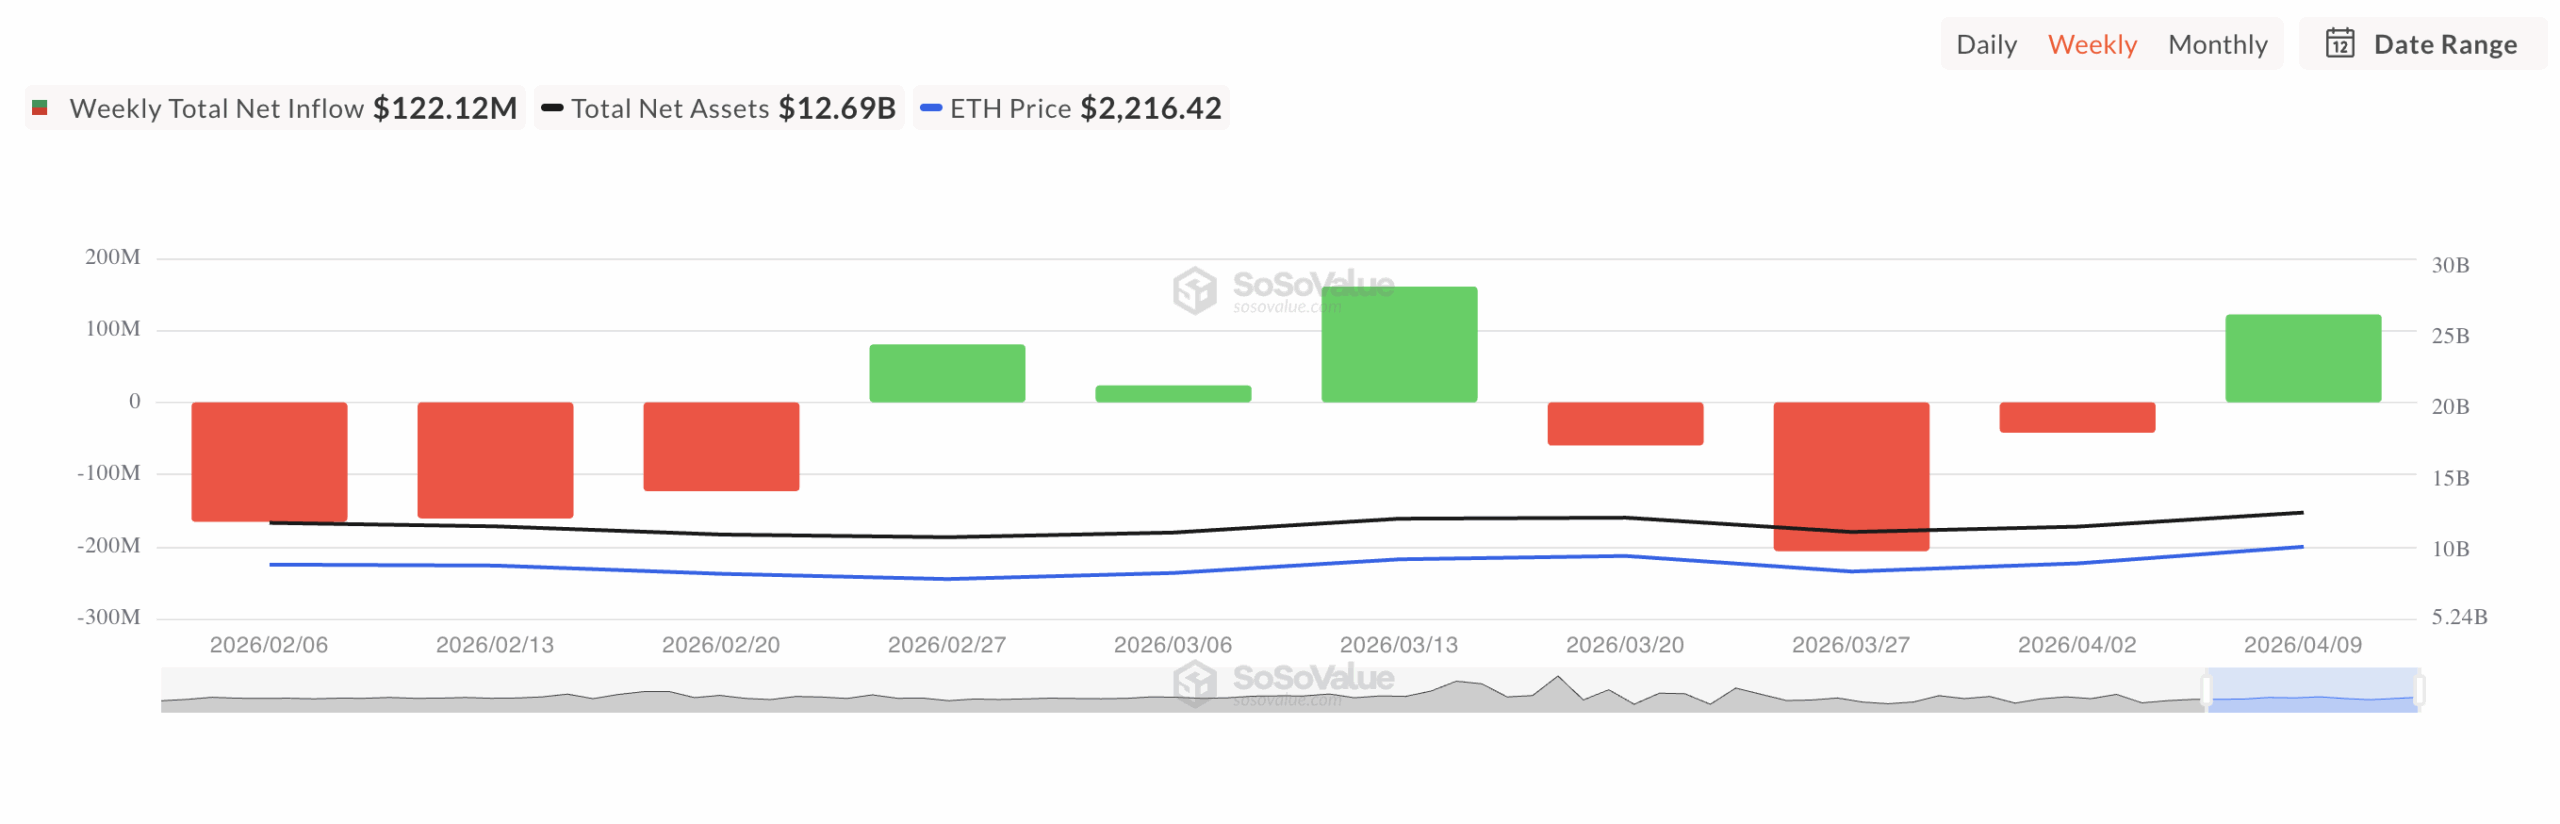
Spot Ethereum ETFs recorded $122.12 million in net inflows this week, putting them on course to snap three straight weeks of outflows as institutional sentiment shifts.
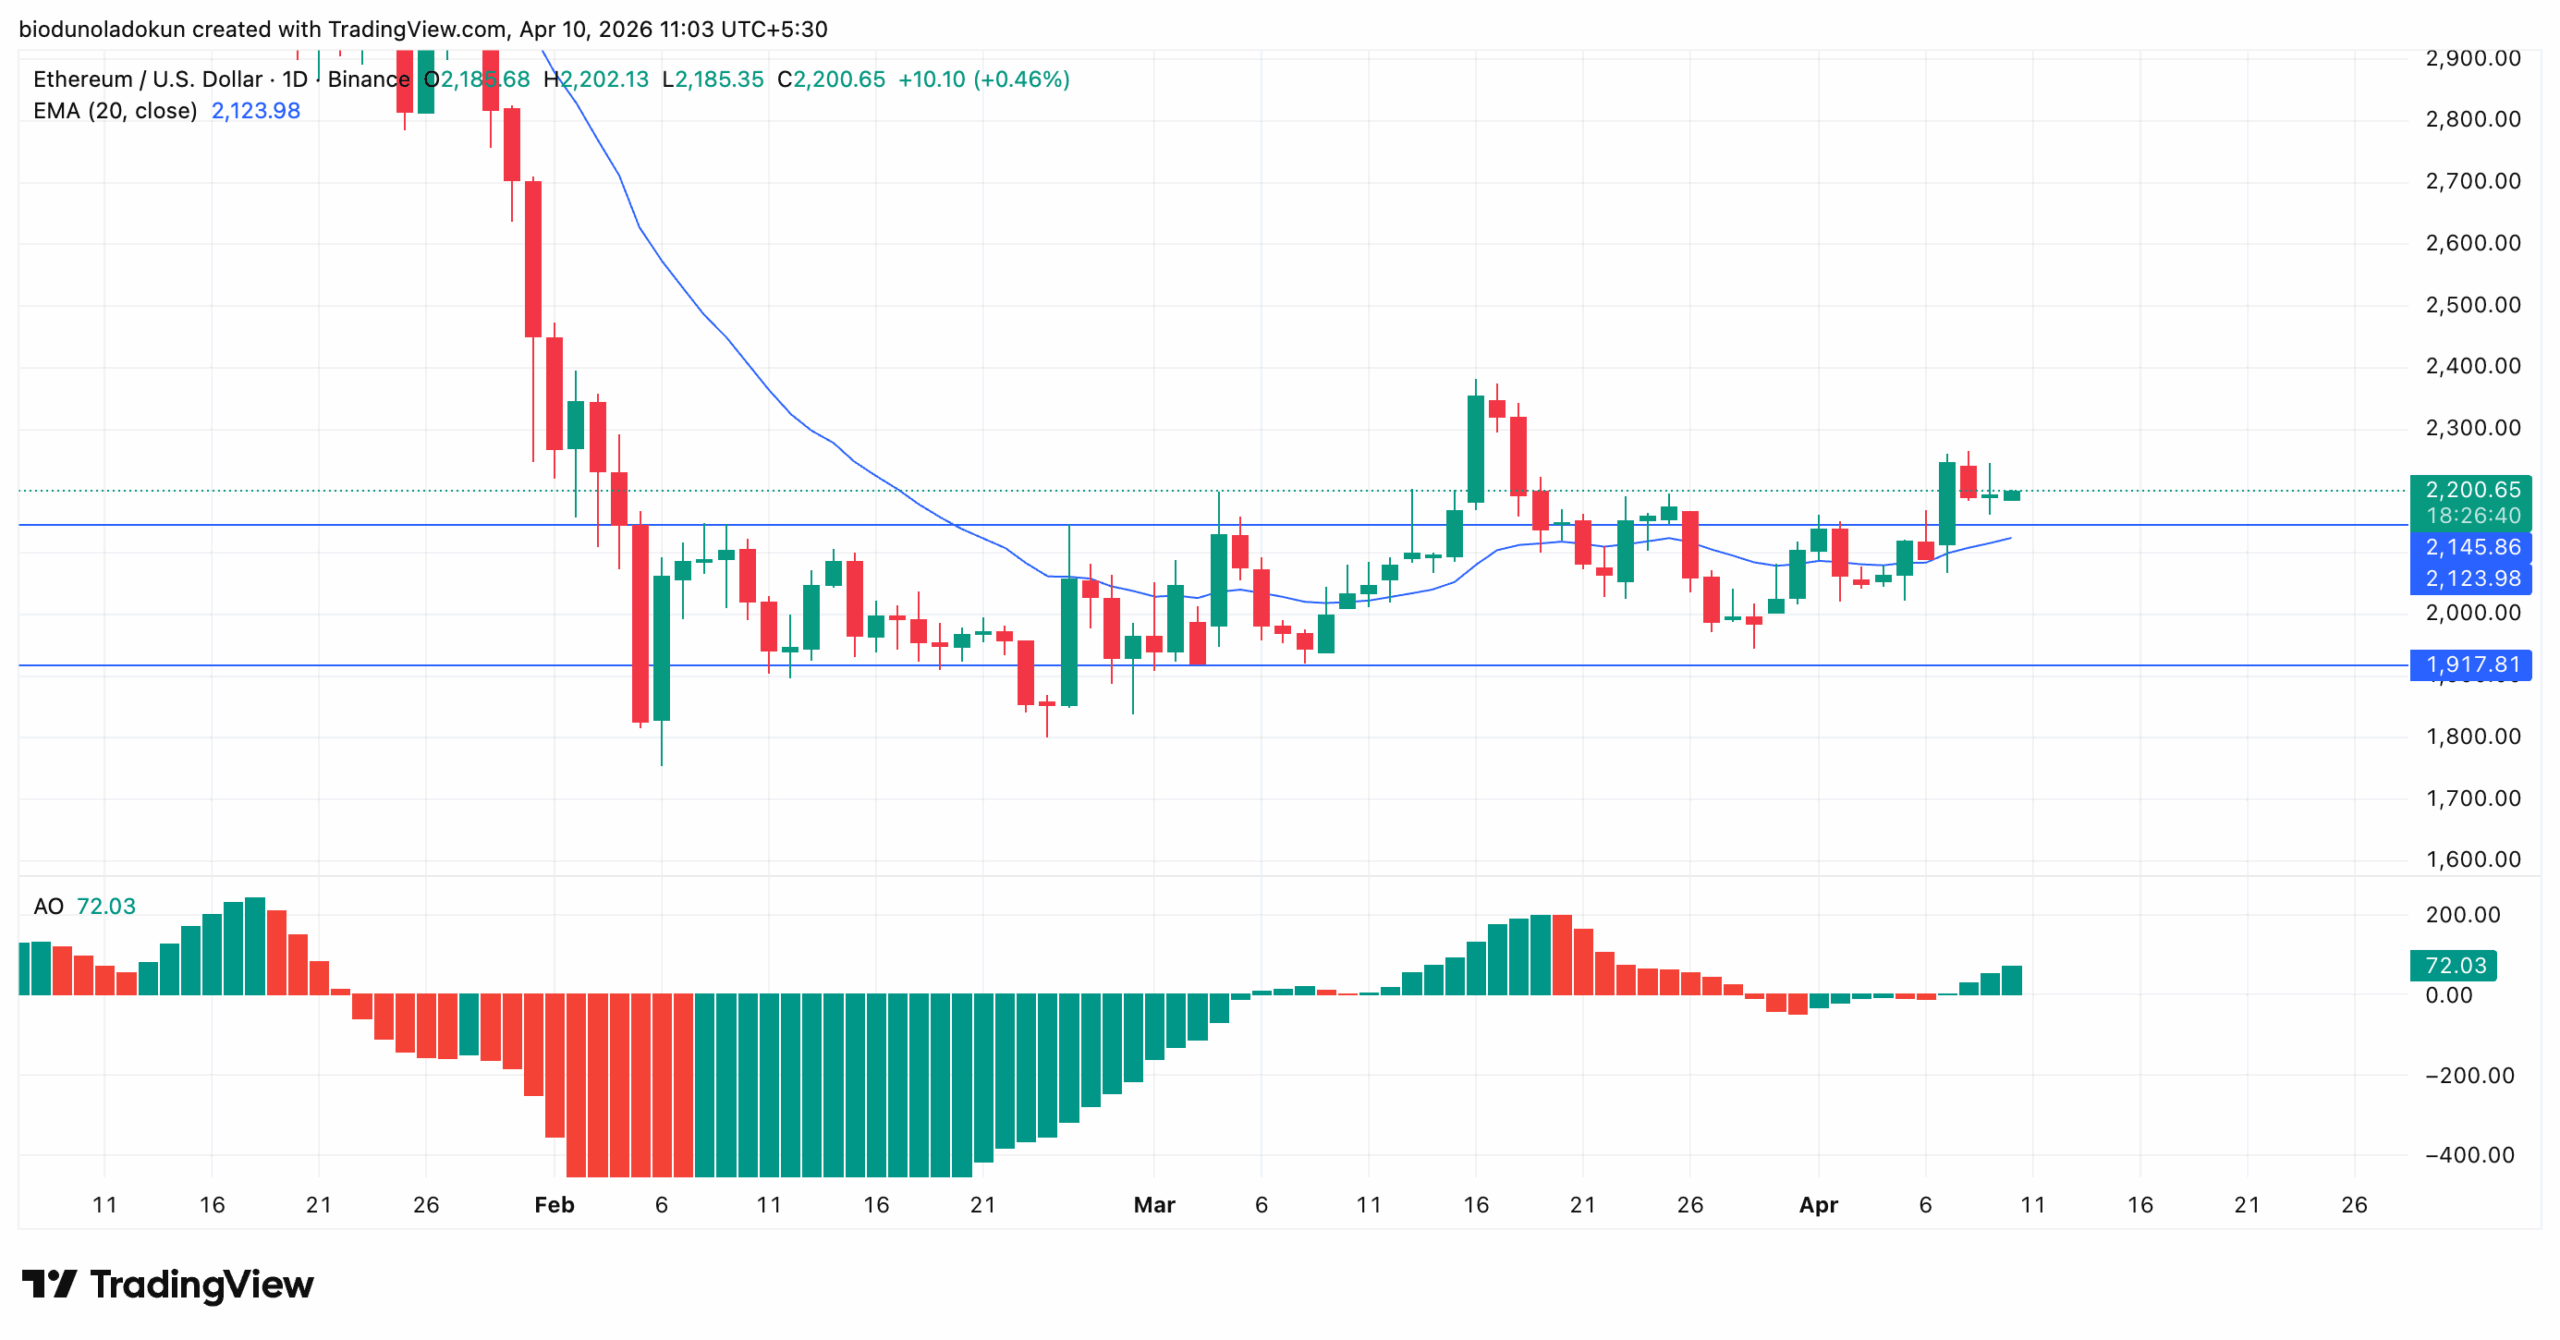
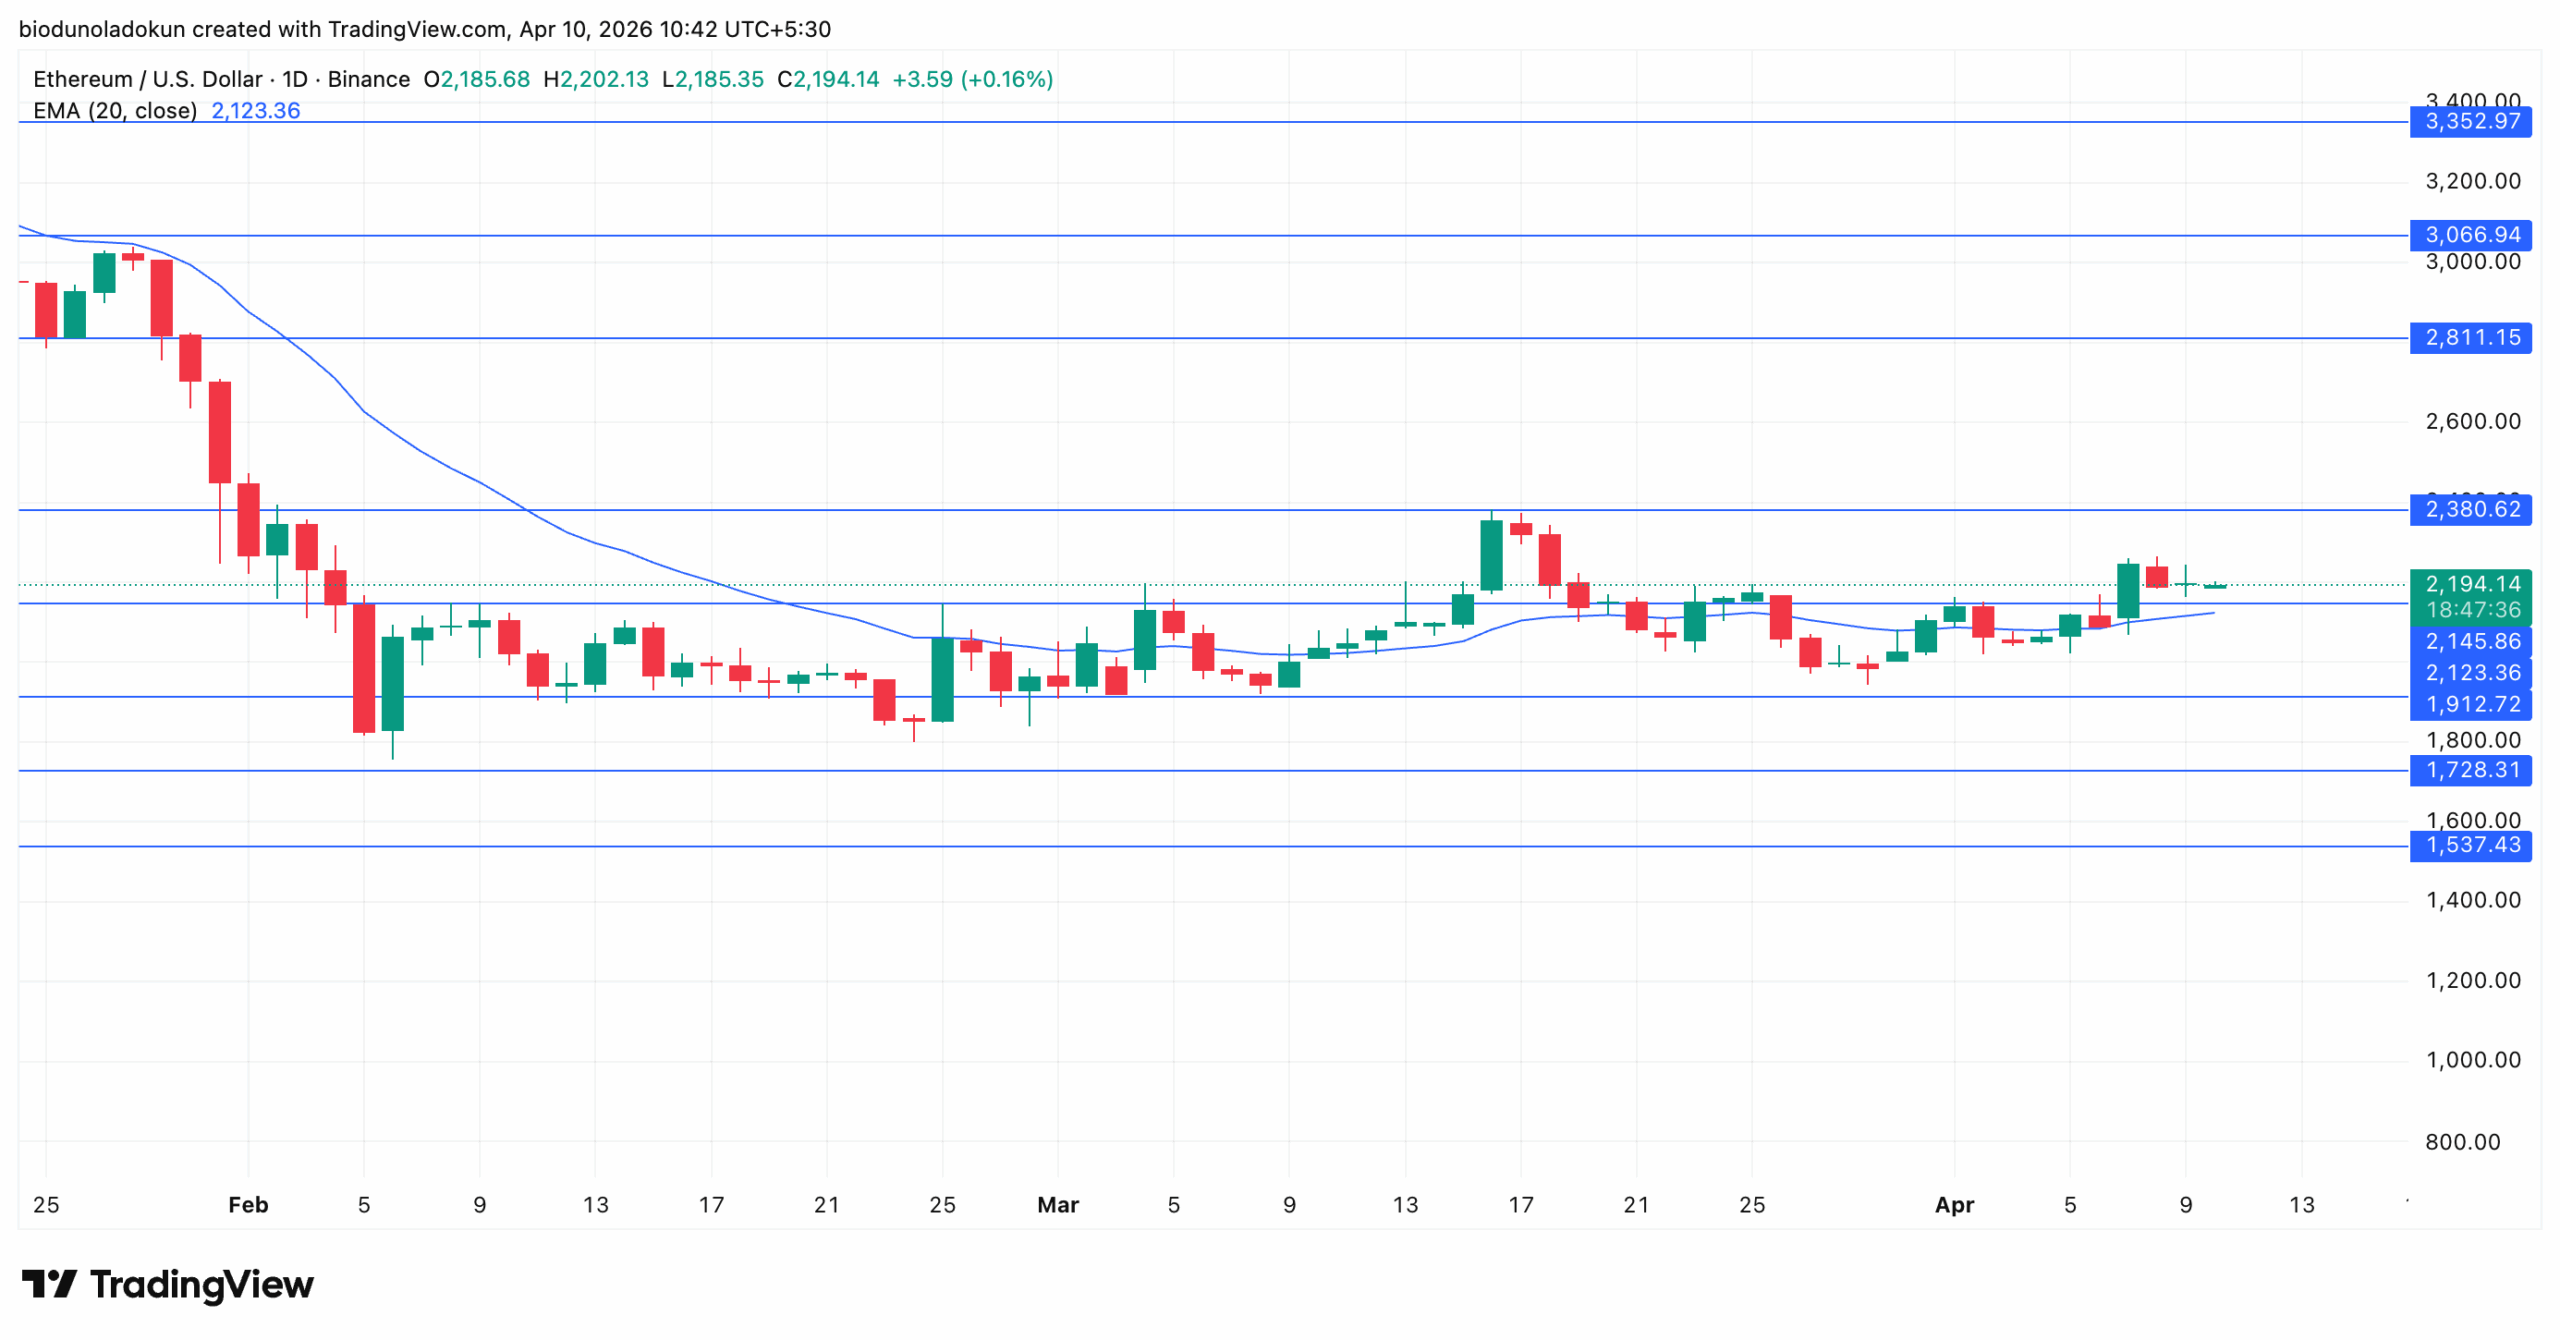
ETH has broken above the $2,145 resistance level and holds above its 20-day EMA at $2,123.
Leading altcoin Ethereum has presented a bullish signal last recorded three years ago, according to pseudonymous CryptoQuant analyst Darkfost.
With the broader market’s recent attempt at recovery, on-chain data shows a gradual shift in sentiment among key ETH participants, particularly in derivatives markets, where buyer pressure is quietly regaining dominance.
What does this mean for ETH’s price?
Ethereum’s Taker Ratio Flips Bullish on Binance
In his latest report, Darkfost found that Ethereum’s Taker Buy/Sell Ratio on leading exchange Binance has returned to positive territory, with a monthly average of approximately 1.016. and has held above the 1 threshold for many days. The last time the metric was setup in a similar way was in 2023.
An asset’s taker buy-sell ratio measures the ratio of buy to sell volumes in its futures market. Values above one indicate that aggressive buyers are outpacing sellers, reflecting a bullish bias in derivatives positioning. On the other hand, a reading below 1 signals dominant selling pressure.
Per the report, this trend in ETH’s Taker Buy/Sell Ratio on Binance is “particularly relevant given that it accounts for over 37% of total ETH open interest, making it a key venue for assessing derivatives positioning.”
The analyst added that the metric’s rally toward, past, and above 1 has been “unfolding gradually, without excessive spikes.”
This matters because in perpetual markets, sharp spikes in the Taker Buy/Sell Ratio often trigger quick reversals and liquidations. The slow, steady climb seen here suggests buyer conviction is building gradually but firmly.
Positive Funding Rate Persists as ETH Climbs
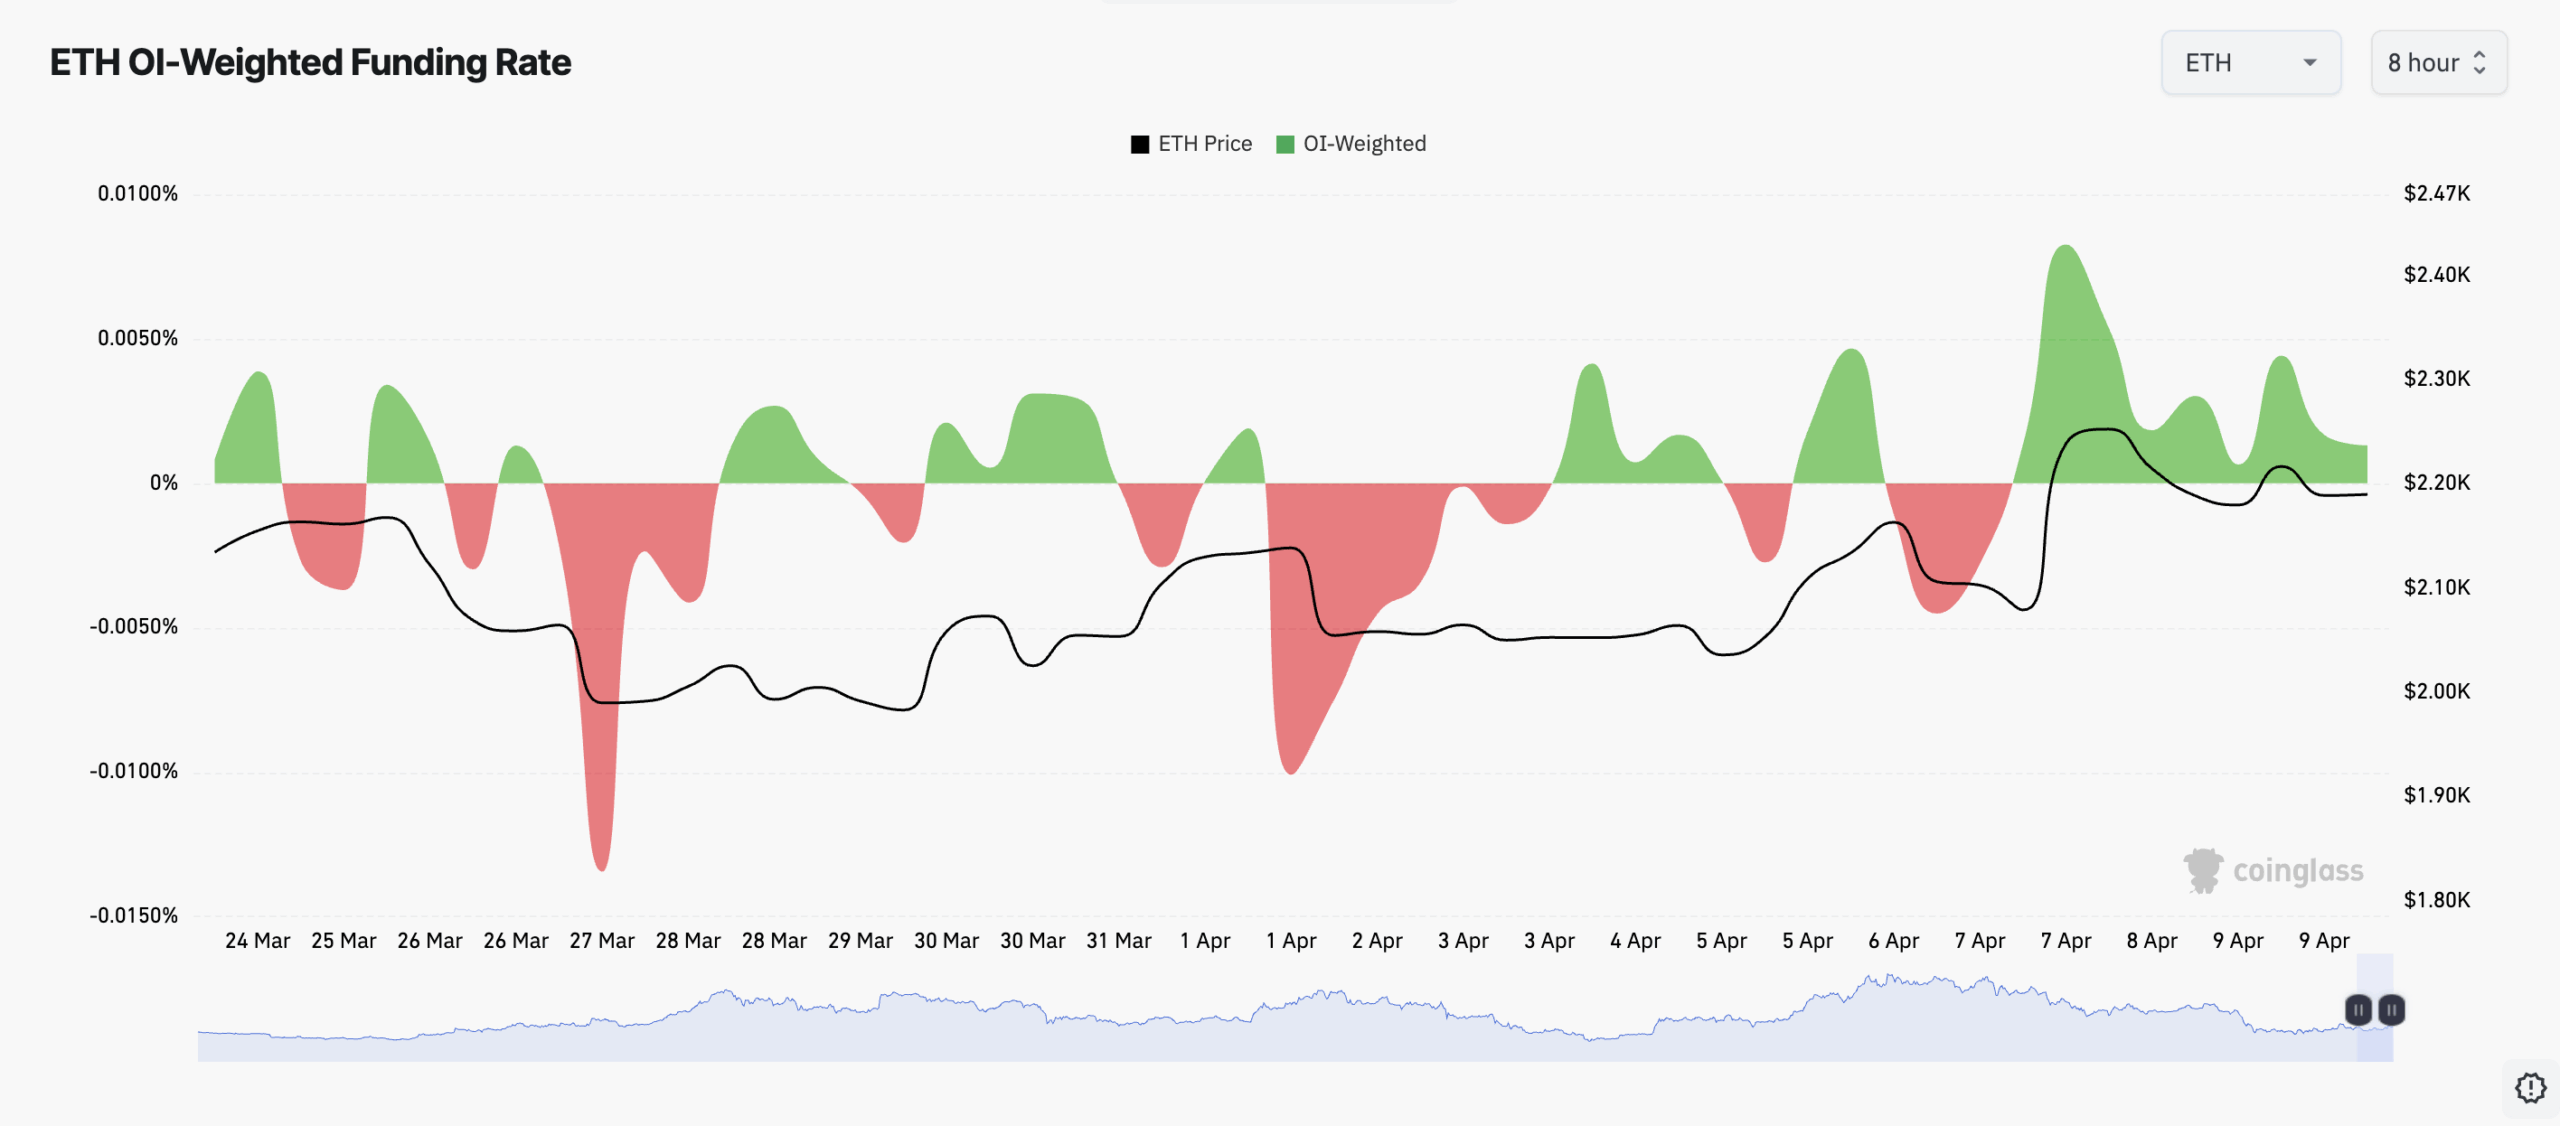
Another bullish signal has emerged in Ethereum’s derivatives markets. The coin’s funding rate has held predominantly positive throughout this week. According to Coinglass, this currently sits at 0.0013%.
The funding rate is the periodic payment exchanged between long and short futures contract holders based on the difference between an asset’s spot price and futures price.
When an asset’s funding rate is positive, it means that long position holders are paying short, indicating a market bias toward bullish sentiment.
Notably, the positive funding rate has remained positive even as ETH’s price climbed 6% over the past seven days. This suggests the optimism is being sustained by genuine conviction among derivatives traders.
Institutional Demand Returns
Over the past week, ETH’s price has risen by nearly 10%, shifting institutional sentiment.
Spot Ethereum ETFs have recorded $122.12 million in net inflows so far this week, putting the funds on course to break the three consecutive weeks of outflows.
Total Ethereum Spot ETF Net Inflow | Credit: SosoValue
The shift suggests growing institutional demand for ETH exposure, further strengthening the bullish case for the asset in the near term.
Total net assets across these products currently stand at $12.69 billion.
Ethereum Momentum Indicators Turn Bullish
ETH’s near-double-digit rally this week has pushed it above the upper line of the horizontal channel, which had long served as resistance at $2,145. It also trades above its 20-day exponential moving average, which now serves as dynamic support at $2,123.
ETH/USD Daily Chart | Credit: TradingView
The 20-day EMA measures an asset’s average price over the past 20 trading days, giving more weight to recent prices. Trading below this level suggests sellers are in control, and price rallies may struggle to maintain momentum.
Conversely, when an asset’s price holds above this key moving average, buyers are in control, and the prevailing momentum is bullish.
Moreover, ETH’s Awesome Oscillator has surged gradually over the past four sessions, with histogram bars growing in size. At press time, this momentum indicator stands at 72.03.
The Awesome Oscillator compares an asset’s current market momentum with its longer-term momentum, helping identify potential trend shifts. When it shows green histogram bars and positive values, it indicates strong momentum and increasing bullish sentiment.
This signals that bullish momentum is increasing and that ETH buyers are increasingly overpowering sellers.
What to expect?
If ETH holds above the support levels at $2,123 and $2,145, it could propel the altcoin to $2,380 and beyond to $2,811.This may put the long-awaited $3,000 milestone firmly back in play.
Disclaimer:
The information provided in this article is for informational purposes only. It is not intended to be, nor should it be construed as, financial advice. We do not make any warranties regarding the completeness, reliability, or accuracy of this information. All investments involve risk, and past performance does not guarantee future results. We recommend consulting a financial advisor before making any investment decisions.
Abiodun Oladokun is a Research Analyst at CCN, where he covers cryptocurrency markets with a focus on on-chain analysis, technical assessments, and emerging trends across decentralized finance (DeFi), real-world assets (RWA), artificial intelligence (AI), decentralized physical infrastructure networks (DePIN), Layer 2s, and meme coins.
Prior to CCN, he served as a Senior On-Chain Analyst at BeInCrypto, producing market reports spanning diverse crypto sectors.
Before that, he conducted technical analysis and market assessments of various altcoins at AMBCrypto, where he also contributed long-form quarterly research papers on DeFi, NFTs, DAOs, and scaling architectures, leveraging on-chain platforms including Messari, Santiment, DefiLlama, and Dune Analytics.
He began his crypto career as a research analyst at SixthSense DAO, developing blockchain forensic tools to trace the history of stolen assets.
Abiodun is a lawyer called to the Nigerian Bar and the founder of Ilé Ijó, a Lagos-based electronic dance music collective.