XRP selloff remains in control, with the setup keeping price trapped in a descending channel.
Even with $17.5 million in net exchange outflows, the trend won’t flip without demand.
The daily structure remains bearish, suggesting a break below $1.65 could be next.
XRP’s downtrend has intensified, pushing the asset to its lowest level in 14 months. The correction has now wiped out roughly 54% of its all-time high.
Although trading volume surged by nearly 100%, the increase has been driven largely by sell-side pressure.
This position highlights growing distribution and panic-led exits across the crypto market.
While volatility is now extreme, XRP’s price remains under heavy pressure. As such, technical indicators continue to favor further downside instead of a crucial rebound.
XRP Downtrend Continues Unabated
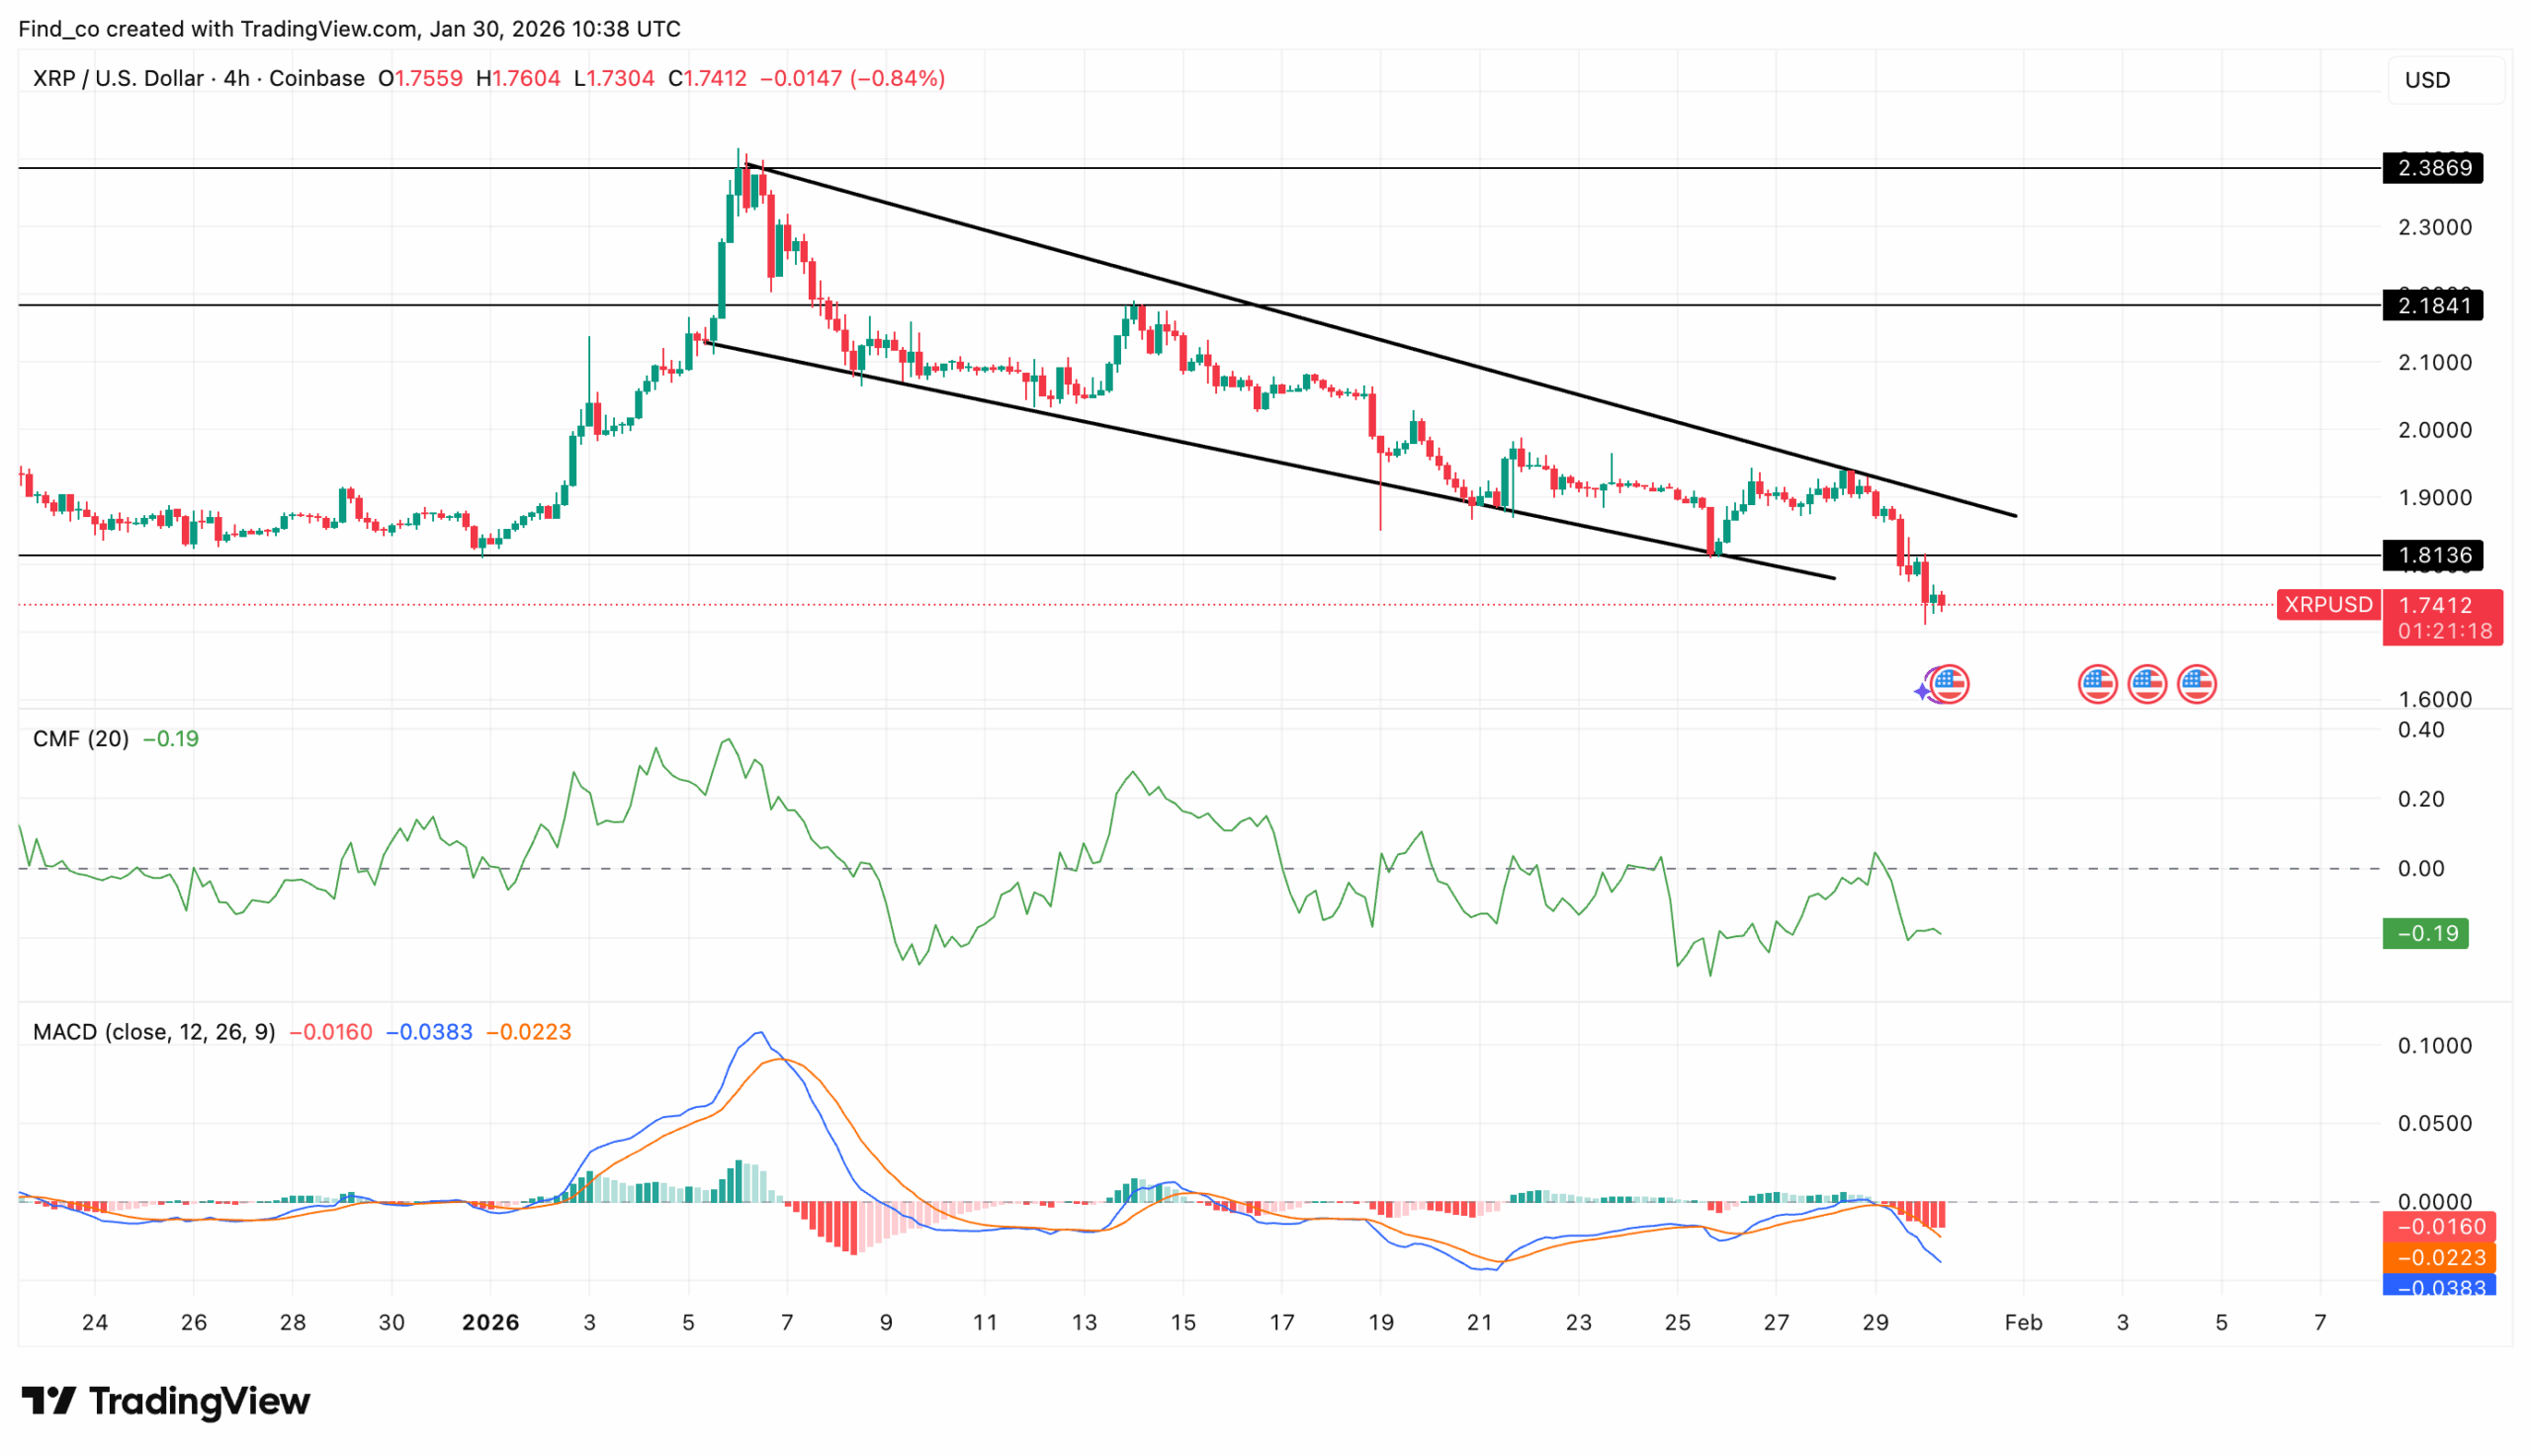
At the time of writing, the Chaikin Money Flow (CMF) on the 4-hour chart reveals the depth of this bearish pressure.
The indicator has slipped deeper into negative territory, now printing -0.18, a reading that reflects sustained capital outflows rather than short-term profit-taking.
Furthermore, this setup suggests active seller distribution, with buyers still largely absent.
Additionally, momentum indicators further confirm the weakness. The Moving Average Convergence Divergence (MACD) continues to display expanding red histogram bars, while the 26-day EMA remains above the 12-day EMA.
As long as XRP trades below the descending trendline, rallies are likely to face selling pressure.
If sellers force a break below the channel floor, XRP’s price could drift toward the next support zone near $1.65, followed by a deeper slide toward $1.55 should bearish momentum accelerate.
Exchange Outflows Persist
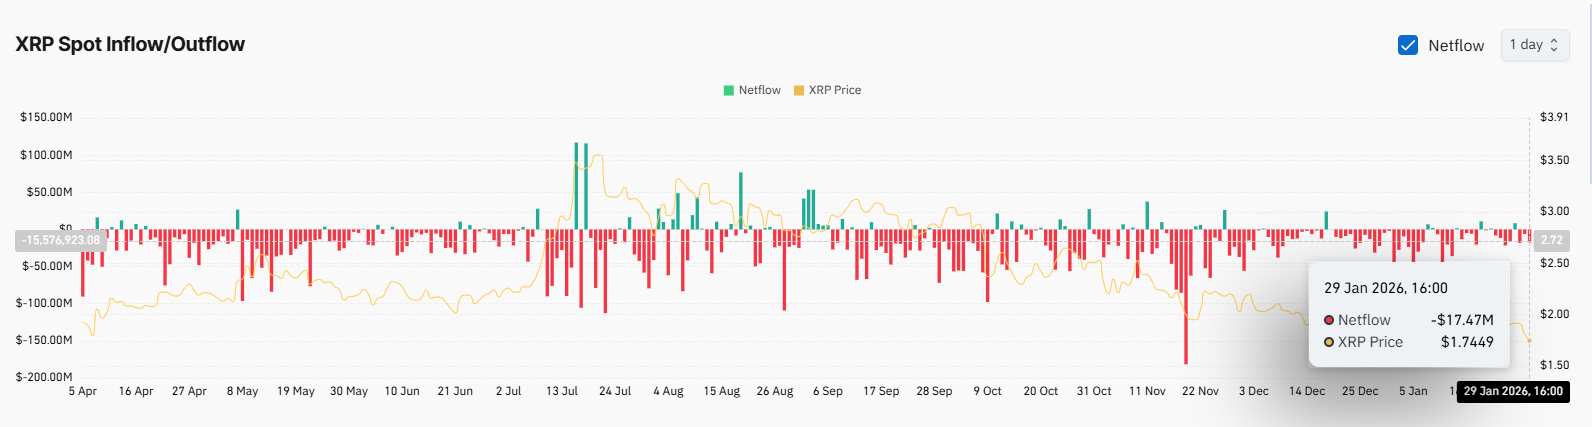
Outside the technical setup, NetFlow data shows a decline of $17.47 million. This means that more XRP is leaving exchanges than entering them.
Taken alone, this trend can signal reduced immediate sell pressure, as traders move assets into self-custody instead of positioning to sell.
Without a clear pickup in spot demand or a breakout from its declining structure, exchange outflows by themselves remain insufficient to reverse the trend.
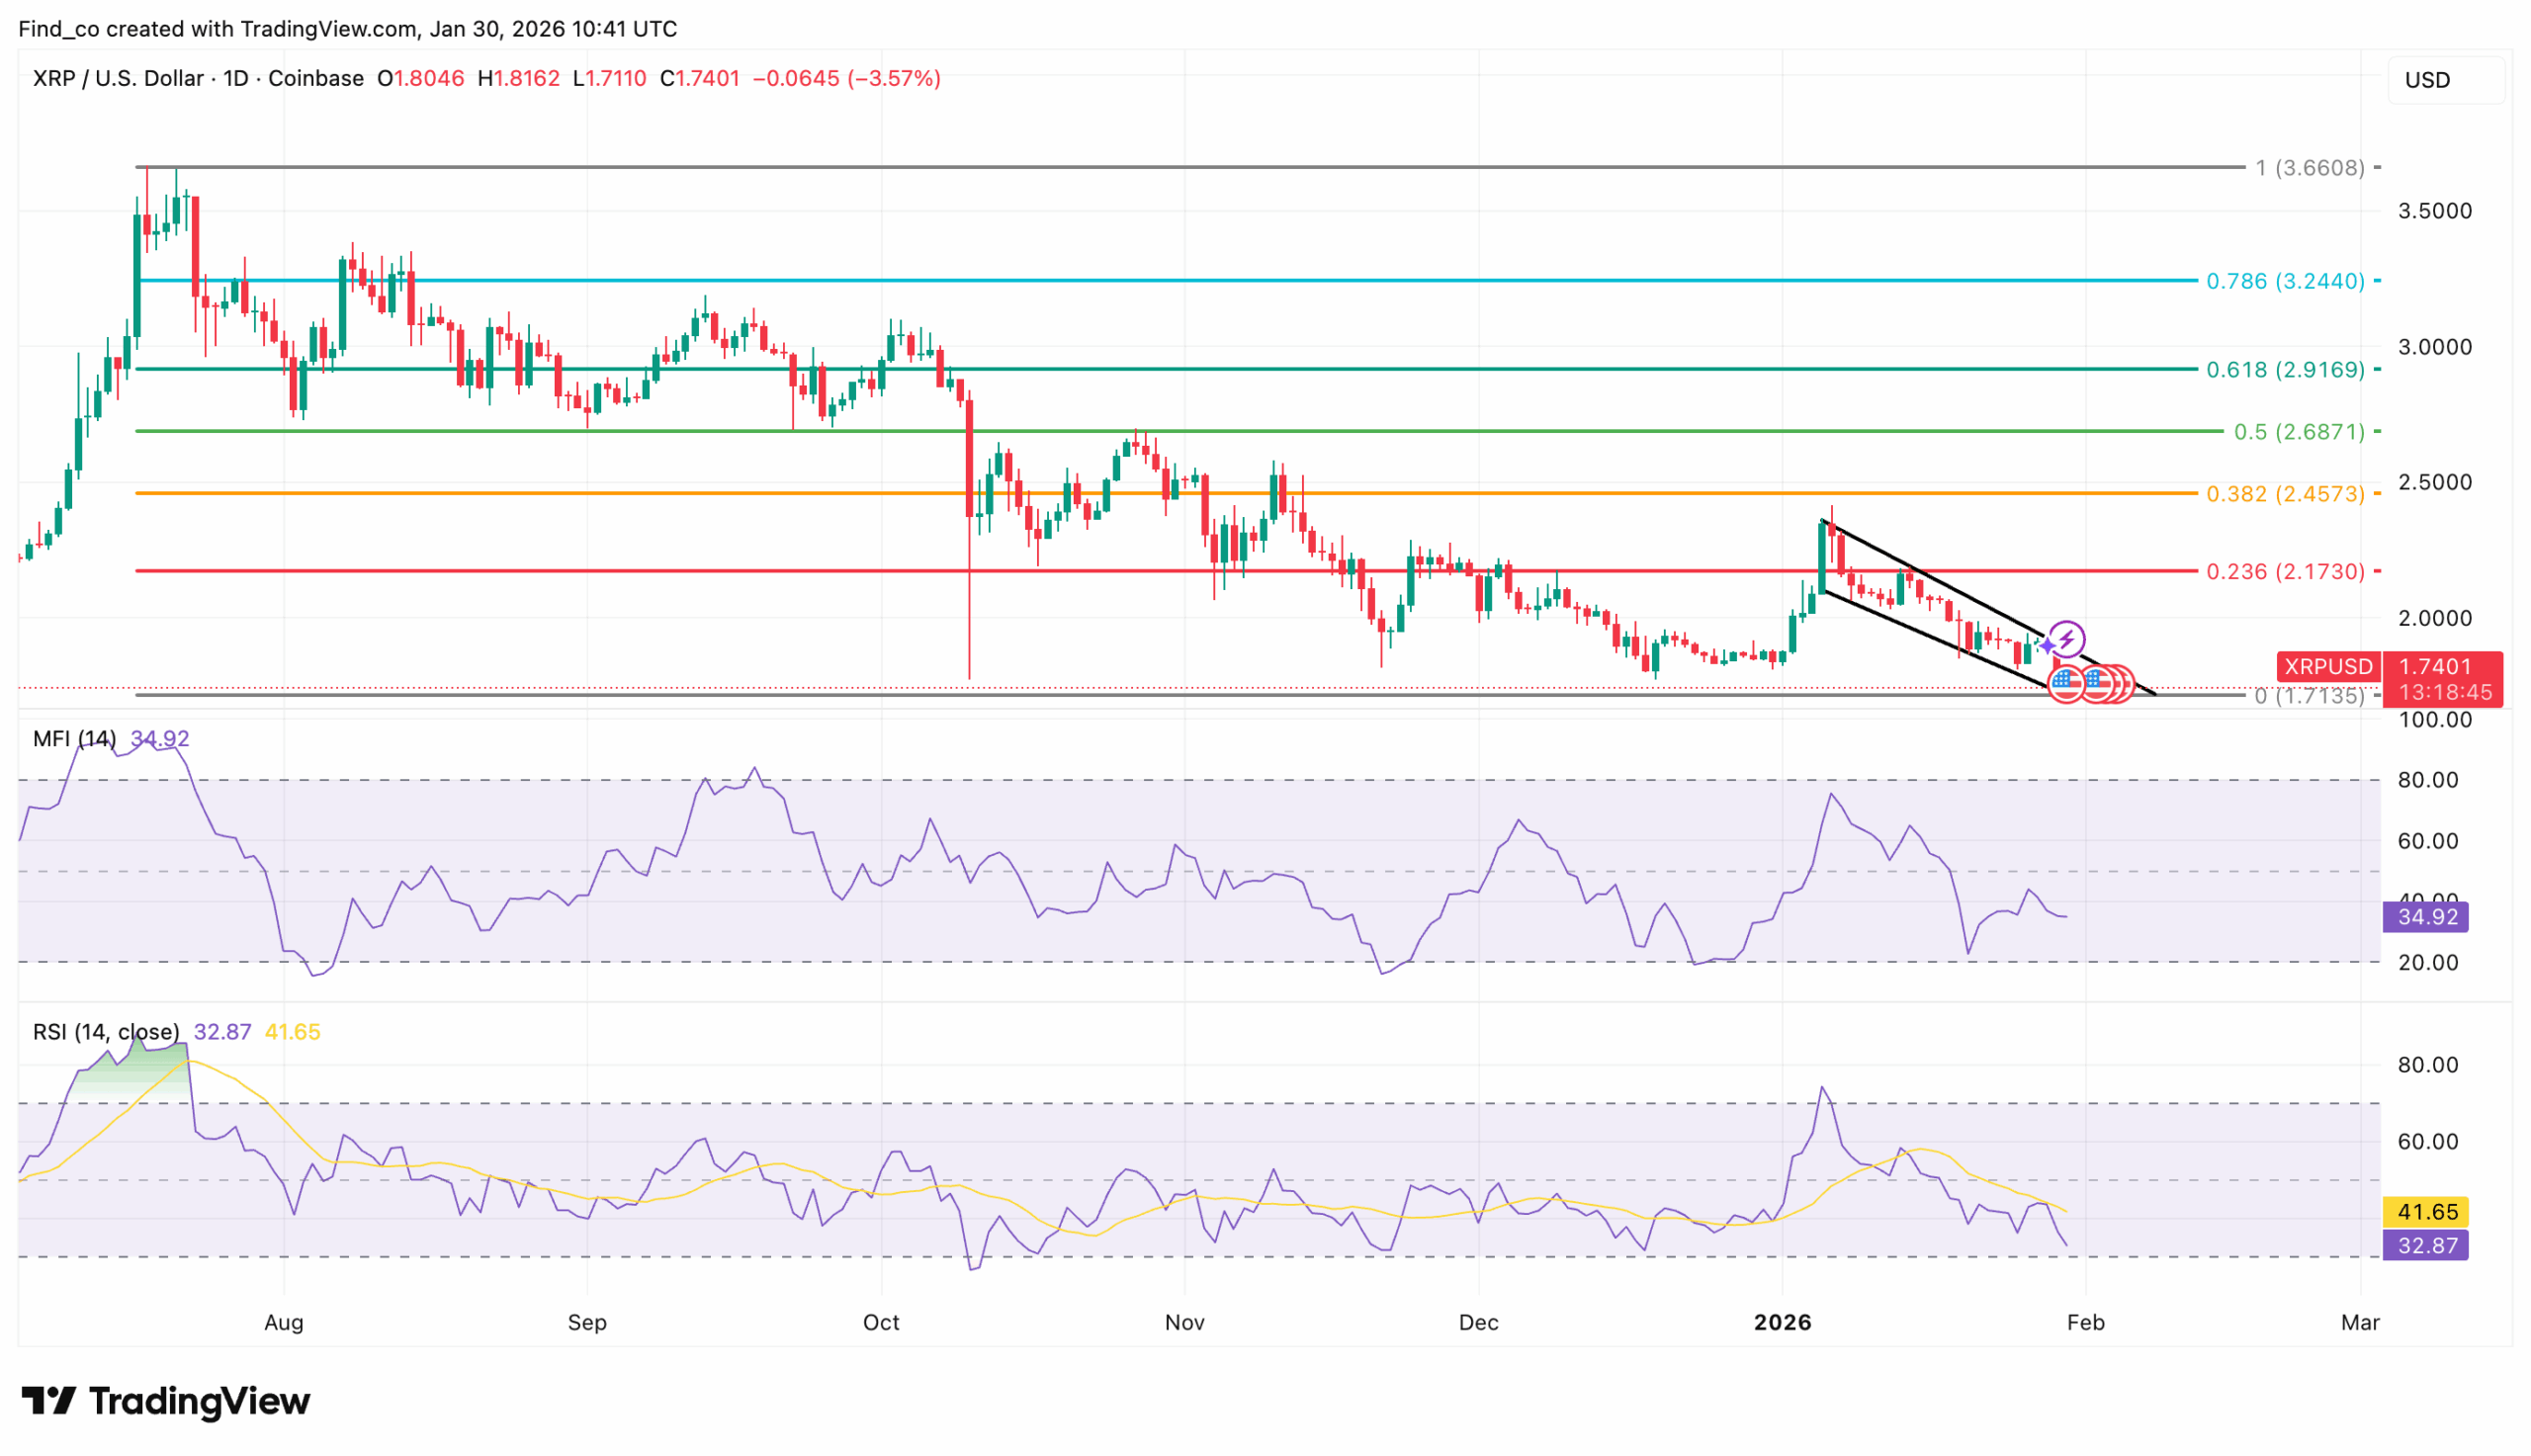
On the daily chart, XRP has continued to print lower highs and lower lows.
The altcoin currently trades at $1.76, well below its declining trendline, reinforcing that sellers still dominate the broader structure.
Each rebound has been capped at progressively lower levels, keeping bullish momentum weak and short-lived.
The Money Flow Index (MFI) remains below the midline and continues to slope downward, signaling ongoing capital outflows and a lack of aggressive dip-buying.
This reading shows that sellers still control volume-backed momentum, aligning with the broader bearish trend.
Meanwhile, the Relative Strength Index (RSI) sits near the oversold threshold at 33.86, illustrating how sharply momentum has deteriorated.
While such levels can sometimes trigger brief relief bounces, the lack of a clear bullish divergence keeps that possibility uncertain.
Fibonacci retracement levels offer additional clarity on XRP’s price outlook.
The asset continues to trend lower and now hovers near the zero Fib level at $1.71.
For context, this zone often acts as the final support in a corrective move.
On the other hand, if XRP pushes above its immediate resistance at $2.19, the bearish structure would begin to weaken, potentially opening the door to a broader recovery.
A sustained move beyond this level would suggest that buyers are finally absorbing sell pressure.
In a situation like that, XRP’s price might rise toward $3.
Disclaimer:
The information provided in this article is for informational purposes only. It is not intended to be, nor should it be construed as, financial advice. We do not make any warranties regarding the completeness, reliability, or accuracy of this information. All investments involve risk, and past performance does not guarantee future results. We recommend consulting a financial advisor before making any investment decisions.
Victor Olanrewaju is a crypto analyst and reporter at CCN with deep roots in on-chain research and technical analysis. His crypto journey began in 2017, but it was the 2020 Uniswap airdrop that sparked a full-time pivot into the space.
With a foundation in copywriting, Victor honed his craft creating high-converting content for leading crypto brokers — most notably an XRP price prediction that ranked #1 on Google during the 2021 bull run.
He later joined AMBCrypto in 2022, where he combined storytelling with technical and on-chain analysis to cover key market narratives.
In 2024, he expanded his expertise at BeInCrypto, collaborating with analysts and using tools like Glassnode, Santiment, and IntoTheBlock to break down Bitcoin and altcoin trends.
At CCN, Victor covers the top cryptocurrencies, memecoins, macro shifts, blending real-time insights with deep-dive metrics.
He holds a Bachelor’s degree in Physics from the University of Ibadan, equipping him to simplify complex data for a wide audience. Follow his work or connect on LinkedIn or X.