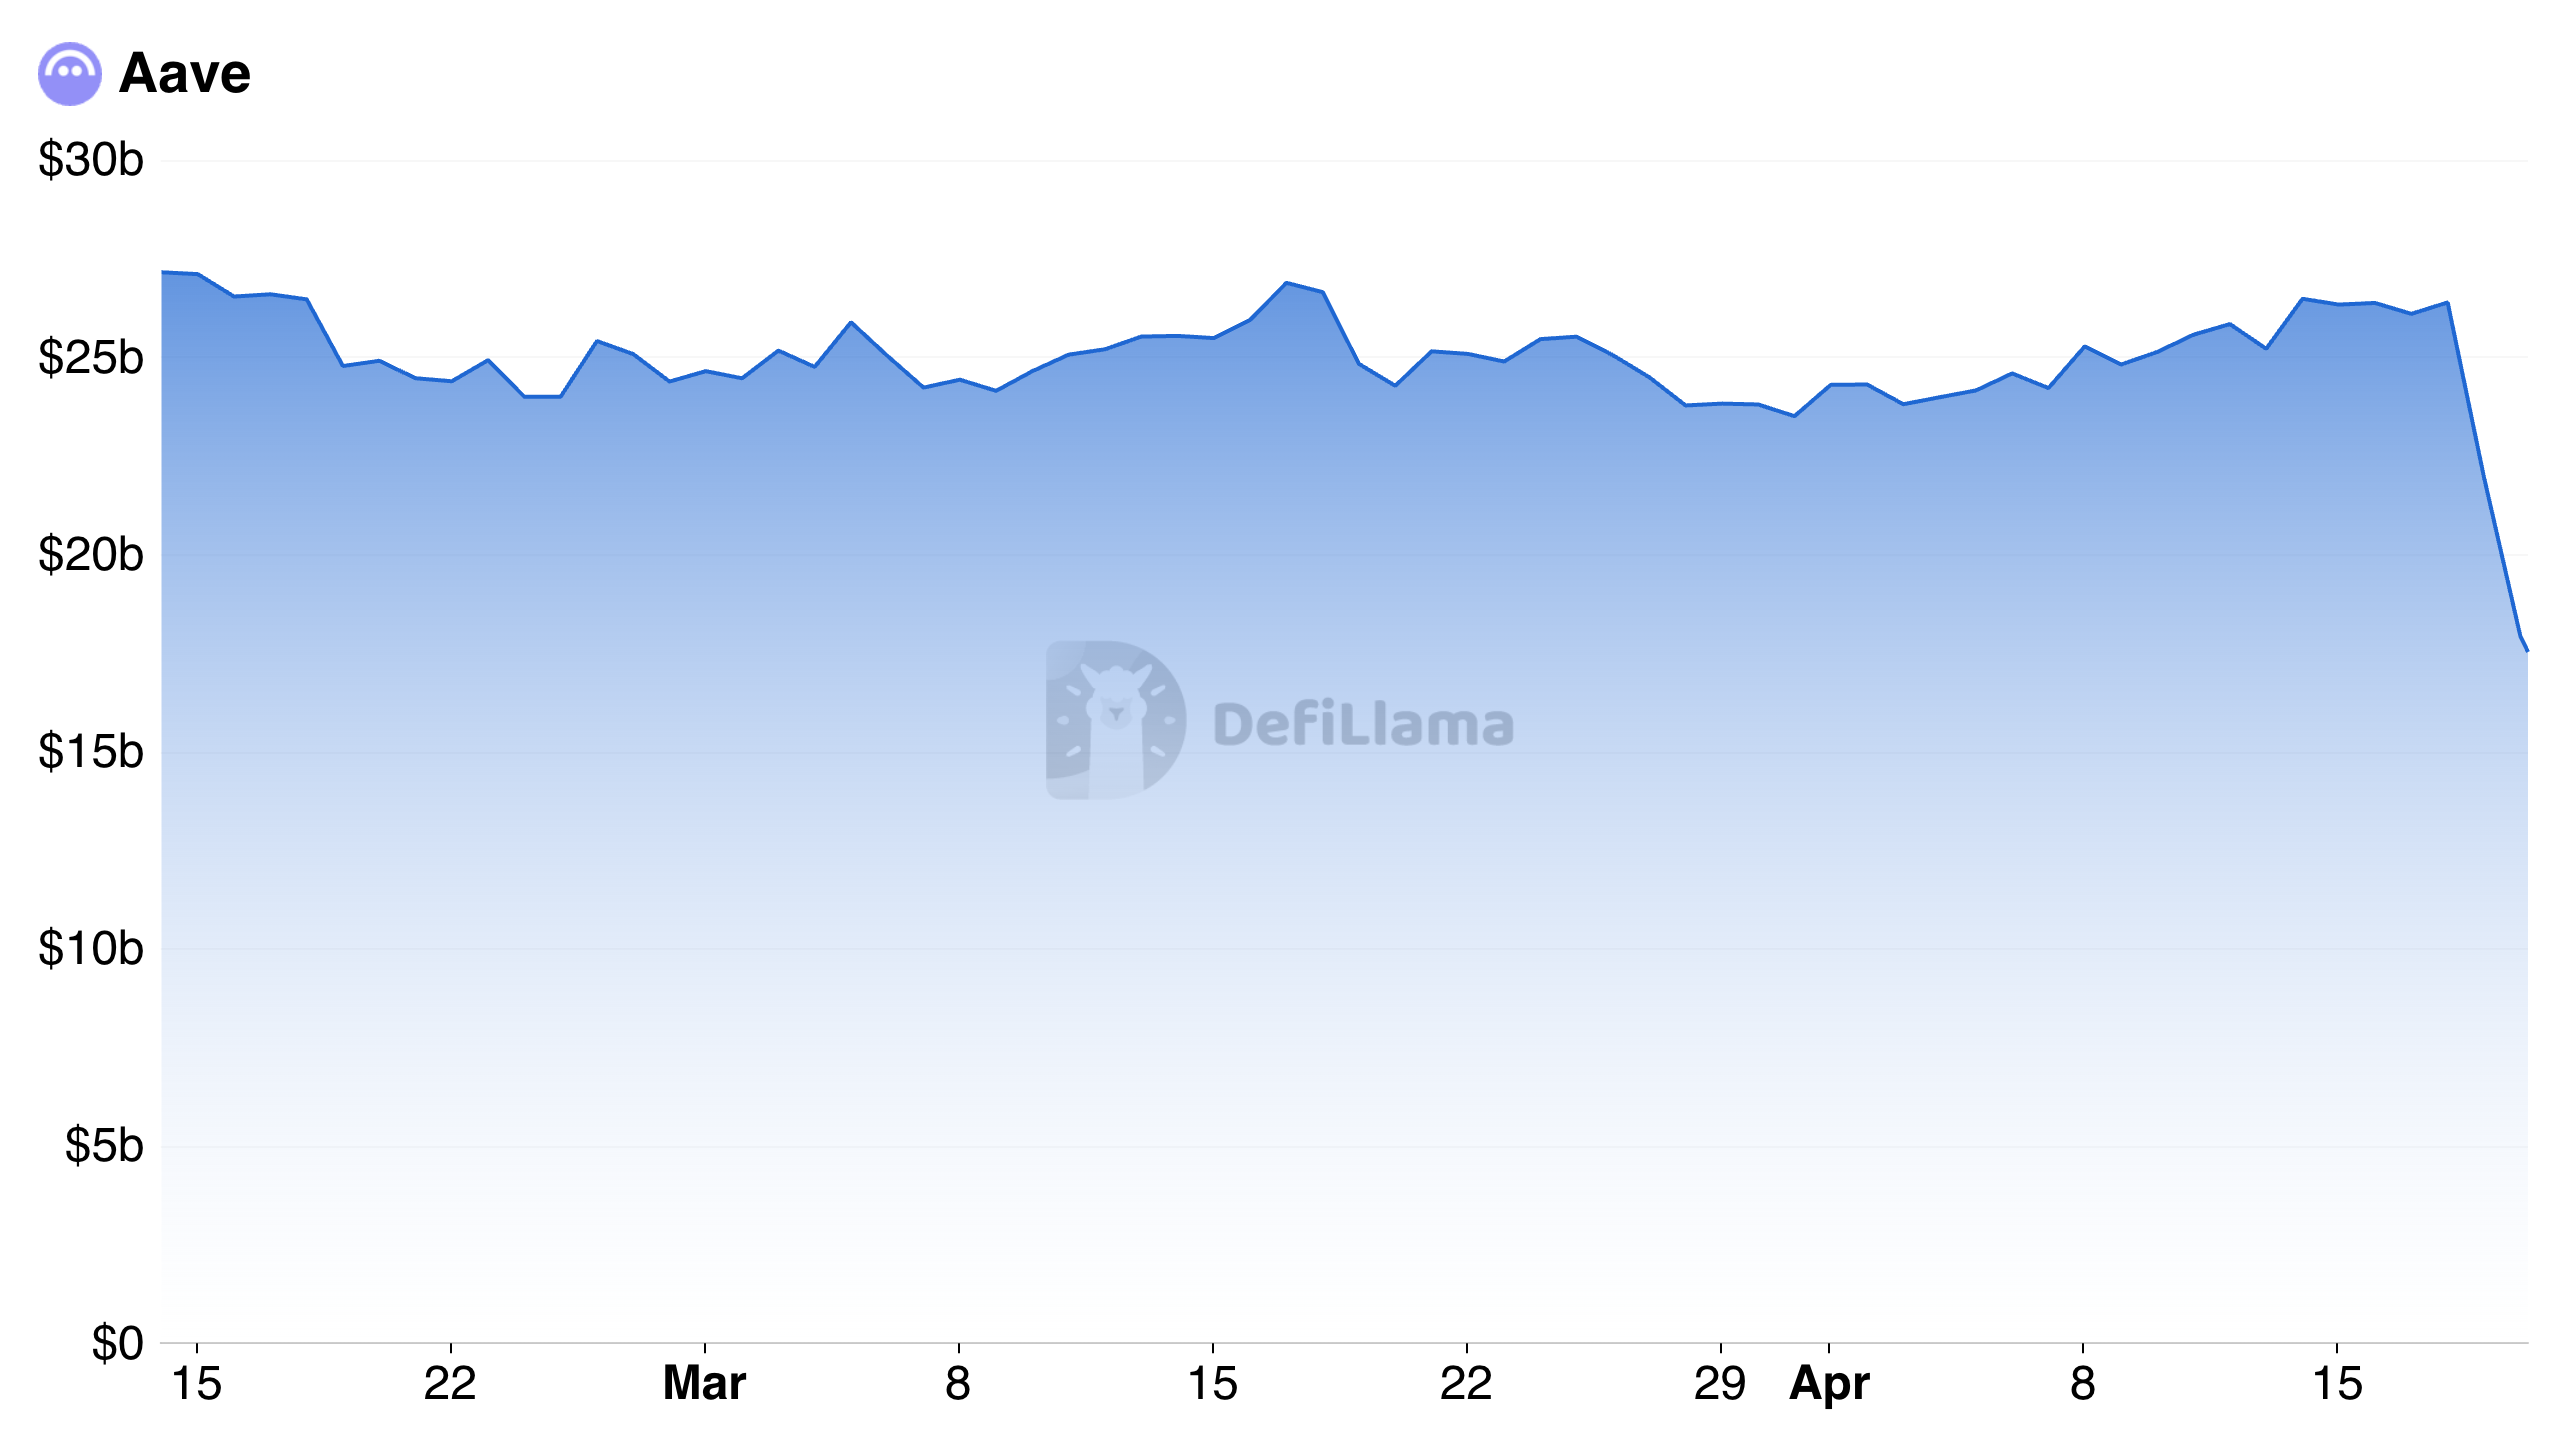
Aave’s TVL has fallen to a six-month low of $17.56 billion, down 35% in two days, as the KelpDAO exploit on April 18 triggered a mass withdrawal of supplied and borrowed assets from the protocol.
AAVE has lost 12% since the exploit, with the Elder-Ray Index and DMI both confirming bearish momentum on the daily chart and no technical basis for a near-term reversal.
Despite the selloff, whale wallets holding 10,000–100,000 AAVE increased holdings by 3% post-exploit, and the funding rate has flipped positive — suggesting some market participants are positioning for a recovery.
Aave, the largest lending protocol in decentralized finance (DeFi), has seen its total value locked (TVL) plunge by $9 billion and its native token fall 12% since KelpDAO’s exploit on April 18.
On-chain data suggests the worst may not be over.
What Happened?
Kelp is a liquid restaking protocol that takes already-staked Ether, routes it through EigenLayer for additional yield, and issues a receipt token — rsETH — in return.
On April 18, attackers manipulated Kelp’s cross-chain bridge into releasing 116,500 rsETH, worth approximately $292 million, to an address they controlled.
The stolen tokens were then deposited onto Aave V3 as collateral, and the attackers borrowed wrapped ether (WETH) against them.
Sponsored
Disclosure
We sometimes use affiliate links in our content, when clicking on those we might receive a commission at no extra cost to you. By using this website you agree to our terms and conditions and privacy policy.
Although Aave moved quickly to contain risk by freezing rsETH markets across V3 and V4, confidence in the protocol and the token has since suffered a significant hit.
TVL, Supply, and Borrowing in Freefall
Aave’s TVL has fallen to a six-month low of $17.56 billion, down 35% since the April 18 exploit.
This double-digit decline in TVL indicates that depositors deliberately withdrew large funds from the lending protocol as the attack eroded confidence.
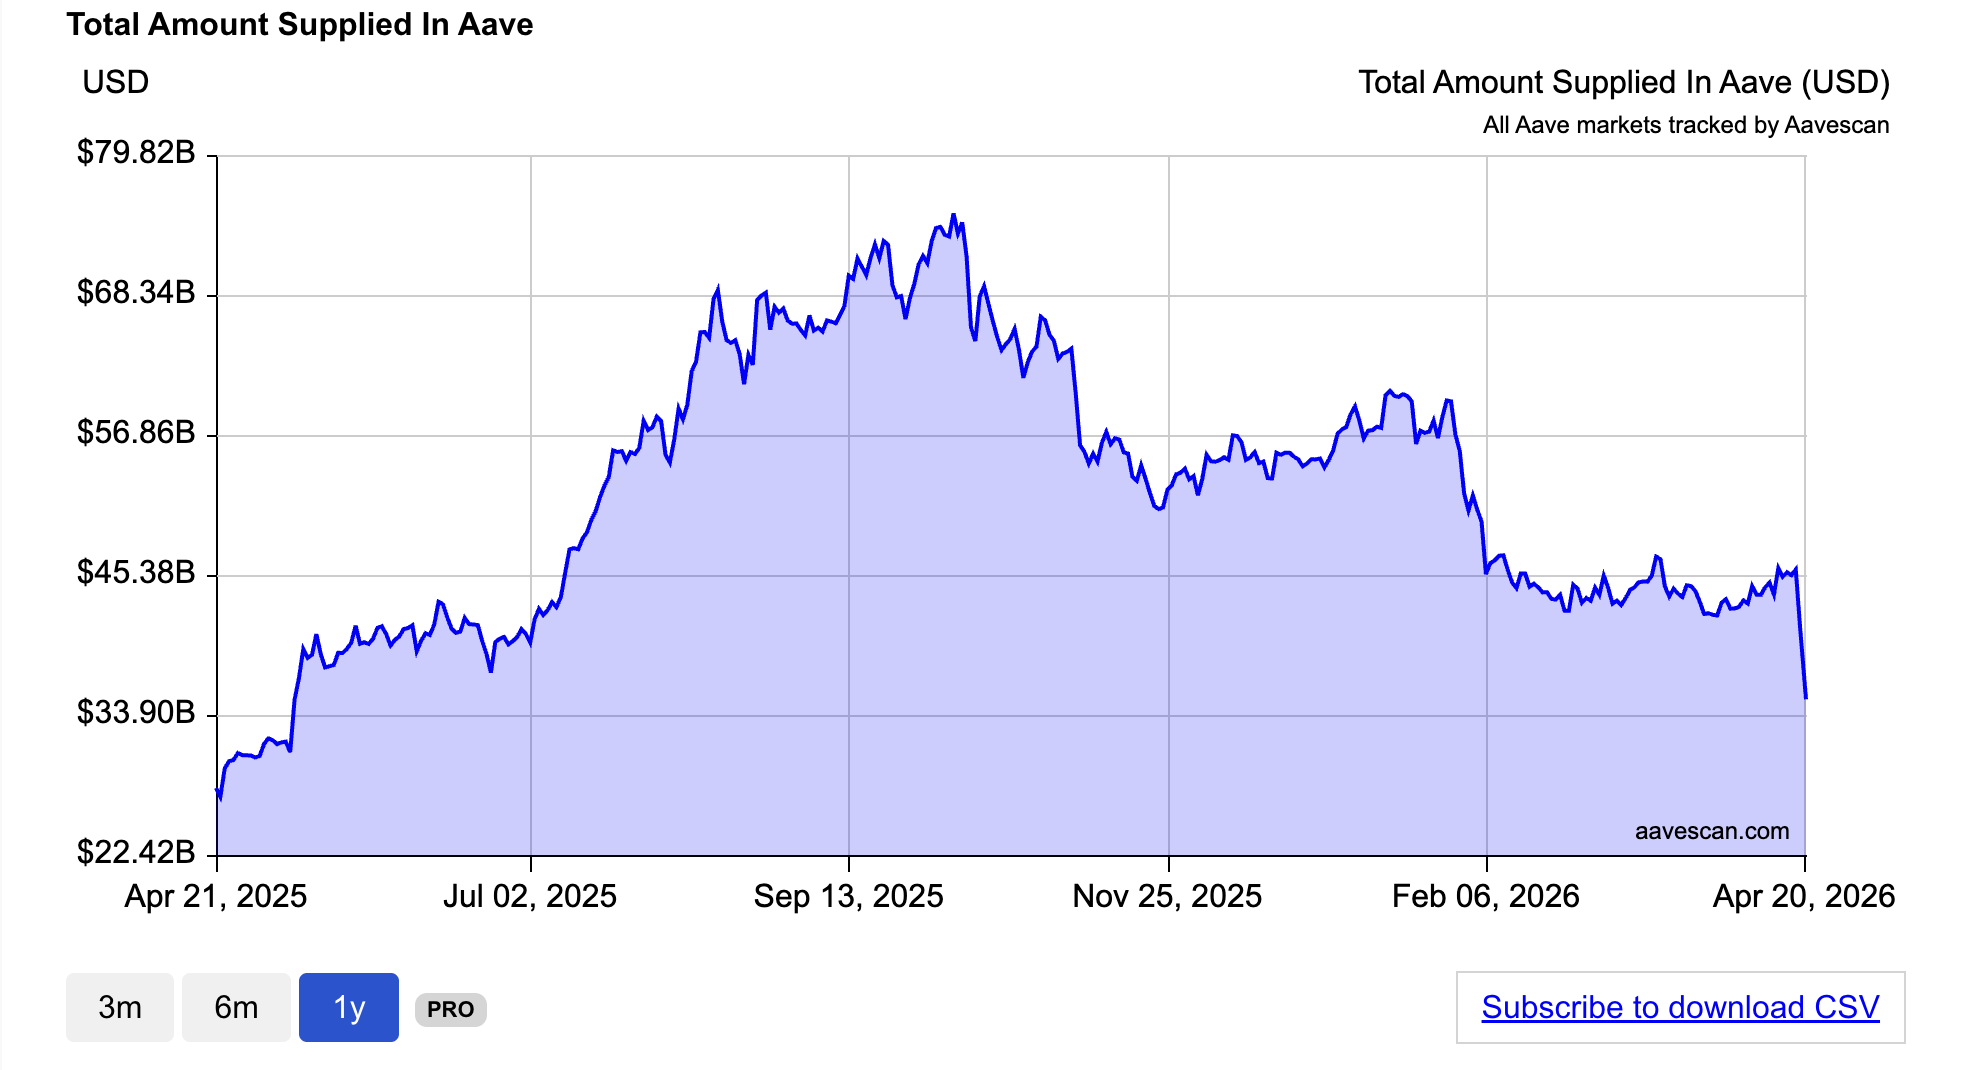
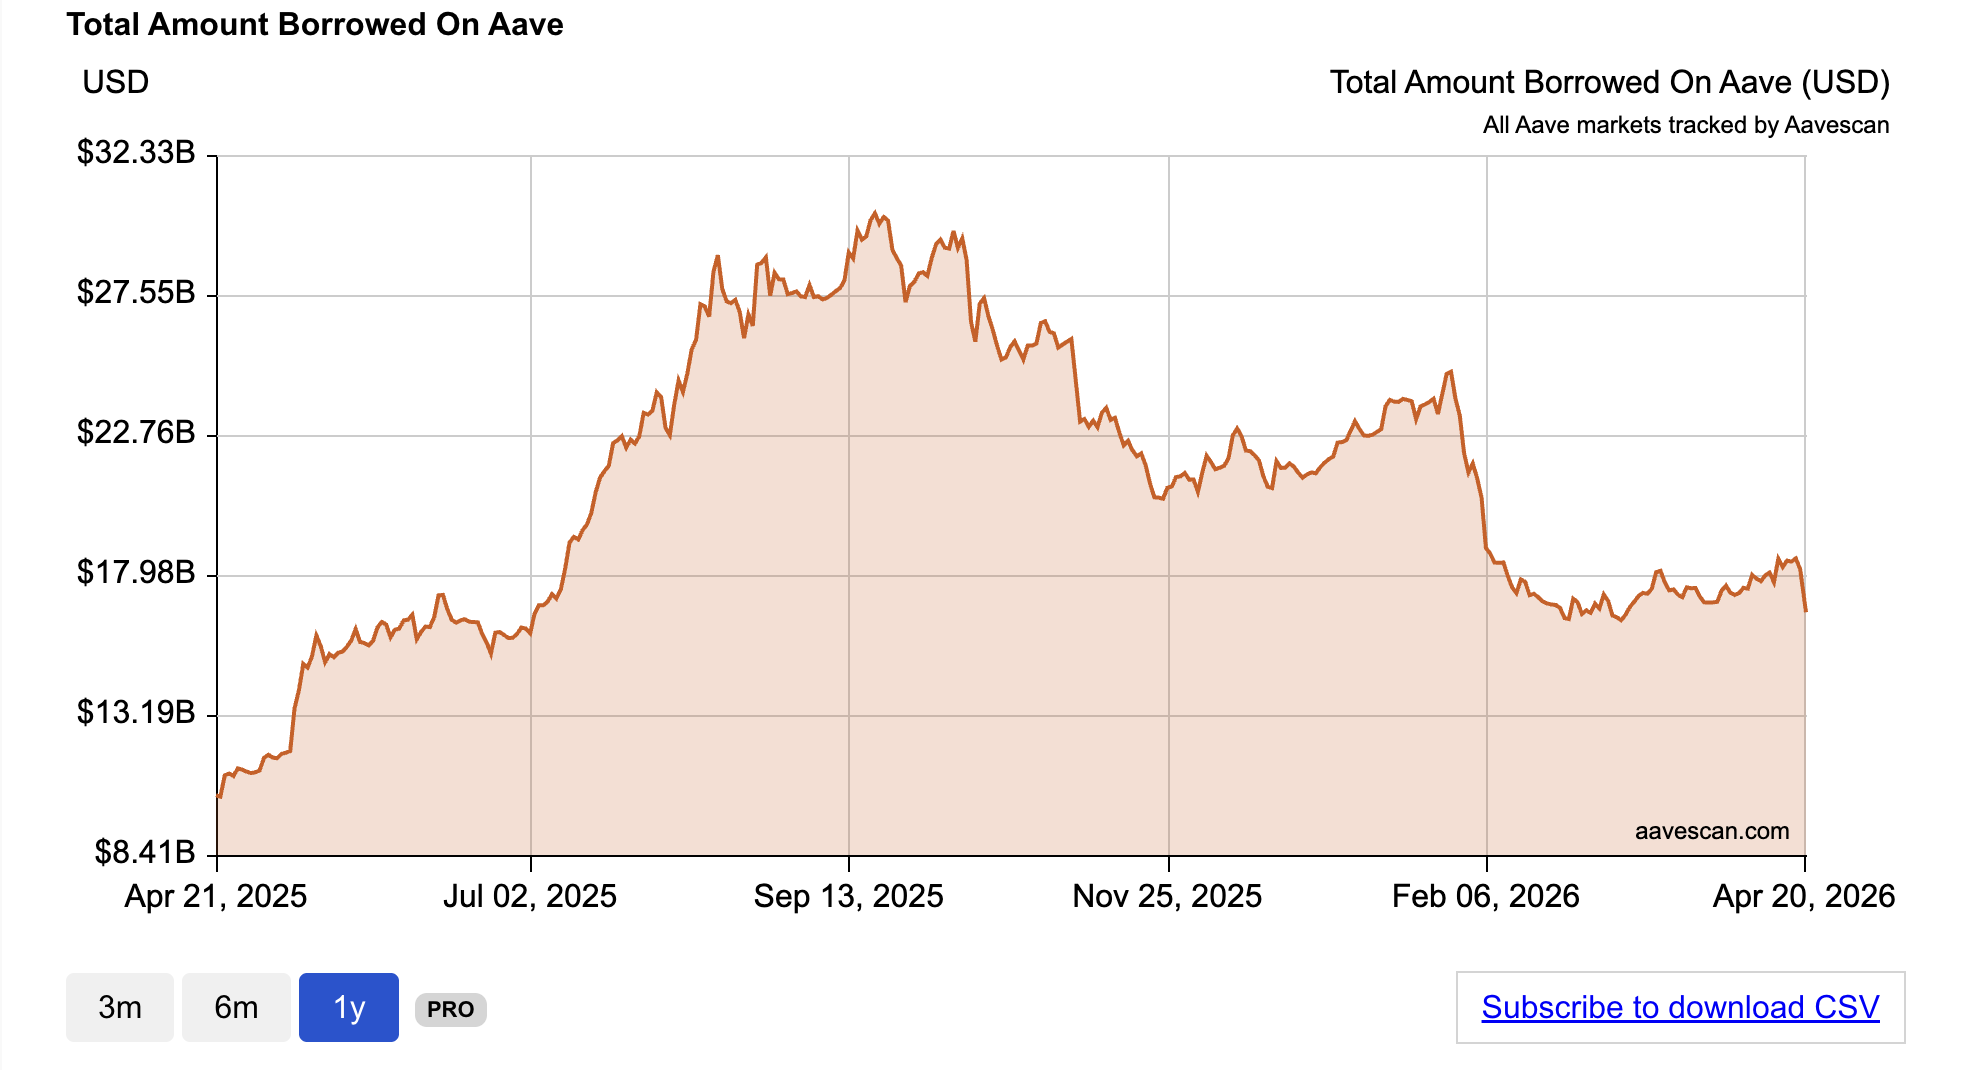
Per data from AaveScan, the protocol has seen a steep decline in the total amount supplied and borrowed since the attack.
The total assets supplied on Aave, which had held relatively stable in the $45 billion range through March and into early April, plummeted on April 18, falling to $35 billion by April 20.
That is an $11 billion dip in supply on the protocol in under 48 hours.
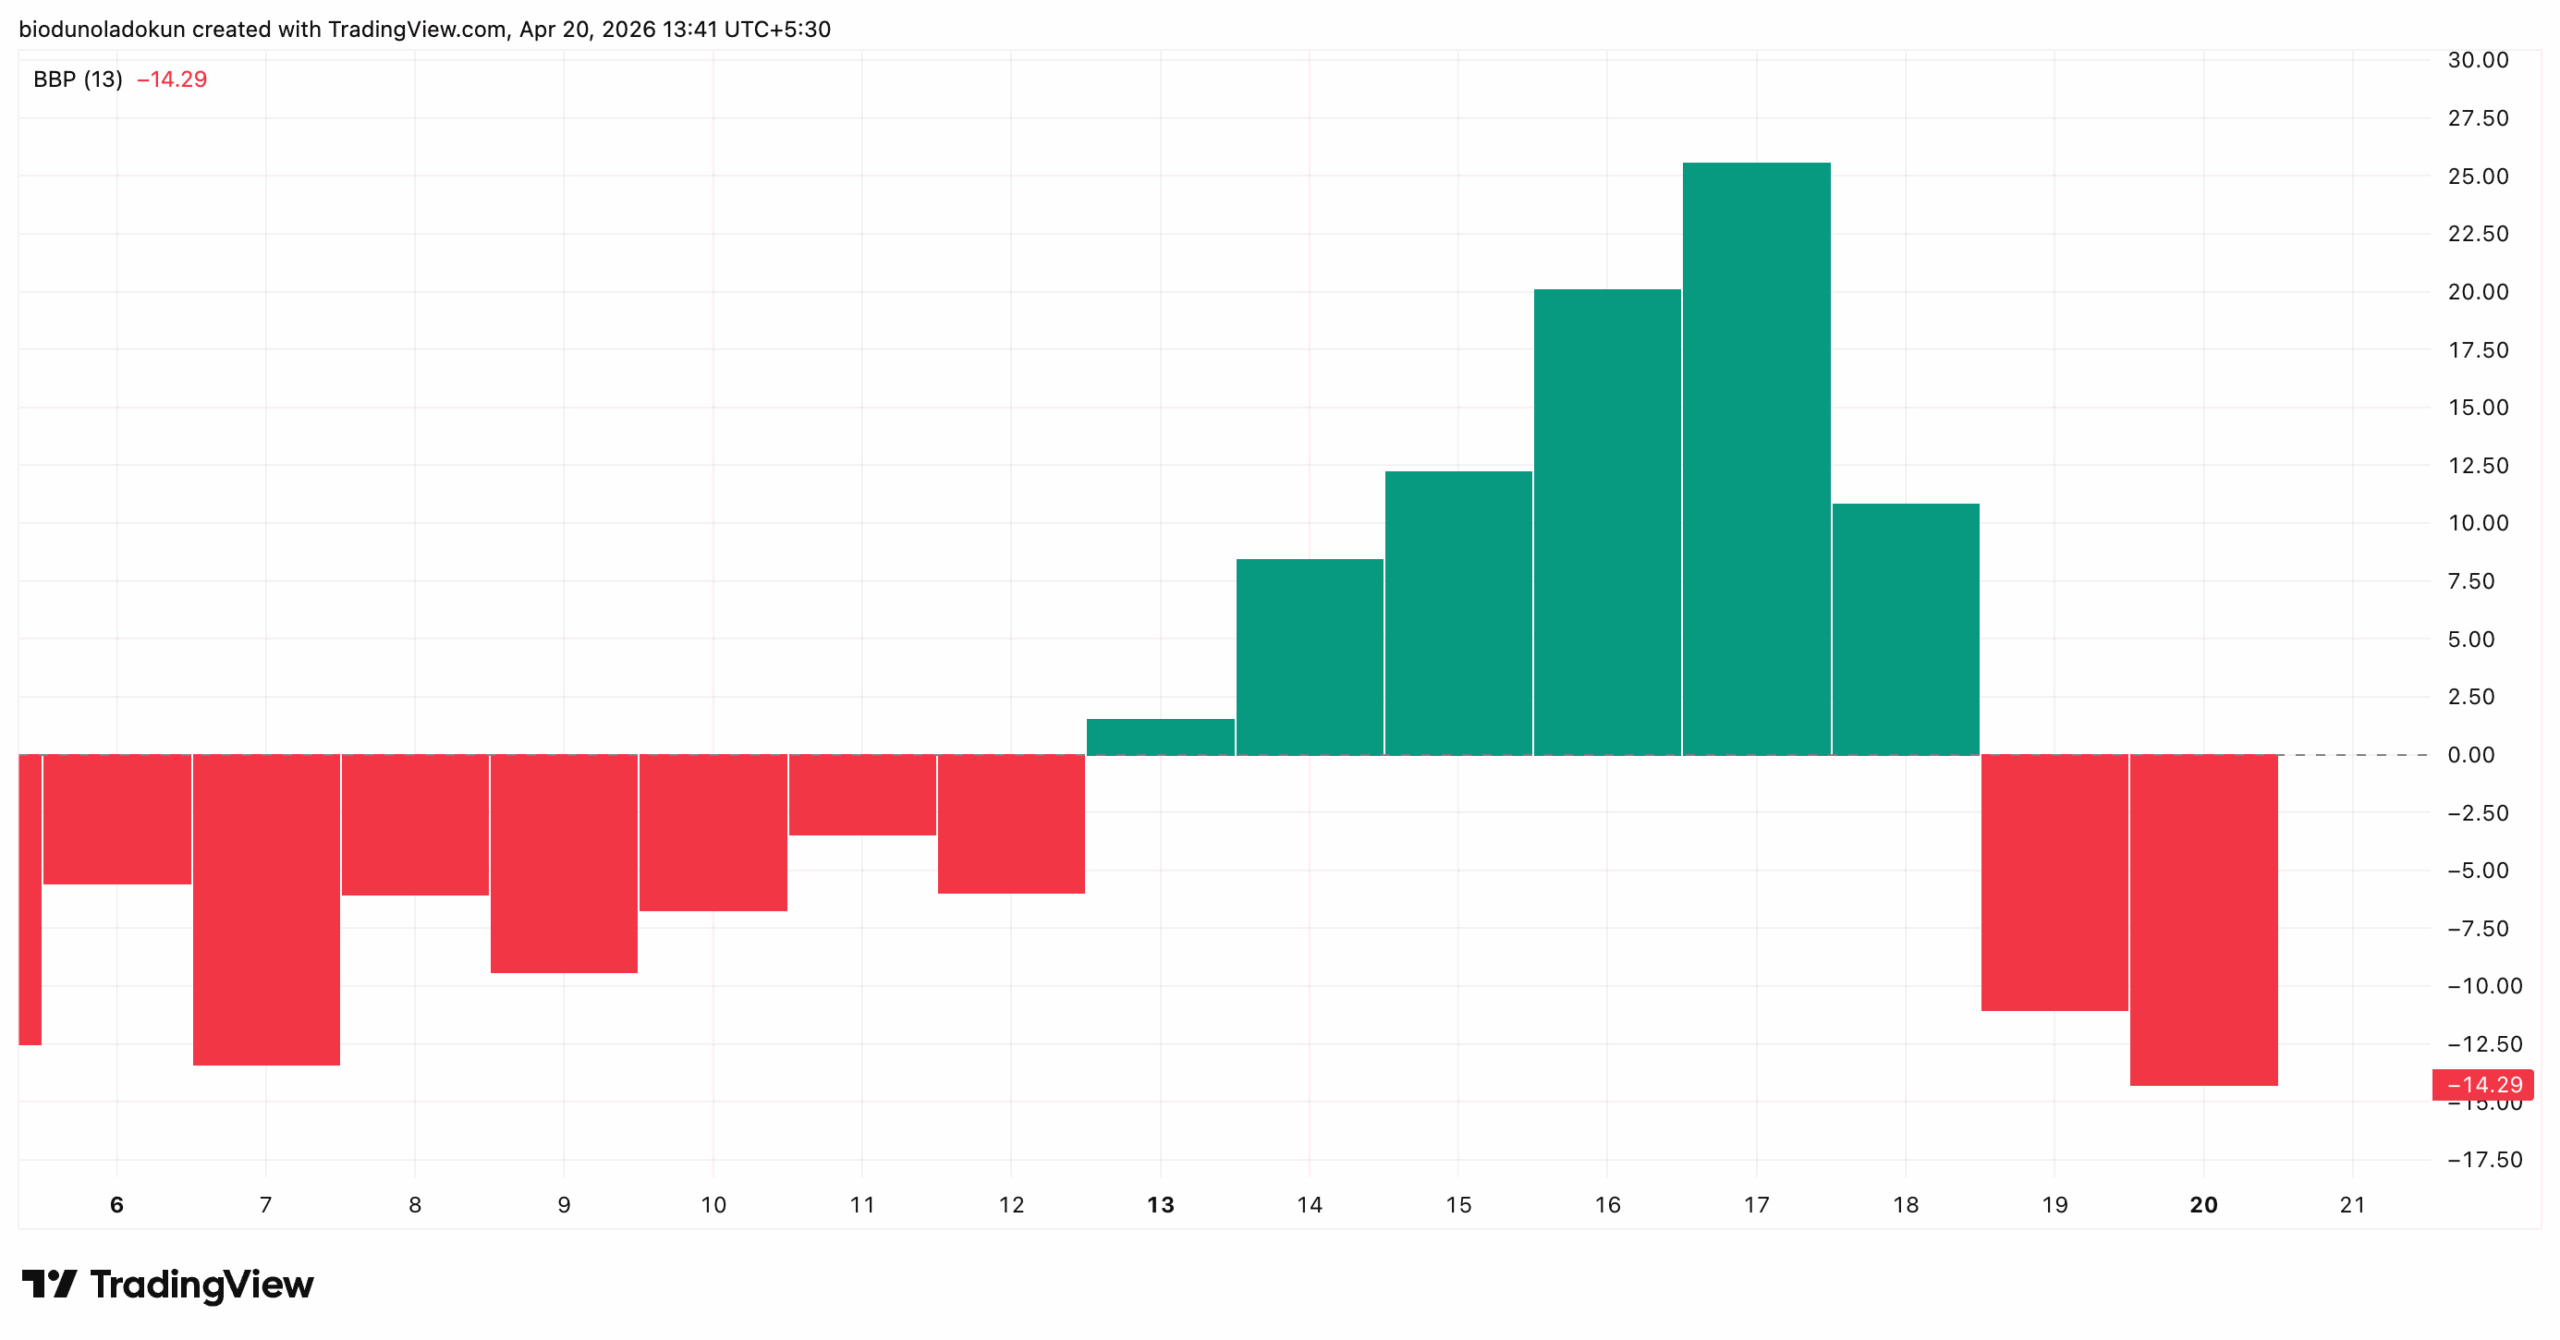
The Elder-Ray Index indicator measures the strength of bulls and bears by comparing buying pressure (Bull Power) and selling pressure (Bear Power).
When the value is negative like this, the market is experiencing more selling pressure than buying, hinting at a potential downtrend.
Since the exploit, this indicator has printed two red bars, erasing six consecutive days of green histogram bars that had built up between April 13 and April 18.
Over the past two sessions, the red bars have grown in size, indicating that the bearish presence is strengthening.
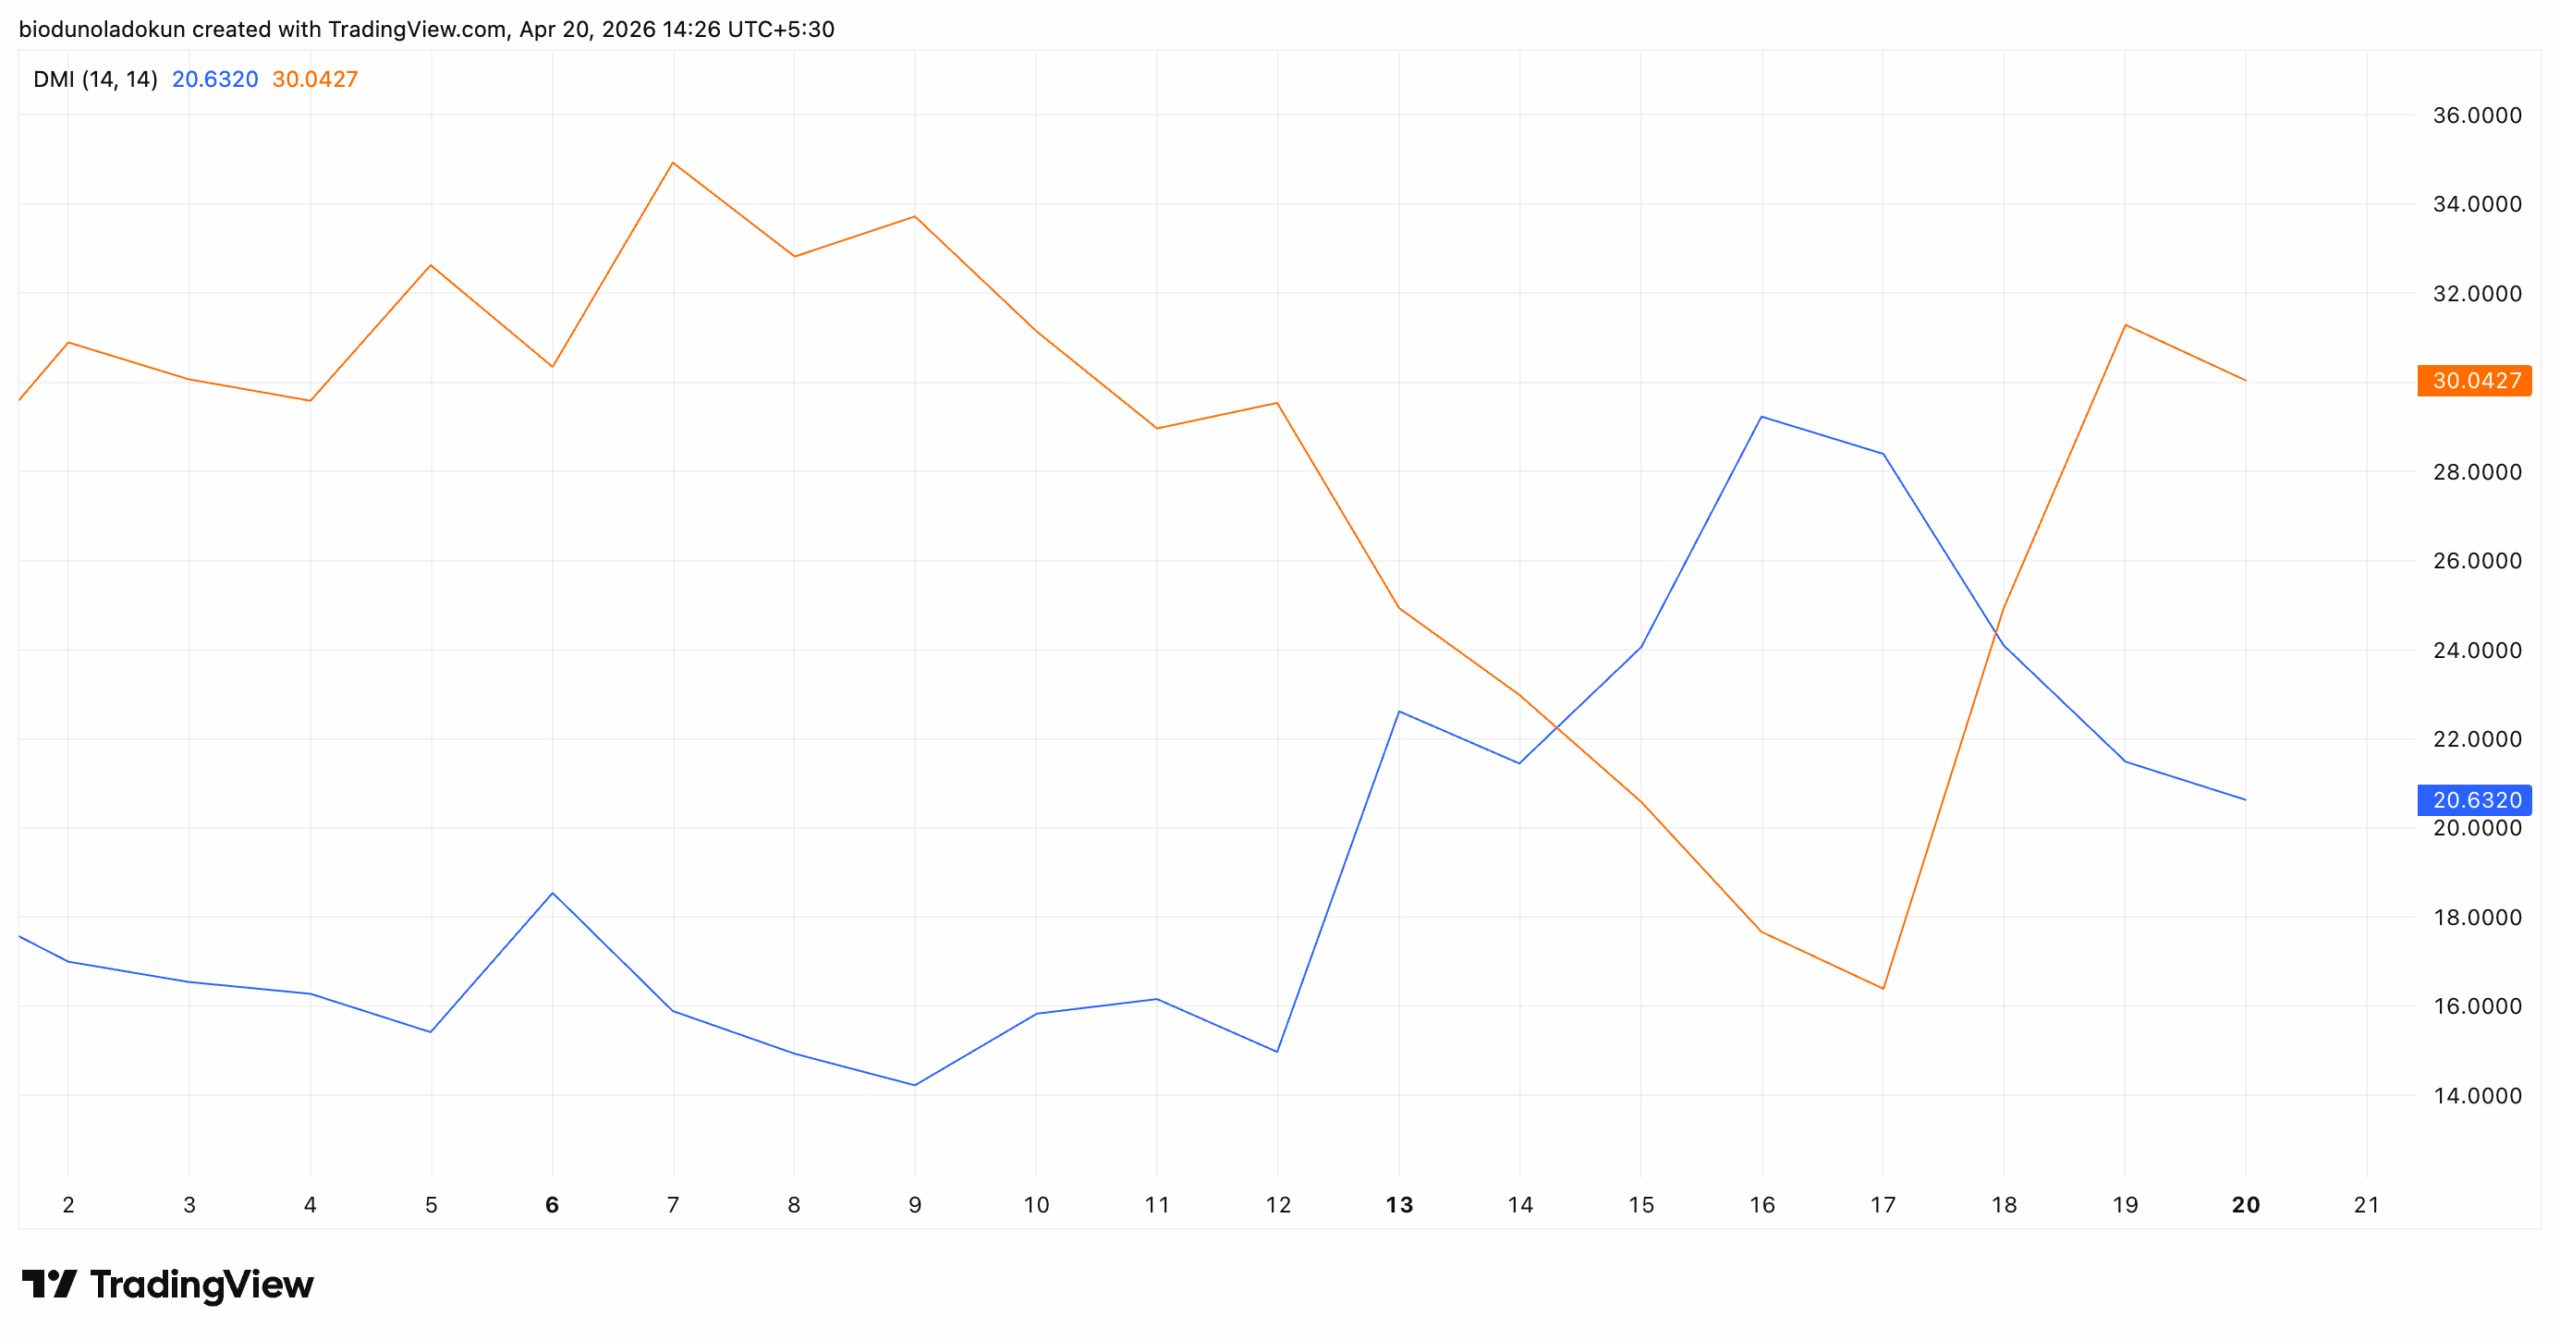
Furthermore, the setup of AAVE’s Directional Movement Index (DMI) supports this bearish stance.
At press time, the token’s positive directional index (+DI, blue) hangs below the negative directional index (-DI, orange).
The DMI indicator measures the strength of an asset’s price trend.
It consists of two lines: the +DI, which represents upward price movement, and the -DI, which represents downward price movement.
When the +DI is under the -DI, as it is with AAVE, downward momentum is dominant, and sellers are in control.
A Glimmer of Hope?
Interestingly, despite the protocol’s falling TVL and waning token value, some investors are treating the drawdown as a buying opportunity.
According to Santiment, large wallets holding between 10,000 and 100,000 AAVE have increased their holdings by 3% since the exploit.
Retail participants tend to treat whale accumulation as a confidence signal, and sustained buying from large holders can gradually shift sentiment and lay the groundwork for a price recovery.
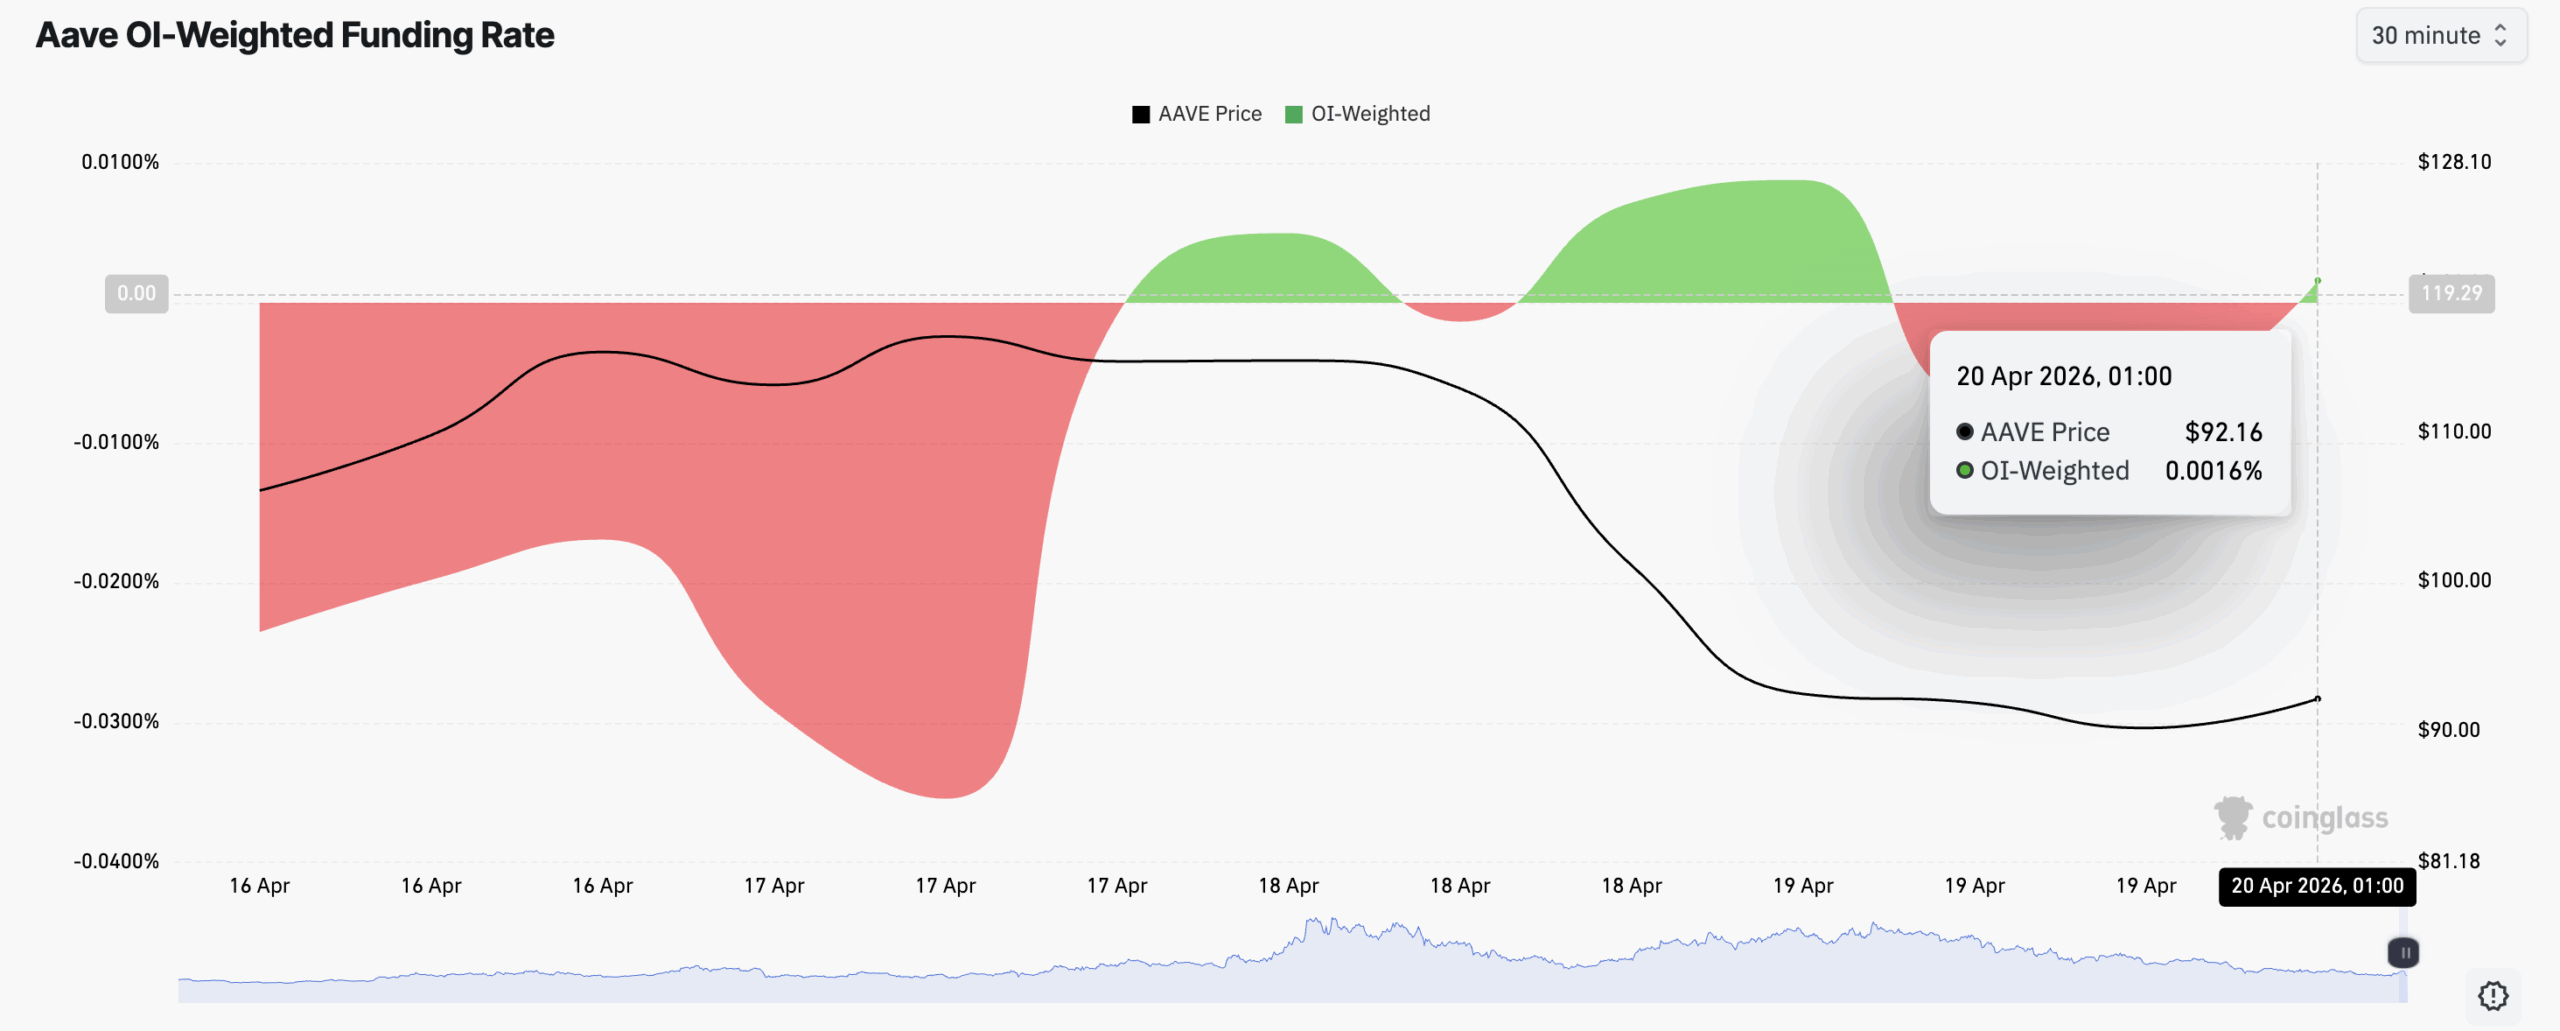
In addition, AAVE’s weighted funding rate has also flipped positive, indicating that a significant segment of its futures market is betting on a recovery. Per Coinglass, this is at 0.0016%.
The funding rate is the periodic payment exchanged between long and short futures contract holders based on the difference between an asset’s spot price and futures price.
When an asset’s funding rate is positive, as it is here, it means long position holders are paying short, indicating a strong bullish bias.
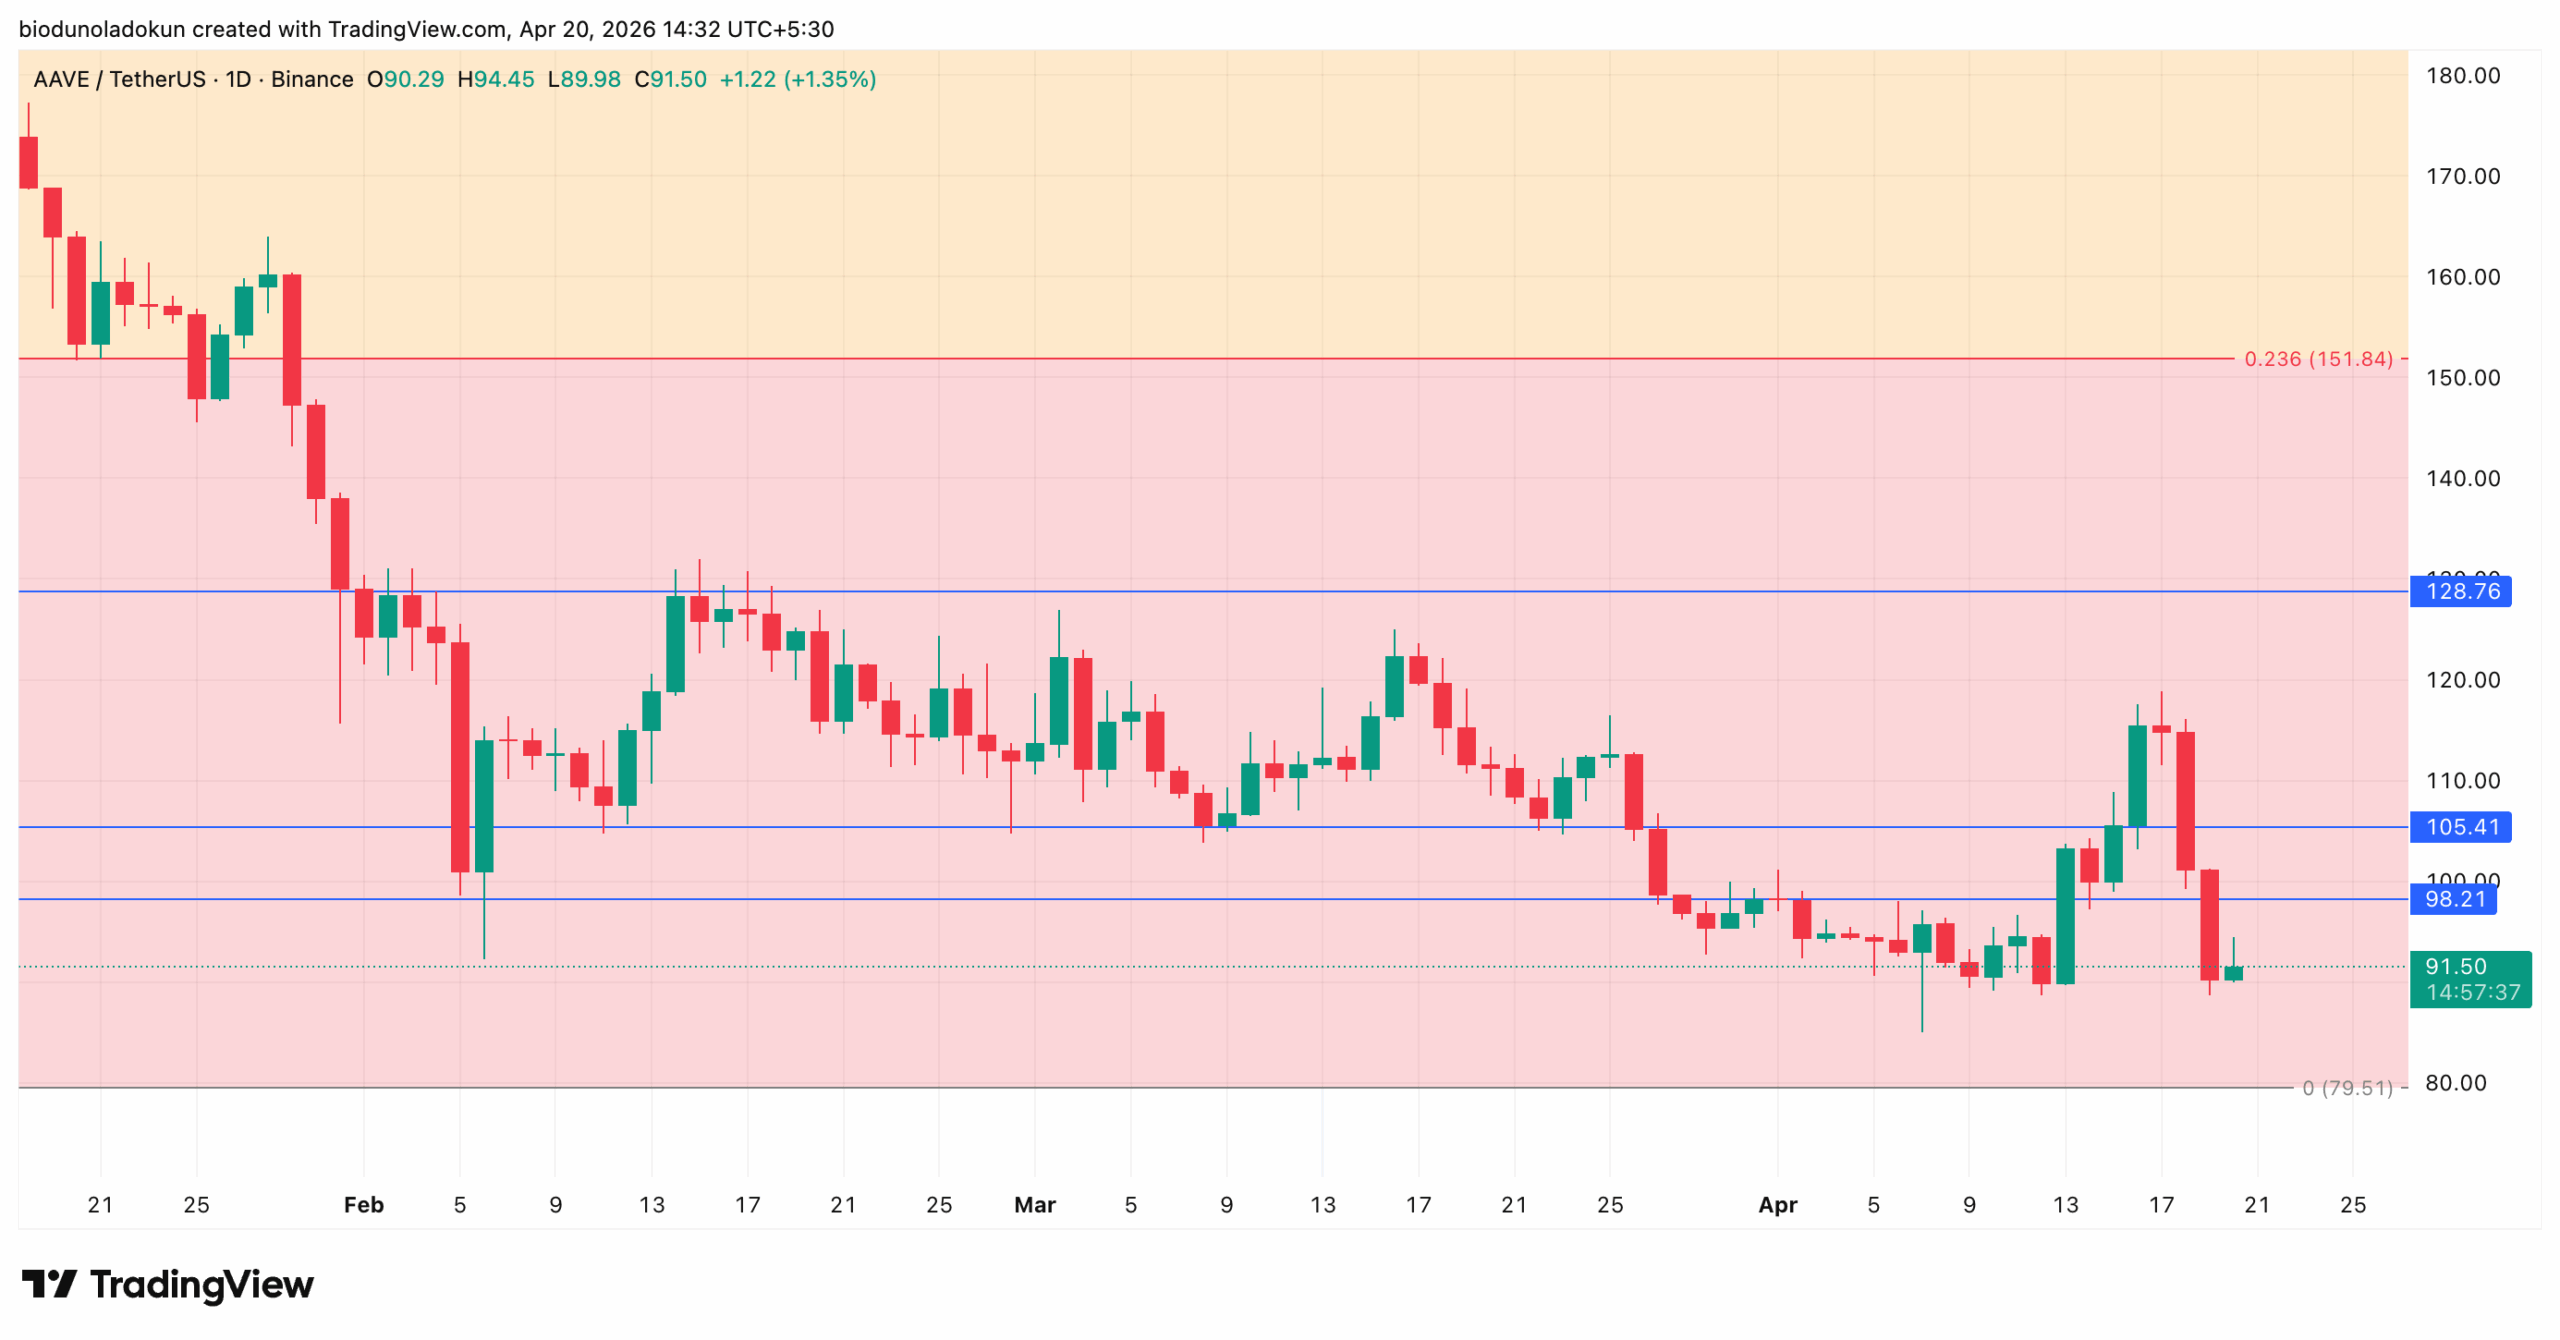
AAVE Eyes 6-Month Low
At press time, AAVE trades at $91.50, hovering just above $79.51. If demand grows poorer, the token could fall toward this six-month low in the near term.
However, a credible resolution from the Aave DAO to address the bad-debt deficit could shift market sentiment.
This may spur new demand in the altcoin and push its price past $98.21.
Disclaimer:
The information provided in this article is for informational purposes only. It is not intended to be, nor should it be construed as, financial advice. We do not make any warranties regarding the completeness, reliability, or accuracy of this information. All investments involve risk, and past performance does not guarantee future results. We recommend consulting a financial advisor before making any investment decisions.
Abiodun Oladokun is a Research Analyst at CCN, where he covers cryptocurrency markets with a focus on on-chain analysis, technical assessments, and emerging trends across decentralized finance (DeFi), real-world assets (RWA), artificial intelligence (AI), decentralized physical infrastructure networks (DePIN), Layer 2s, and meme coins.
Prior to CCN, he served as a Senior On-Chain Analyst at BeInCrypto, producing market reports spanning diverse crypto sectors.
Before that, he conducted technical analysis and market assessments of various altcoins at AMBCrypto, where he also contributed long-form quarterly research papers on DeFi, NFTs, DAOs, and scaling architectures, leveraging on-chain platforms including Messari, Santiment, DefiLlama, and Dune Analytics.
He began his crypto career as a research analyst at SixthSense DAO, developing blockchain forensic tools to trace the history of stolen assets.
Abiodun is a lawyer called to the Nigerian Bar and the founder of Ilé Ijó, a Lagos-based electronic dance music collective.