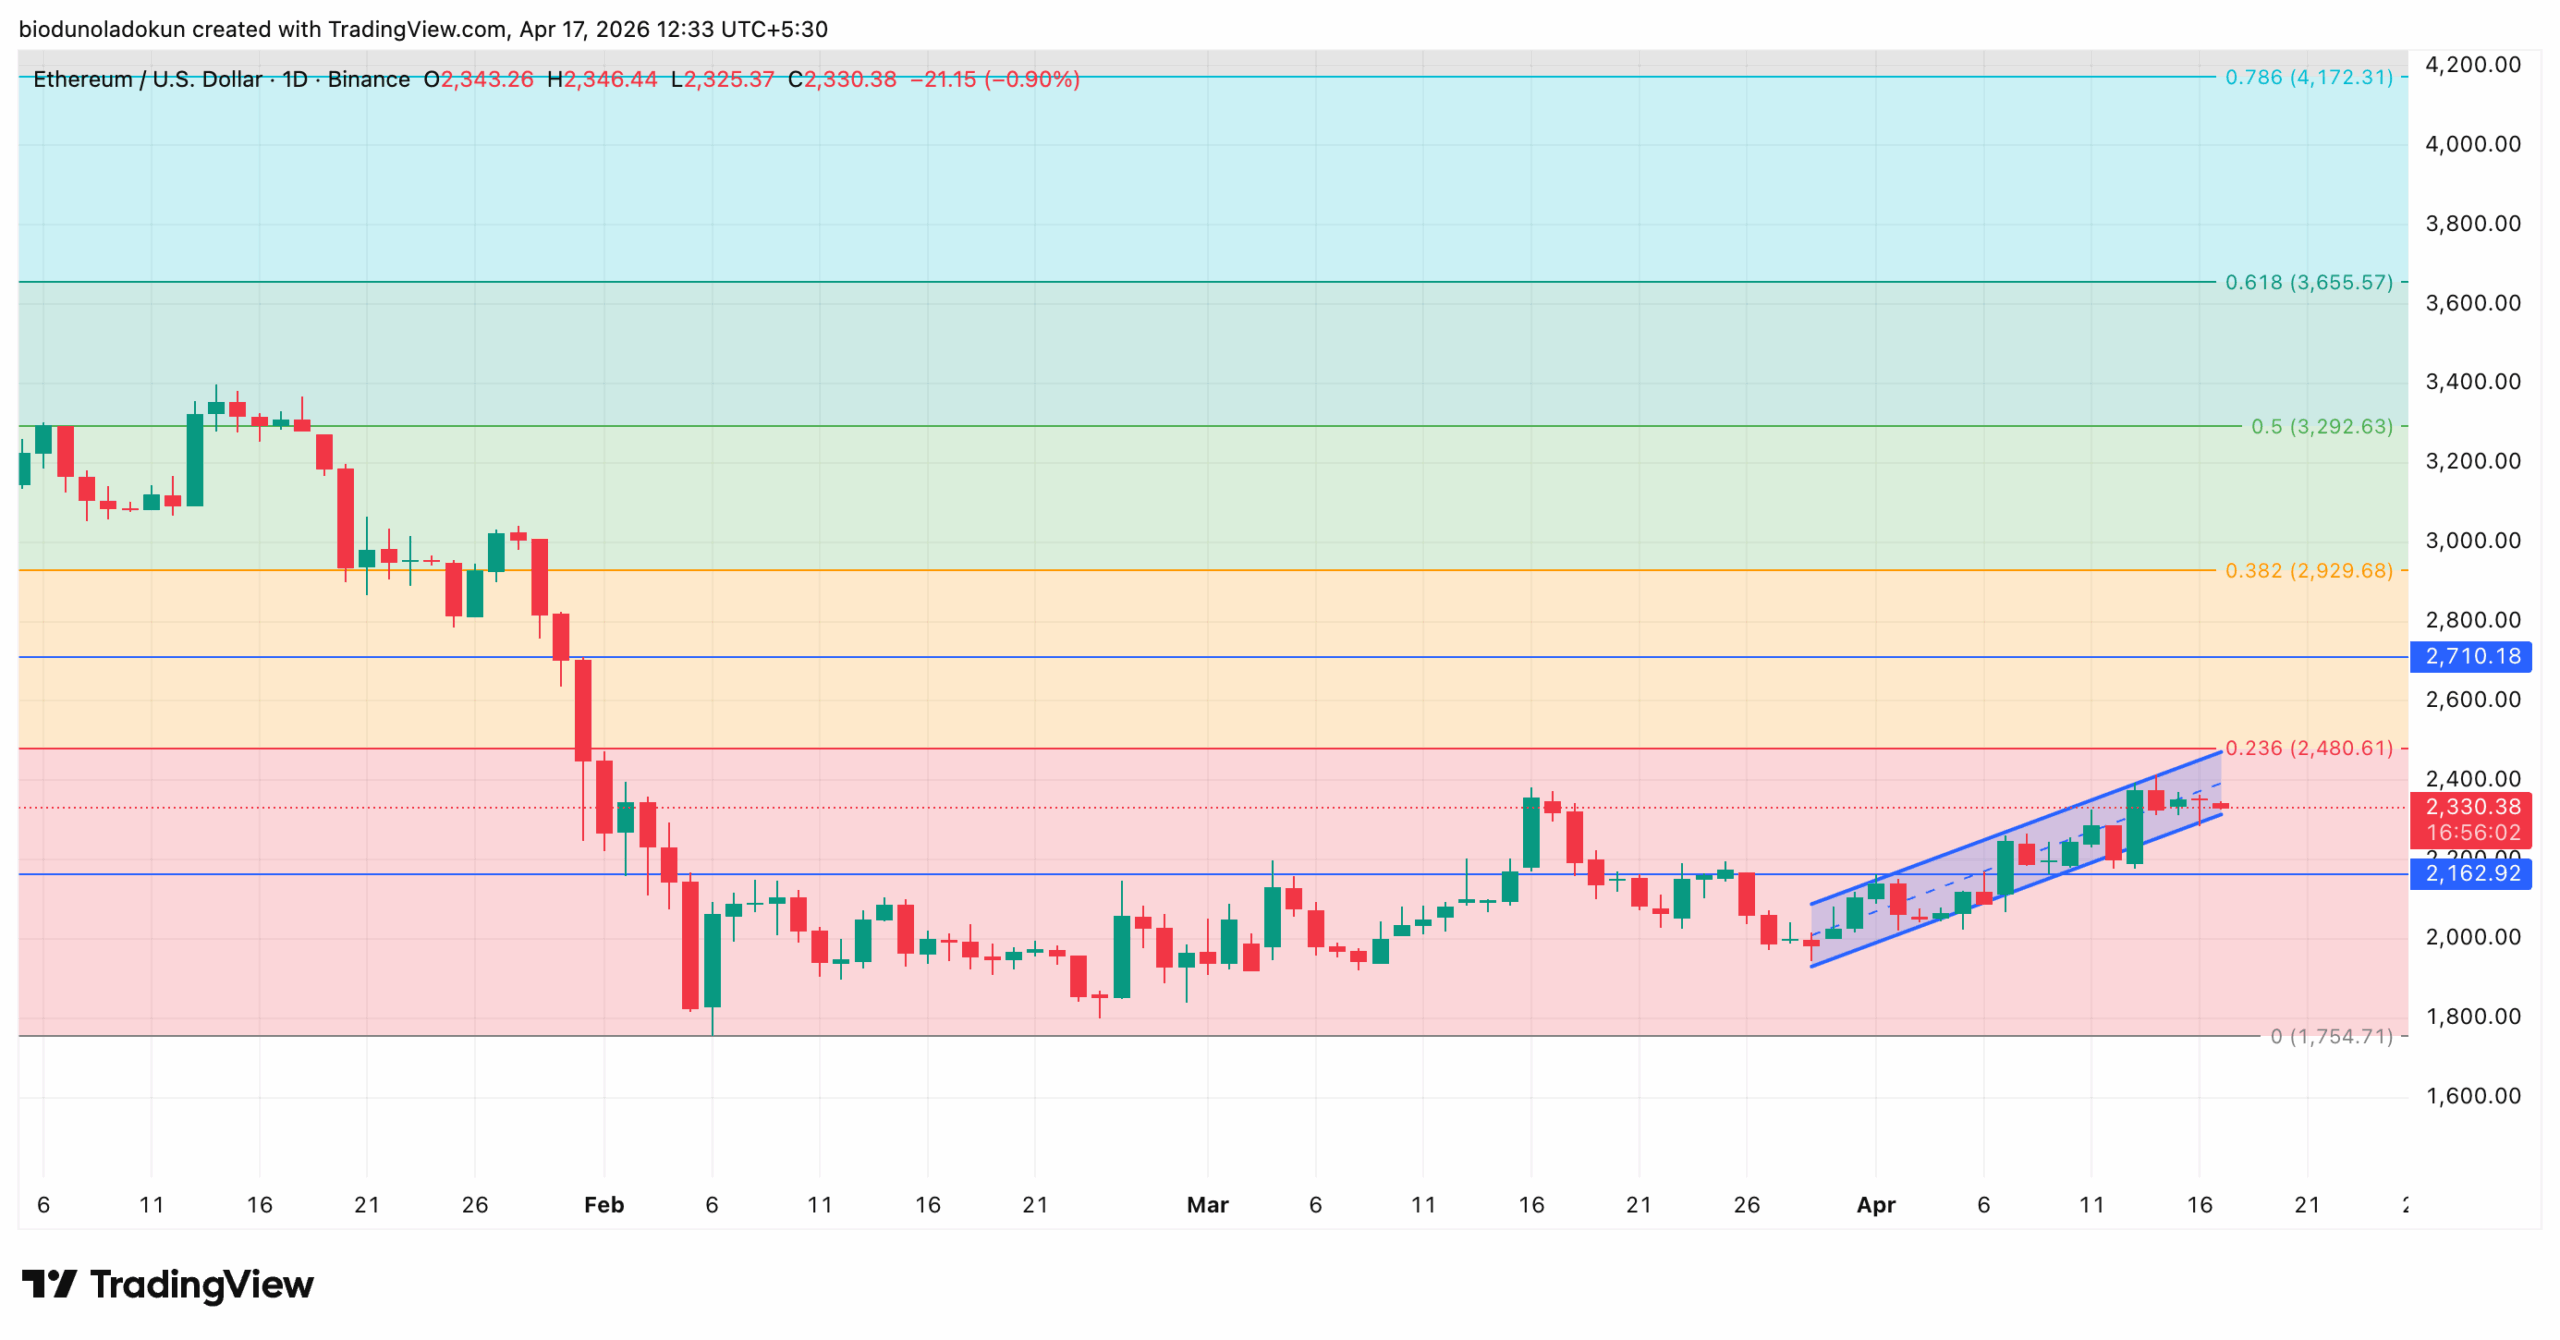
Ethereum has rallied 17% since March 29, trading within an ascending channel as on-chain data signals improving demand. | Credit: CCN.
Share
Key Takeaways
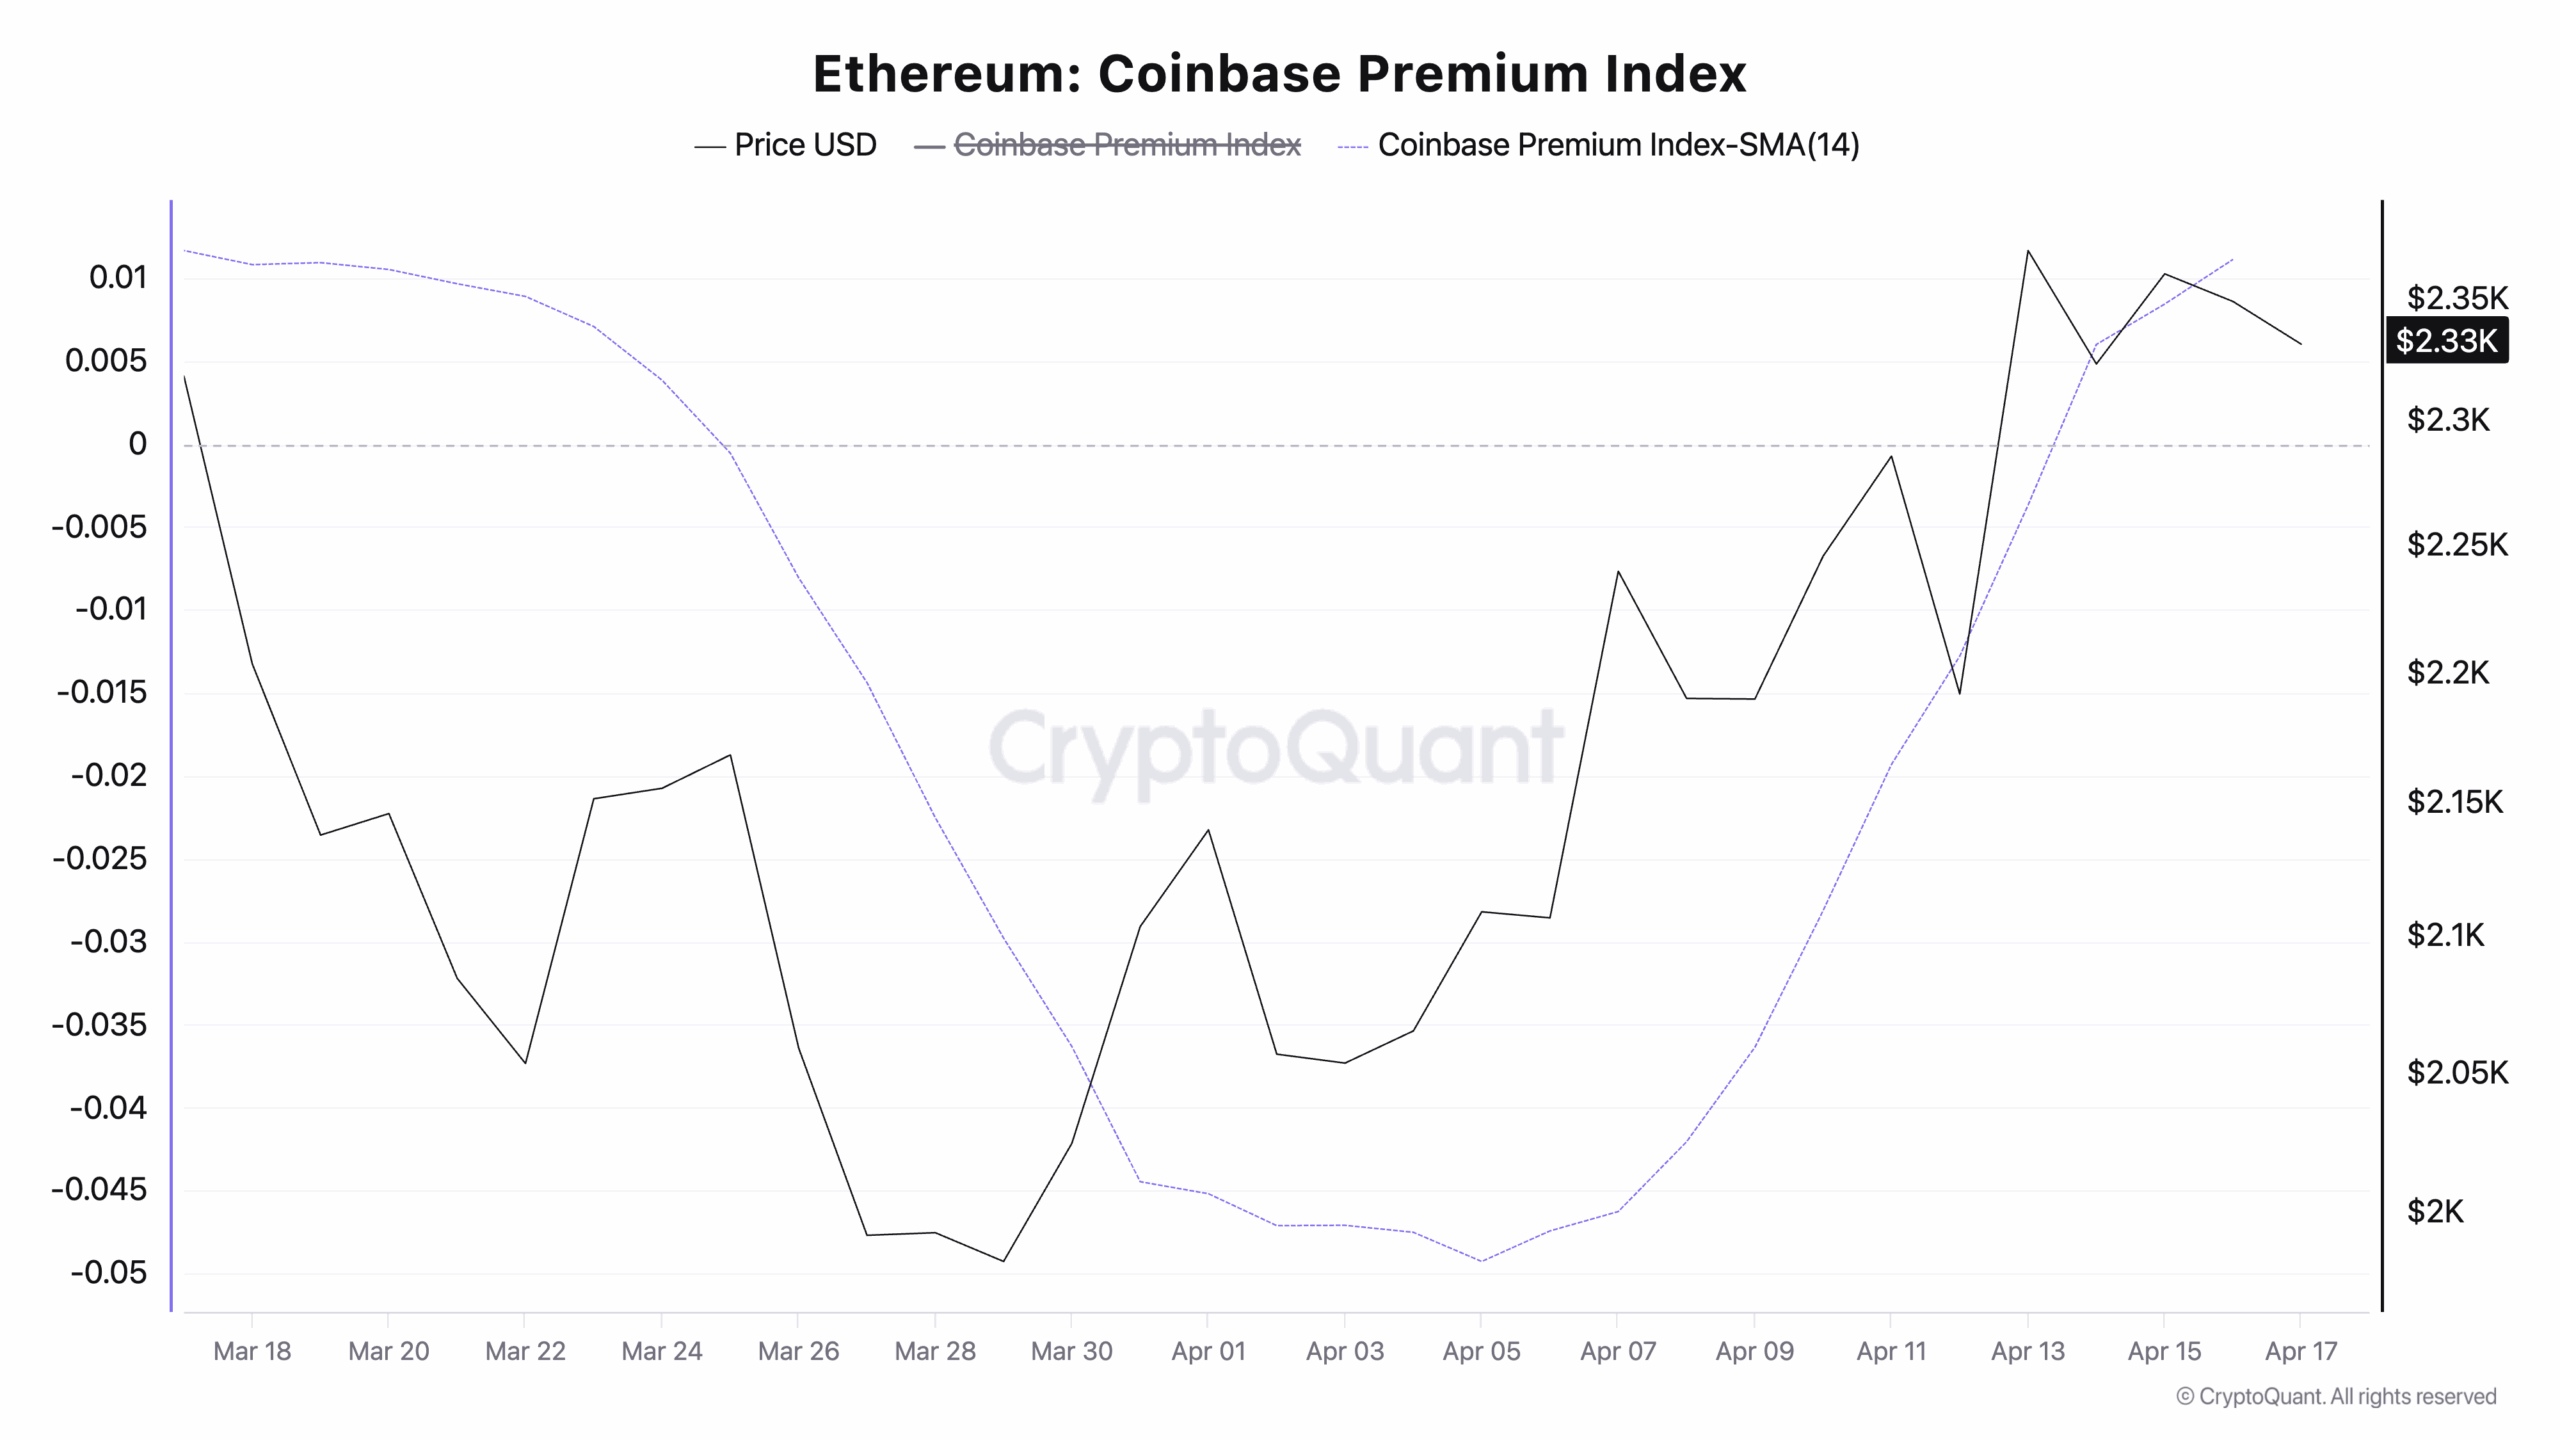
ETH’s Coinbase Premium Index broke above zero on April 14 for the first time since late March, signaling renewed buying interest from US-based investors.
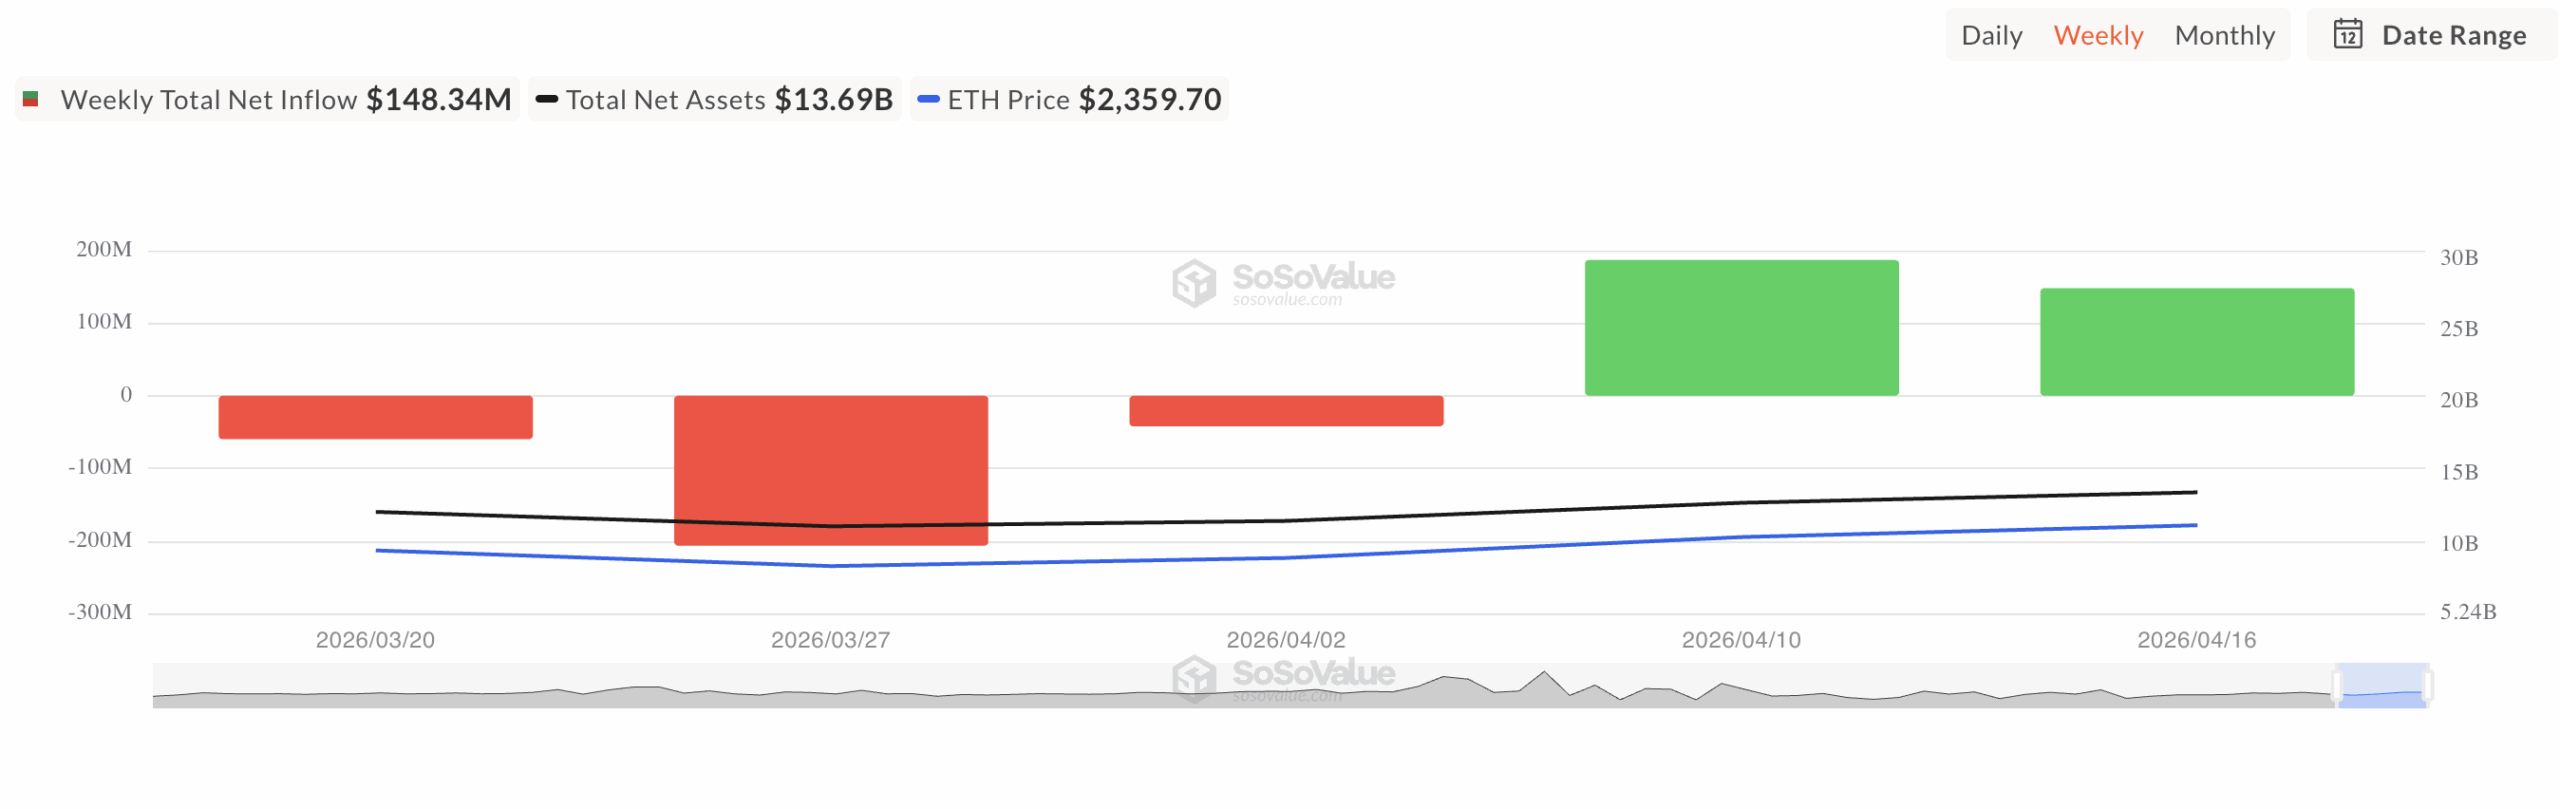
Spot Ethereum ETFs are on track for two consecutive weeks of inflows, reversing three straight weeks of outflows recorded through March.
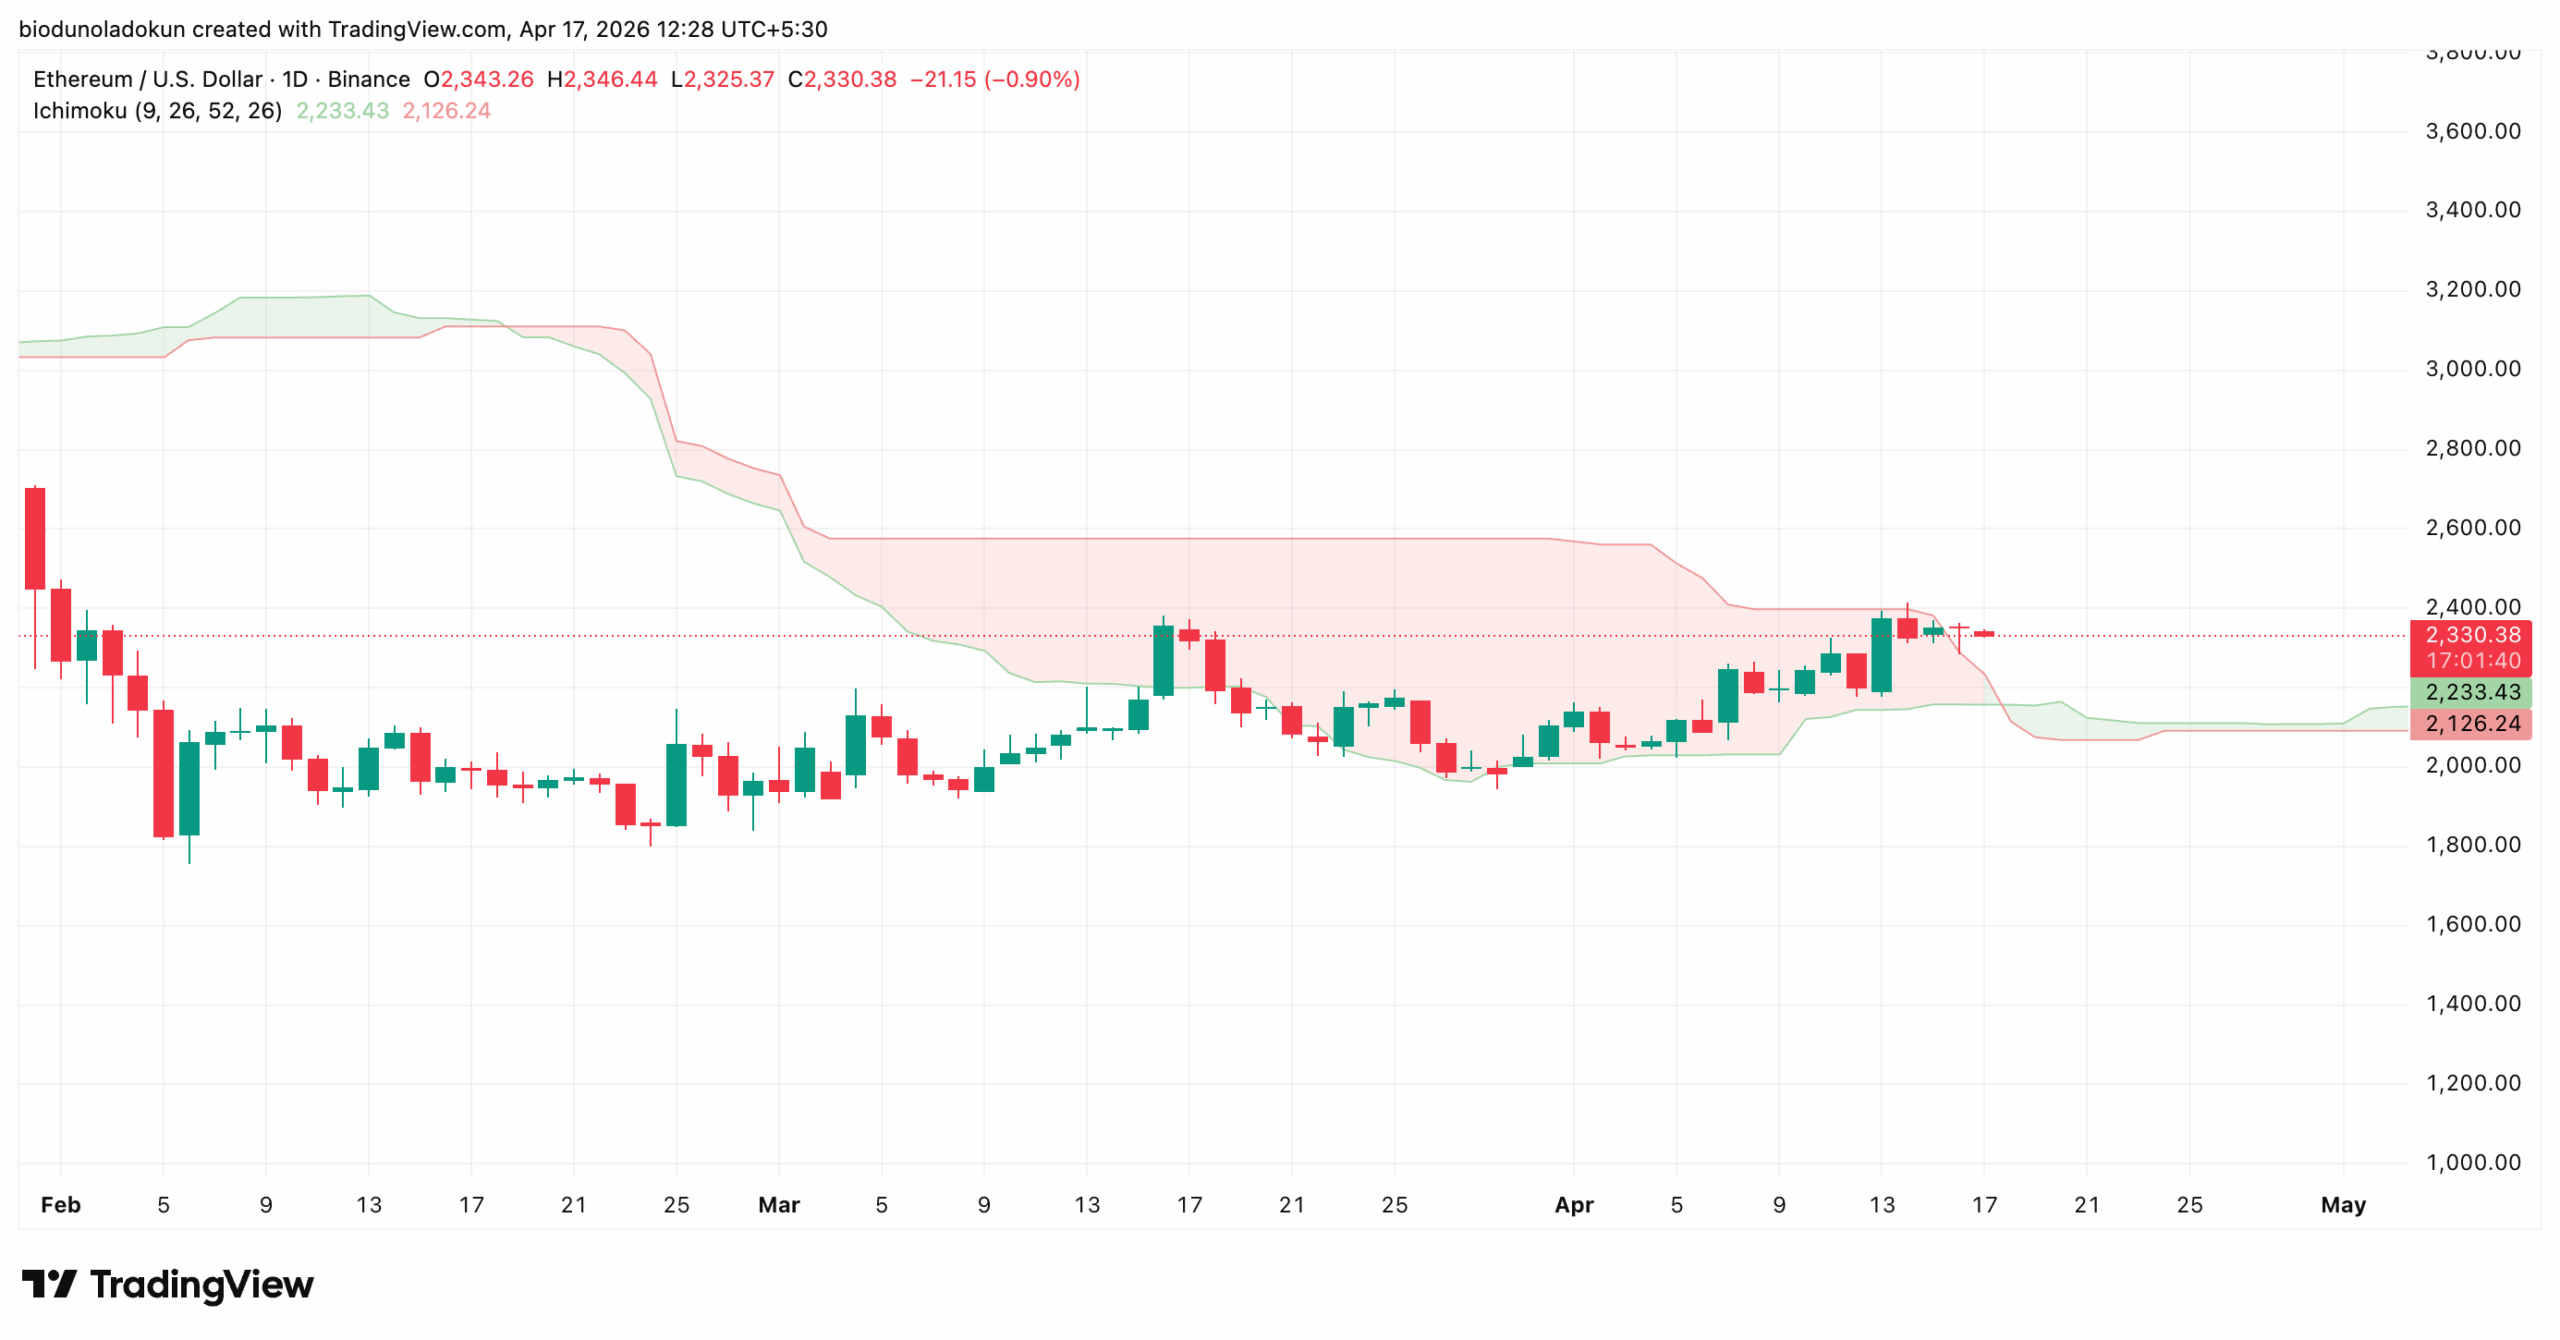
ETH trades above both the Ichimoku Cloud and its Parabolic SAR dots on the daily chart, with $2,480 as the key resistance level to clear on the path to $2,500.
Ethereum has been trending steadily higher since late March, moving within an ascending channel as the broader altcoin market begins to recover.
Sharing a close correlation with Bitcoin, ETH has benefited from BTC’s push past $70,000 and its ability to hold that level over the past two weeks.
Since March 29, ETH’s price has rallied by 17%.
With on-chain data showing a gradual improvement in underlying ETH demand, the altcoin may be on course to extend its near-term gains.
US Investors Are Buying ETH Again
The recent surge in ETH’s Coinbase Premium Index (CPI) above zero is an important signal.
Per CryptoQuant data, the coin’s CPI — assessed using a 14-day simple moving average — broke above the zero line on April 14 and has since climbed.
At press time, it sits at 0.011.
Ethereum Coinbase Premium Index | Credit: CryptoQuant
This metric measures the price difference between ETH on Coinbase and Binance, making it a reliable indicator for tracking US investor sentiment.
Sponsored
Disclosure
We sometimes use affiliate links in our content, when clicking on those we might receive a commission at no extra cost to you. By using this website you agree to our terms and conditions and privacy policy.
When the CPI turns negative, demand on Coinbase lags global markets, a sign of profit-taking or waning interest among US buyers.
On the other hand, when the index rises, ETH trades at a premium on Coinbase compared to international exchanges, reflecting stronger buying pressure from US-based investors.
According to the data provider, ETH’s CPI spent the entire late March in deep negative territory, as its price slid toward the $2,000 level.
With prices beginning to recover since early April, ETH’s CPI has also risen, signaling an uptick in demand in one of the world’s most regulated crypto markets.
Institutional Money Is Flowing Back Into ETH
Further, institutional appetite for ETH has also grown meaningfully since the start of April, as reflected in the coin’s spot ETF flow data.
According to SoSoValue, inflows into these investment vehicles have totaled $148.34 million so far this week, with total net assets across ETH spot ETFs now sitting at $13.69 billion.
Total Ethereum Spot ETF Net Inflow | Credit: SosoValue
This puts ETH spot ETF flows on course to record two consecutive weeks of inflows, marking a reversal following three straight weeks of outflows through March, when ETH struggled below $2,000.
The timing of this is also important as it aligns with ETH’s 5% price rally this week.
Rising inflows alongside a price uptick suggest that institutional participants are actively positioning into the rally.
It reflects bullish conviction and may help push ETH’s value higher in the near term.
ETH’s Chart Is Printing a Bullish Setup
ETH’s near-10% rally over the past two weeks has now pushed its price above the Ichimoku Cloud on the daily chart.
At press time, the altcoin trades above the Leading Spans A and B of this key indicator, which currently have formed dynamic support levels at $2,233 and $2,126, respectively.
For context, ETH was hovering around $2,327 at the time of writing.
The Ichimoku Cloud tracks the momentum of an asset’s market trends and identifies potential support and resistance levels.
When an asset trades under this cloud, bearish forces are in control. In this scenario, the cloud acts as a resistance ceiling, pushing prices lower.
On the other hand, when an asset’s price is above the cloud, it is a bullish signal, with the cloud then acting as a dynamic support level that absorbs selling pressure during pullbacks.
For ETH, trading above the cloud confirms that buyers are firmly in control of near-term momentum.
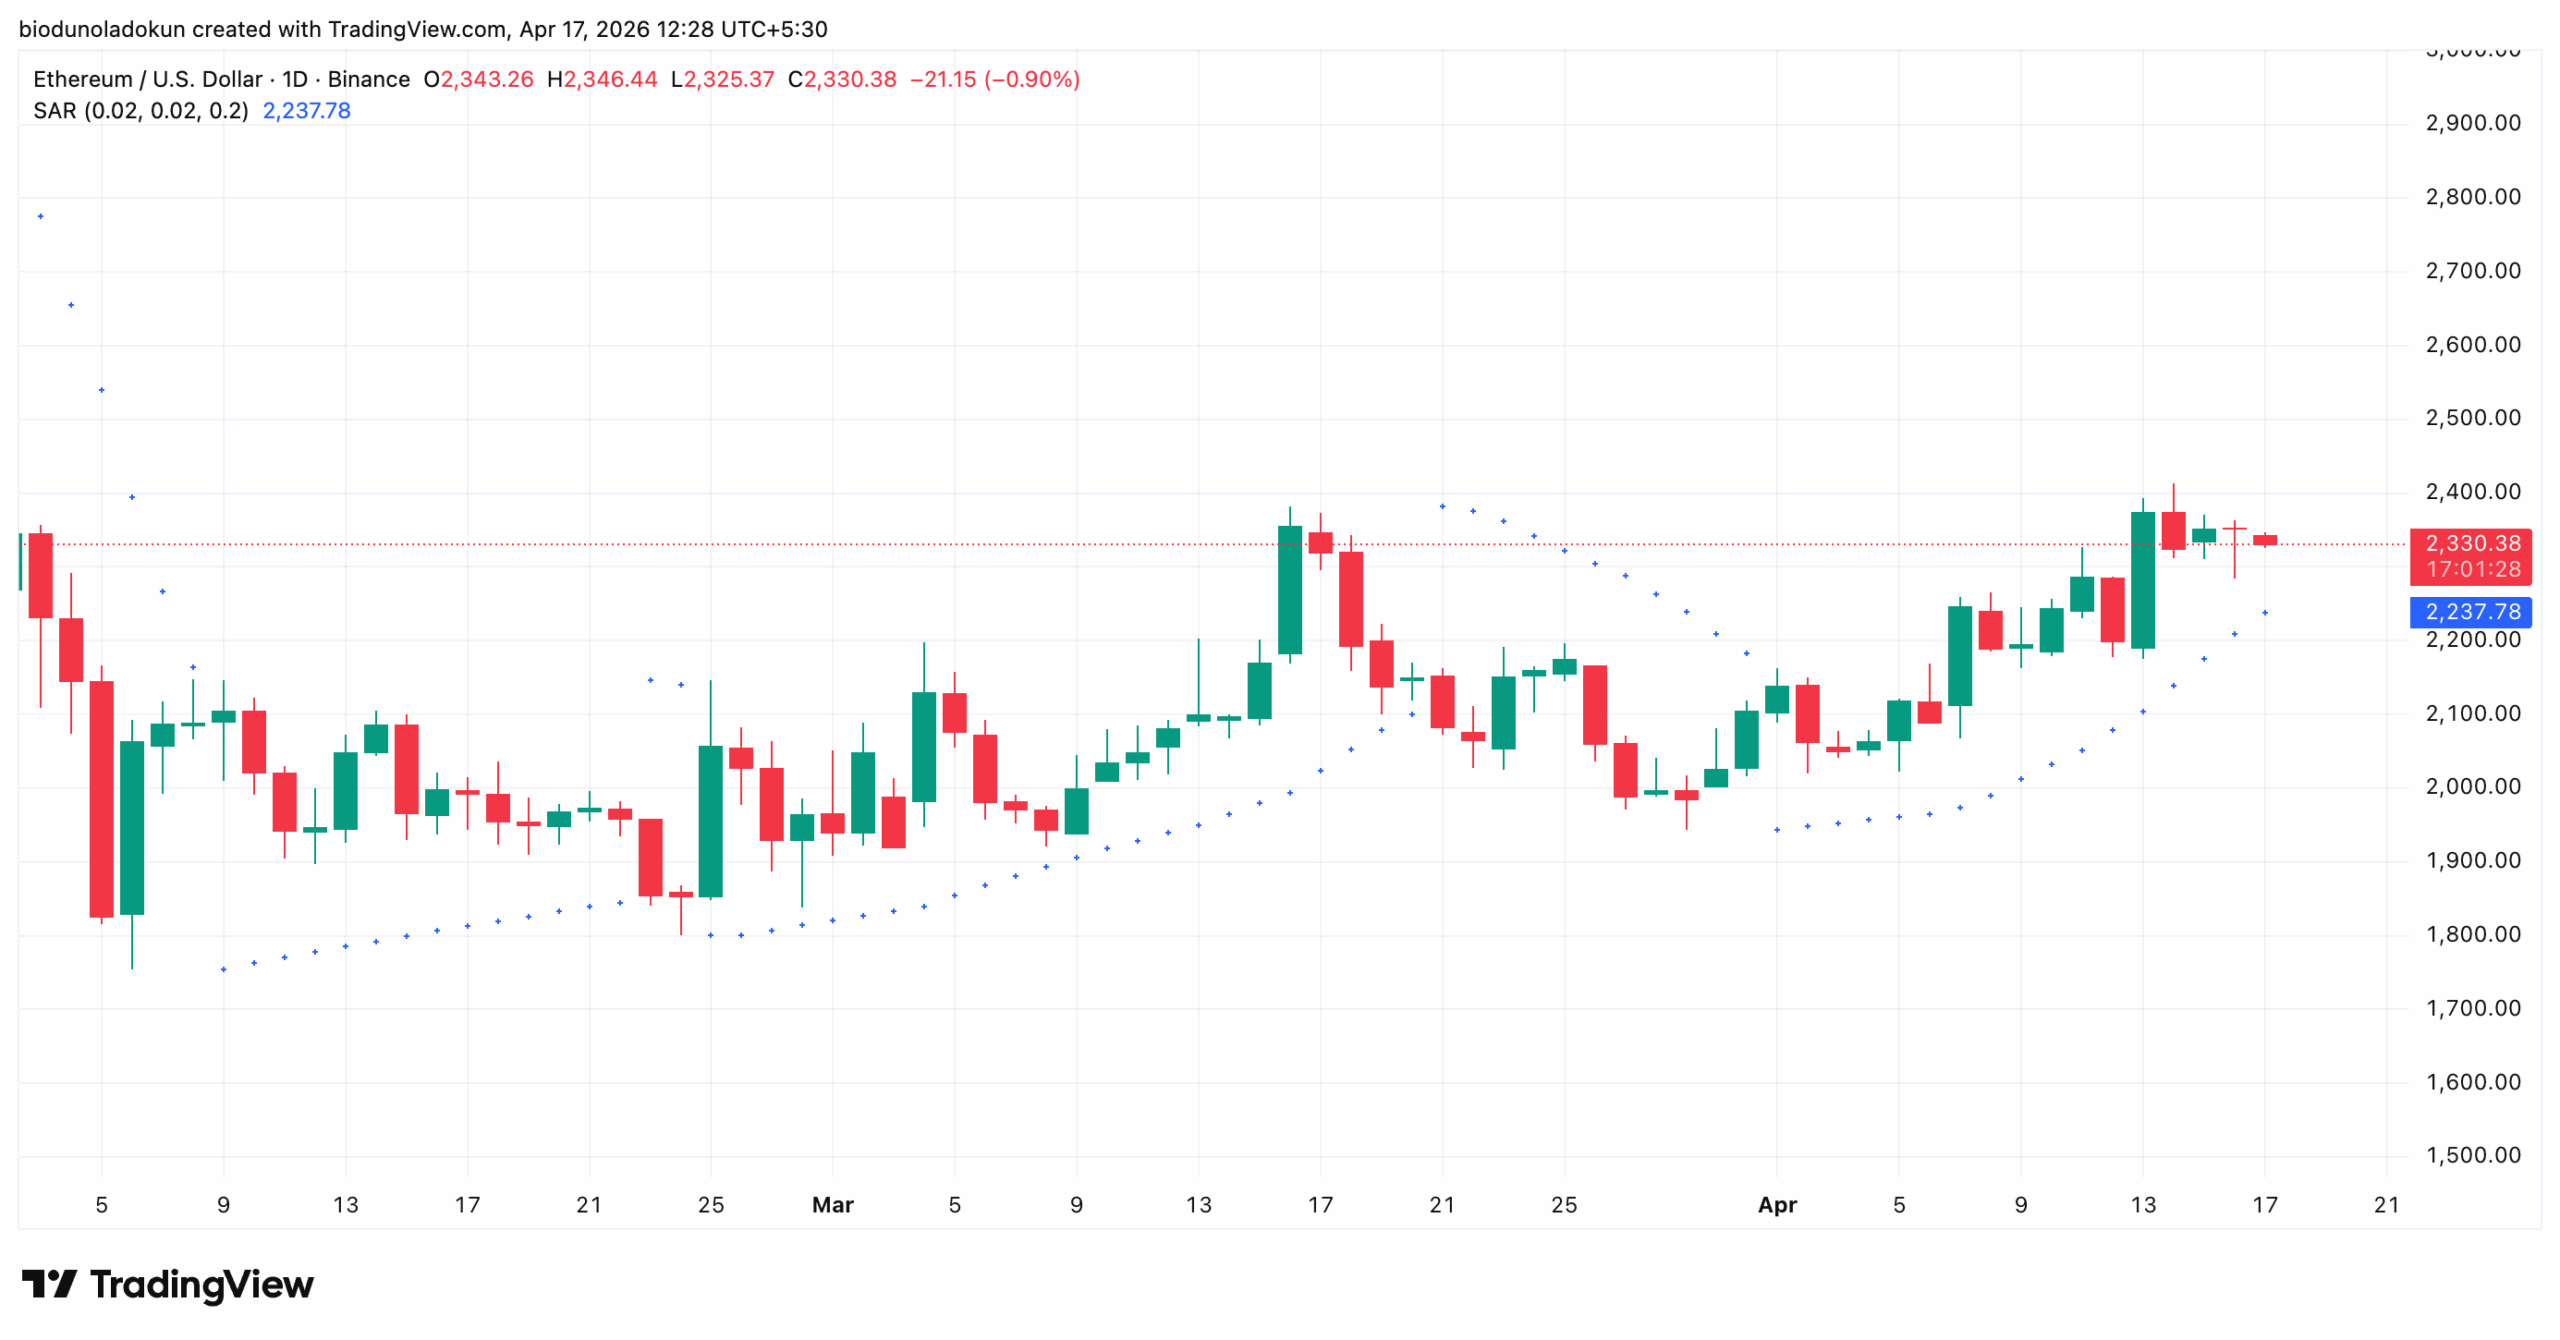
In addition, since the rally began two weeks ago, ETH has traded above the dots of its Parabolic Stop and Reverse (SAR) indicator, a setup that hints at further price rallies.
The Parabolic SAR indicator identifies an asset’s potential trend direction and reversals.
When its dots are placed above an asset’s price, the market is in a downtrend. It confirms that price is declining, and the trend could continue if buying activity remains low.
Conversely, as with ETH, when the dots appear below the price, it signals that bullish momentum is in control and that the move higher could extend if buying pressure remains sustained.
$2,500 In Sight — But One Level Stands In The Way
If the bullish sentiment shift holds and new demand continues to enter the ETH market, the asset could maintain its rally within the ascending channel and attempt to push above the key resistance at $2,480.
A successful daily close above that level would open the door to $2,500 and potentially beyond, with the next significant resistance sitting at $2,710.
On the other hand, if bullish momentum stalls and selling pressure returns, ETH risks a pullback below the lower boundary of the ascending channel, with its next support around $2,162.
A breakdown below that level would invalidate the current bullish structure and bring the $2,000 psychological support back into focus.
Disclaimer:
The information provided in this article is for informational purposes only. It is not intended to be, nor should it be construed as, financial advice. We do not make any warranties regarding the completeness, reliability, or accuracy of this information. All investments involve risk, and past performance does not guarantee future results. We recommend consulting a financial advisor before making any investment decisions.
Abiodun Oladokun is a Research Analyst at CCN, where he covers cryptocurrency markets with a focus on on-chain analysis, technical assessments, and emerging trends across decentralized finance (DeFi), real-world assets (RWA), artificial intelligence (AI), decentralized physical infrastructure networks (DePIN), Layer 2s, and meme coins.
Prior to CCN, he served as a Senior On-Chain Analyst at BeInCrypto, producing market reports spanning diverse crypto sectors.
Before that, he conducted technical analysis and market assessments of various altcoins at AMBCrypto, where he also contributed long-form quarterly research papers on DeFi, NFTs, DAOs, and scaling architectures, leveraging on-chain platforms including Messari, Santiment, DefiLlama, and Dune Analytics.
He began his crypto career as a research analyst at SixthSense DAO, developing blockchain forensic tools to trace the history of stolen assets.
Abiodun is a lawyer called to the Nigerian Bar and the founder of Ilé Ijó, a Lagos-based electronic dance music collective.