Meet the Top 101 in Crypto

Can ETH Break and Hold $1.85K? Analysts Say This Resistance Will Decide the Next Major Move

Published 15 July 2026
Giuseppe Ciccomascolo
Authors

Key Takeaways

  • Ethereum is approaching a critical resistance zone at $1,850, with analysts viewing it as the level that will determine whether ETH can extend its recovery.
  • Technical momentum is improving, as ETH continues to form higher lows and the RSI has recovered above 50.
  • The $1,785–$1,790 VWAP cluster has become a key battleground, representing recent fair value where buyers and sellers remain evenly matched.

Ethereum is once again approaching one of its most important technical levels of 2026, with analysts increasingly focused on whether the second-largest cryptocurrency can finally break through the stubborn $1,850 resistance zone.

After recovering from its retracement toward $1,500, ETH has steadily rebuilt momentum, forming higher lows across multiple timeframes. While the broader trend remains cautious, improving technical indicators and easing selling pressure suggest buyers are gradually regaining confidence.

However, analysts argue that the next major move will depend almost entirely on whether Ethereum can establish itself above $1,850.

Until then, the market remains locked in a consolidation phase with both bulls and bears waiting for confirmation.

Try Our Recommended Crypto Exchanges
Sponsored
Disclosure
Opened in 2018
Promotions
Deposit $100, Get an Extra $300 in GOLD!
Coins
Shiba Inu Bitcoin PAX Gold Ampleforth Ethereum +70
Promotions
Receive up to $100,000 worth of exclusive gifts for newcomers upon registration.
Coins
Bitcoin Ethereum Tether USD Coin Solana +76
Opened in 2017
Promotions
Experience a 1-minute swap on a non-custodial platform.
Coins
Bitcoin Ethereum Tether Build'N'Build USD Coin +217
Show More

Why the $1,850 resistance is so important

Ethereum has spent the past several weeks recovering from the sharp correction that followed its May rally toward $2,400.

On the daily chart, ETH successfully broke above a long-term descending channel before retracing to the $1,500 demand zone, where buyers aggressively stepped back into the market.

That recovery has now brought price directly into the $1,800-$1,850 resistance area.

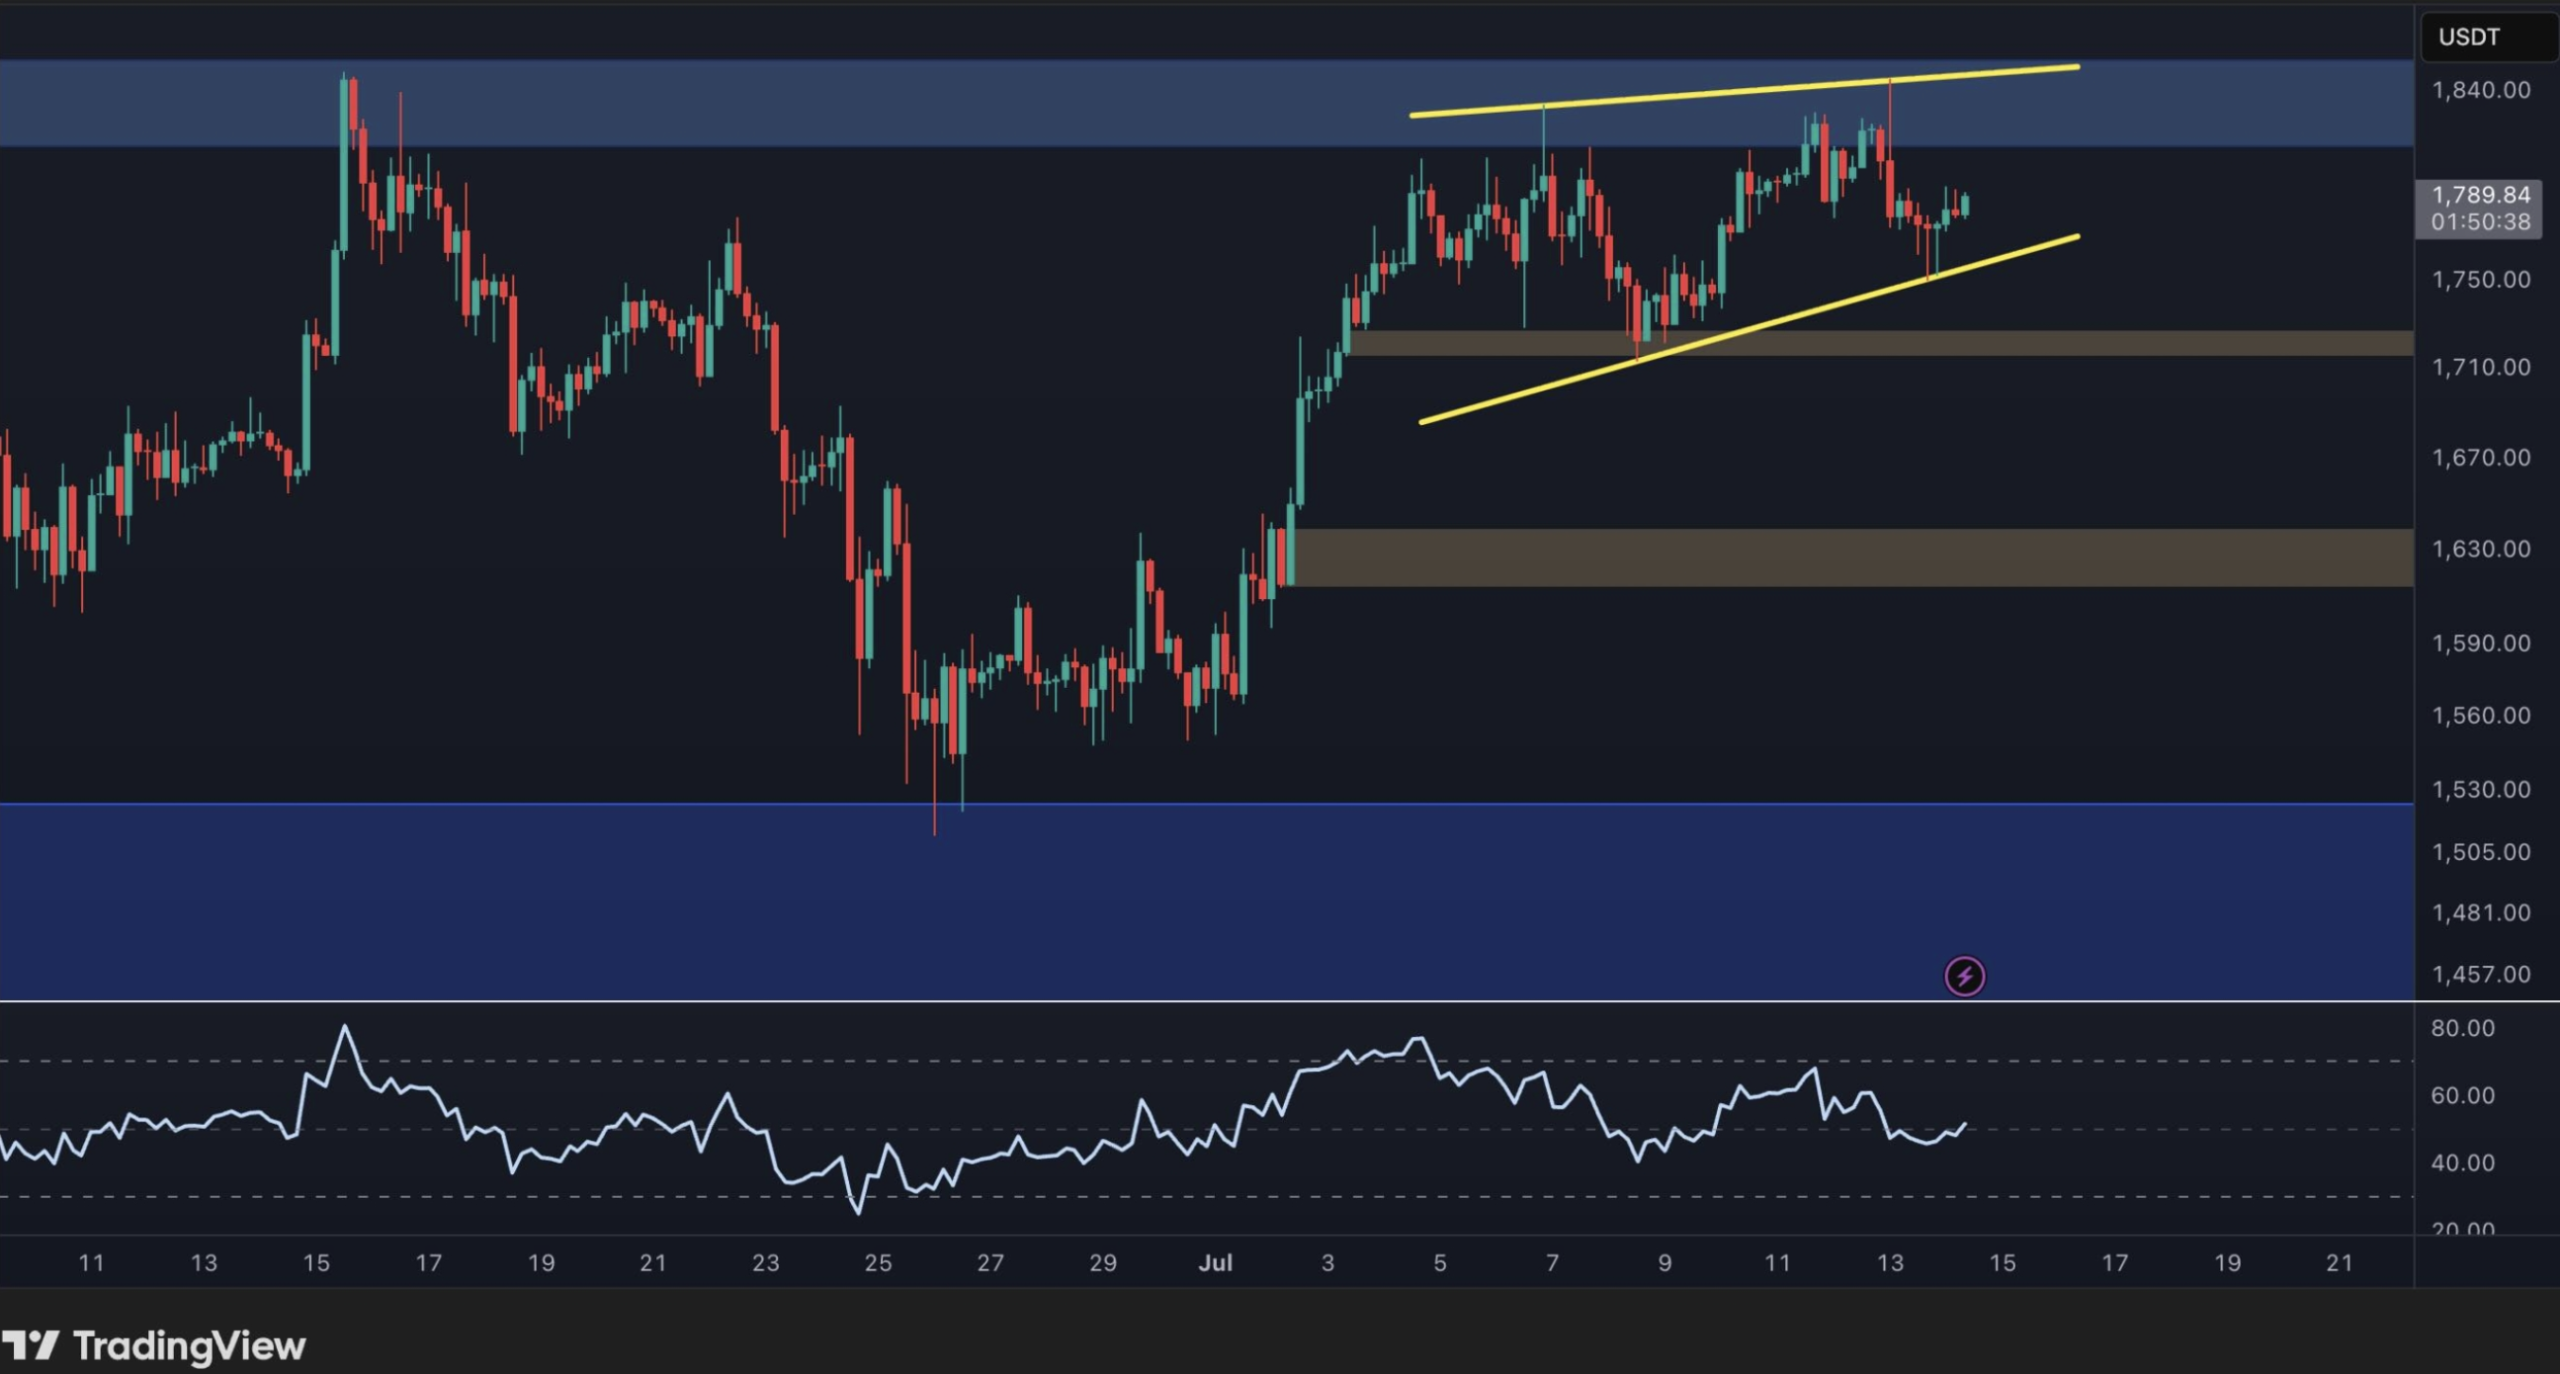
ETH 4-hour RSI chart
ETH 4-hour RSI remains around neutral territory. | Credit: TradingView

The level is particularly significant because several technical signals converge there. It represents the upper boundary of Ethereum’s current recovery channel while sitting just below the 100-day and 200-day moving averages between roughly $2,000 and $2,200.

Breaking through this zone would mark the first meaningful challenge to Ethereum’s broader bearish structure that has dominated much of 2026.

Momentum indicators are beginning to improve.

The Relative Strength Index (RSI) has climbed back above the neutral 50 level after recovering from oversold conditions, suggesting buying momentum is strengthening without yet reaching overheated territory.

If ETH clears $1,850 with conviction, analysts see room for a move toward $2,000 initially, followed by the clustered moving averages near $2,200.

Failure to overcome resistance, however, could leave Ethereum trapped inside its current range for several more weeks.

Higher lows suggest buyers are gaining confidence

While the daily chart highlights the larger resistance, shorter-term price action paints a more constructive picture.

On the four-hour timeframe, Ethereum continues to trade inside an ascending channel characterized by a series of higher lows.

Each decline has attracted buyers before reaching the broader support region around $1,700, indicating that demand continues to absorb selling pressure.

This compression between rising support and horizontal resistance often precedes periods of increased volatility.

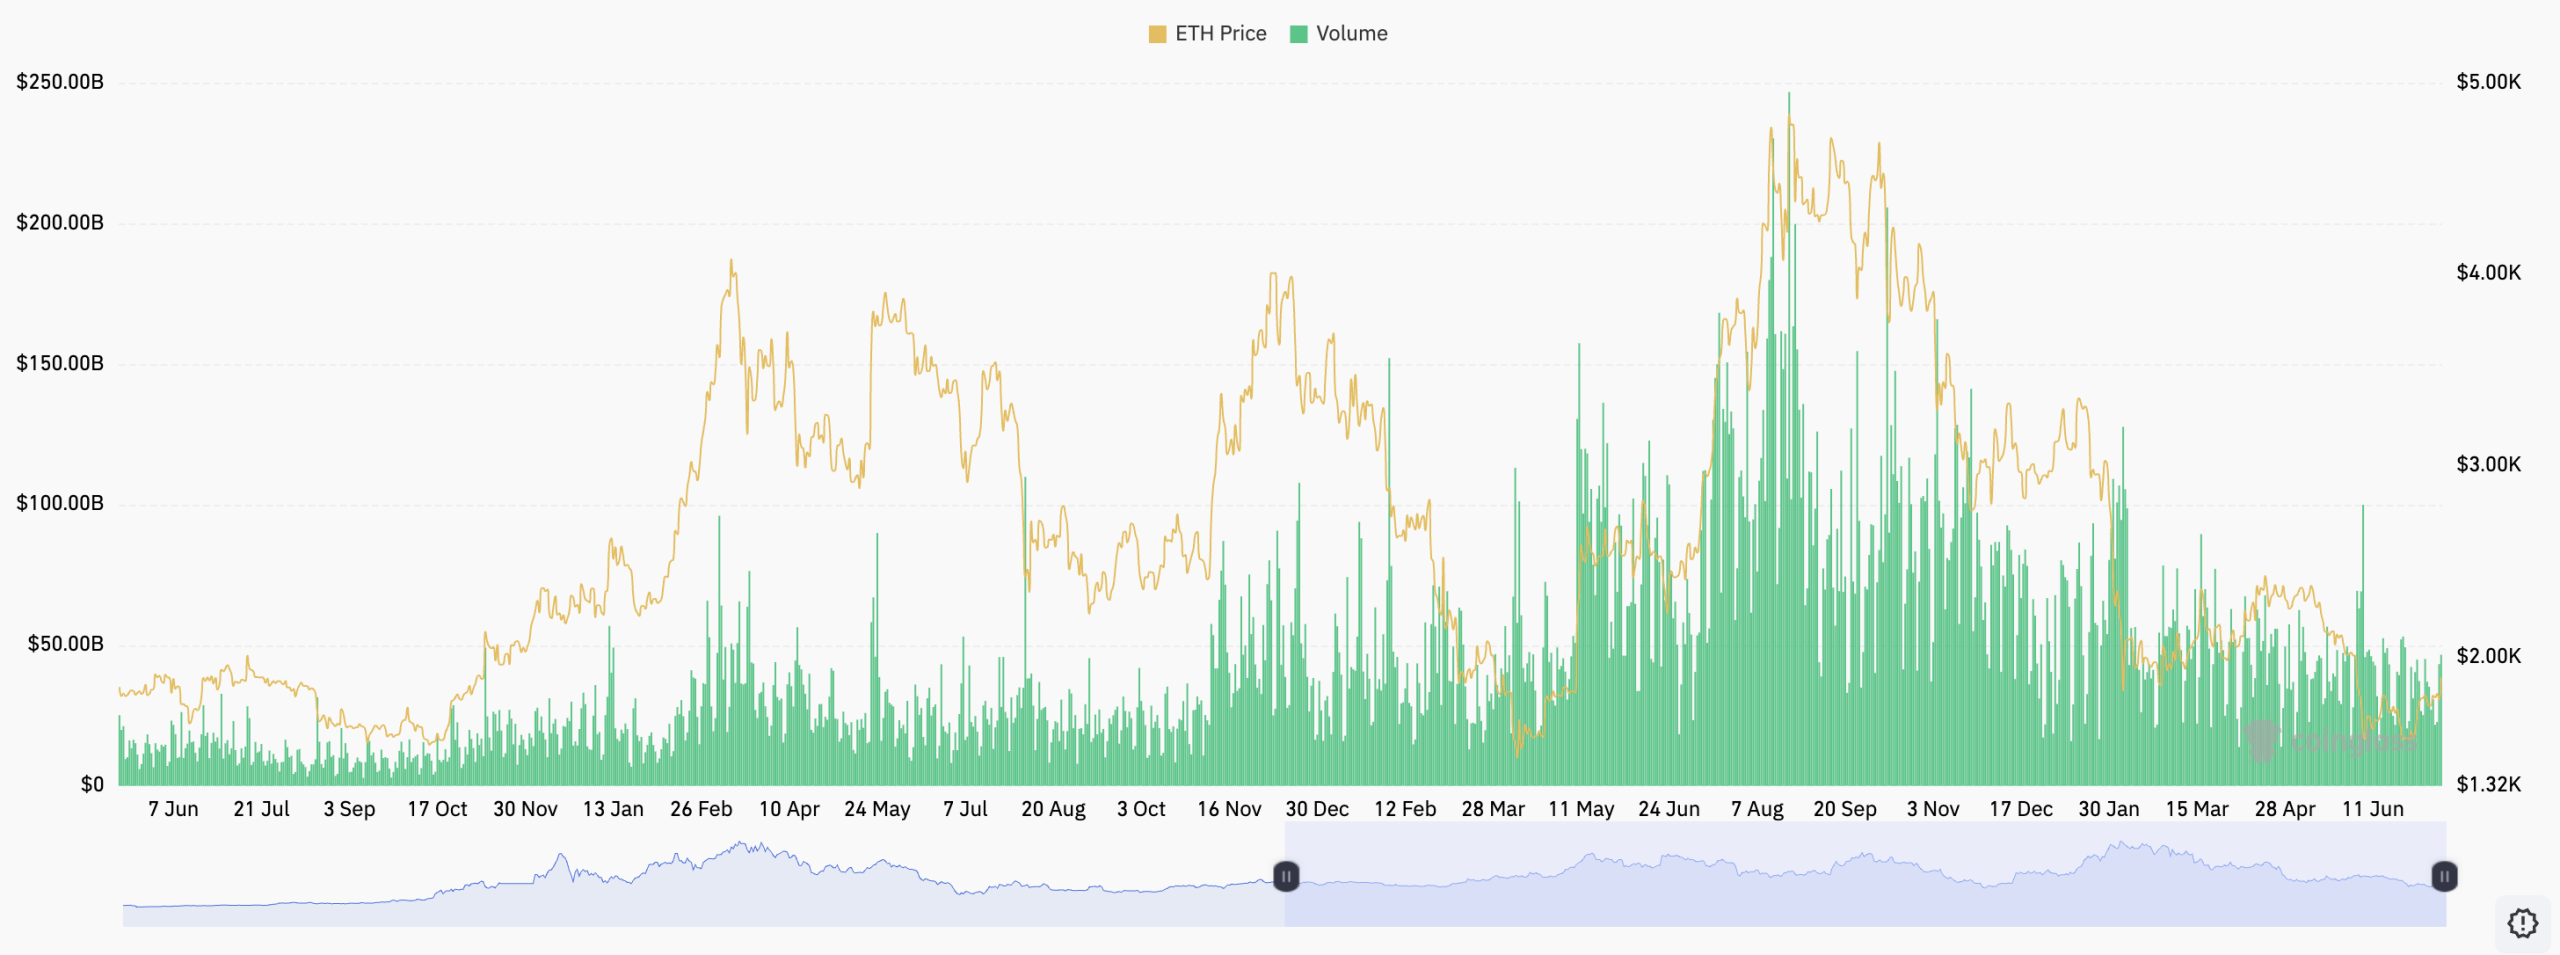
Ethereum volume
Ethereum volume. | Credit: CoinGlass

Several analysts also point to Ethereum’s volume-weighted average price (VWAP) cluster around $1,785-$1,790 as an important area of equilibrium.

Multiple trading sessions have established this region as fair value, meaning buyers and sellers repeatedly agree on price there.

As long as ETH remains around this zone, traders should expect continued two-way price action rather than a sustained trend.

The key confirmation levels remain relatively clear.

A sustained move above approximately $1,813, confirmed by multiple hourly closes, would strengthen the bullish case and increase the probability of a breakout toward $1,850 and beyond.

Conversely, repeated failures near resistance or a drop below $1,739 would hand control back to sellers and potentially expose support near $1,700 before the more significant $1,630 demand zone.

Futures positioning points to cautious optimism

Derivatives data suggests sentiment is improving, but not enough to confirm a full bullish reversal.

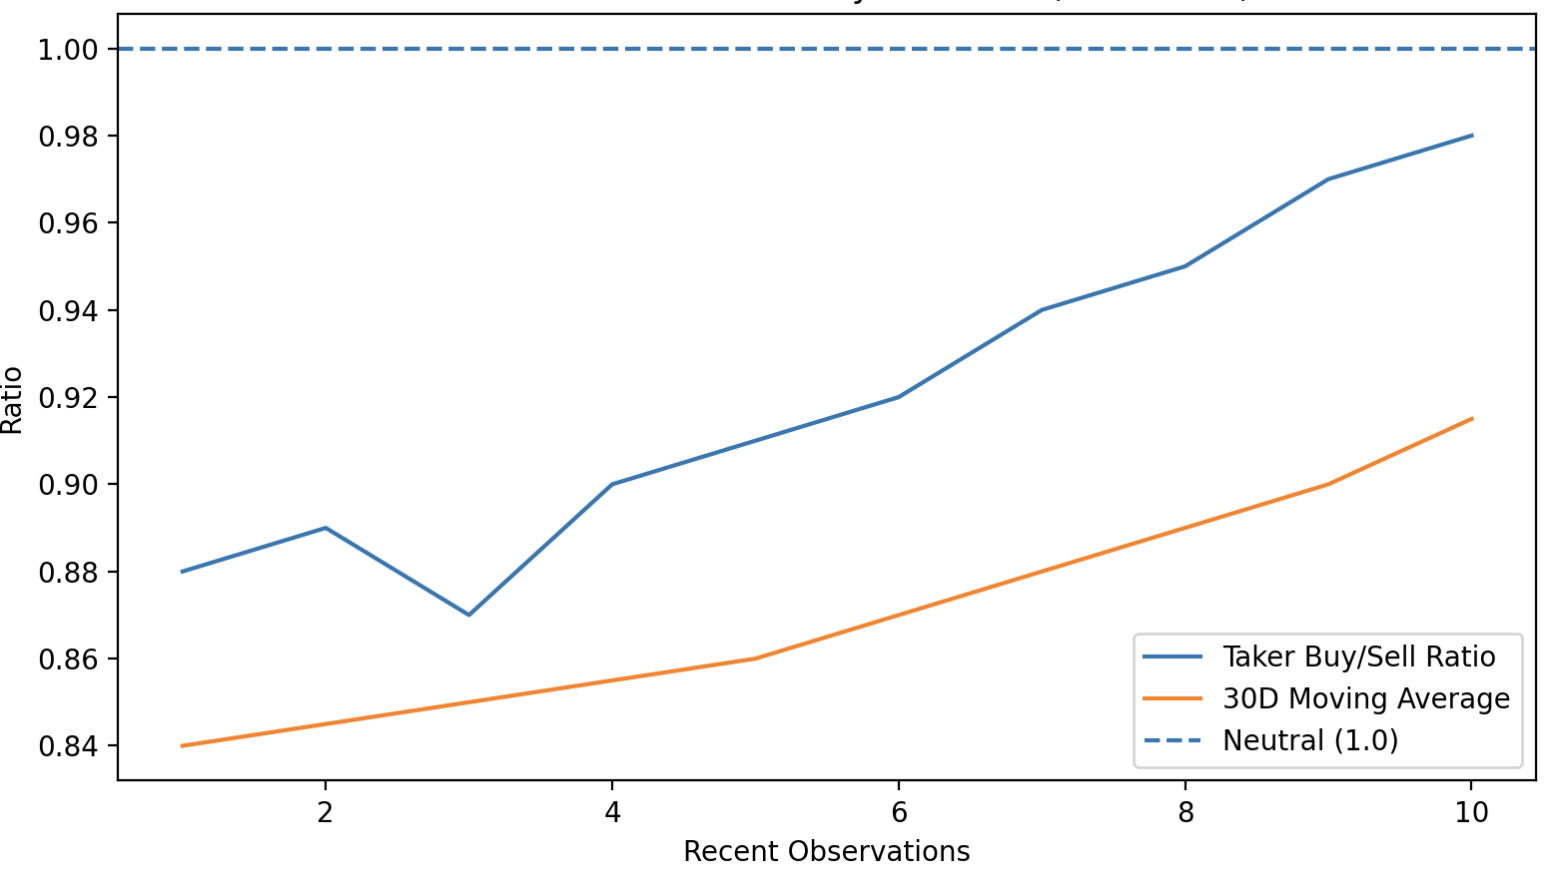
Ethereum’s Taker Buy/Sell ratio remains below the neutral reading of 1.0, meaning aggressive sellers still slightly outnumber aggressive buyers across futures exchanges.

Historically, readings below one indicate that leveraged traders remain cautious despite improving spot prices.

However, the trend beneath the surface appears to be shifting.

Ethereum's Taker Buy/Sell ratio
Ethereum’s Taker Buy/Sell ratio. | Credit: CCN.com

The ratio’s 30-day moving average has started turning higher after reaching recent lows, suggesting selling pressure is gradually easing.

That aligns with Ethereum’s improving technical structure, where higher lows continue forming despite repeated tests of resistance.

Analysts say the ideal confirmation would be a combination of technical and derivatives signals.

If Ethereum can reclaim the $1,850 resistance while the Taker Buy/Sell ratio climbs above 1.0, it would indicate that futures traders are beginning to support the spot market recovery rather than fading rallies.

Until then, Ethereum remains caught between improving momentum and lingering caution.

The technical structure increasingly favors buyers, but the market still needs a decisive breakout above $1,850 before analysts can confidently call the beginning of a larger bullish trend toward $2,000 and beyond.

Disclaimer: The information provided in this article is for informational purposes only. It is not intended to be, nor should it be construed as, financial advice. We do not make any warranties regarding the completeness, reliability, or accuracy of this information. All investments involve risk, and past performance does not guarantee future results. We recommend consulting a financial advisor before making any investment decisions.
Giuseppe Ciccomascolo

Giuseppe Ciccomascolo began his career as an investigative journalist in Italy, where he contributed to both local and national newspapers, focusing on various financial sectors.

Upon relocating to London, he worked as an analyst for Fitch's CapitalStructure and later as a Senior Reporter for Alliance News. In 2017, Giuseppe transitioned to covering cryptocurrency-related news, producing documentaries and articles on Bitcoin and other emerging digital currencies. He also played a pivotal role in establishing the academy for a cryptocurrency exchange website. Crypto remained his primary area of interest throughout his tenure as a writer for ThirdFloor.

Related

Survey Icon
Help us improve
1 of 4
Is this your first time here?
What brought you here today?
What are you most interested in?
Would you be interested in:
Thank you icon
Thank you for your feedback!
DMCA.com Protection Status