Ethena’s ENA native token debuted on the market on April 2, 2024.
It promptly joined the ranks of the top 100 cryptocurrencies by market capitalization.
Our Ethena price prediction suggests that ENA will continue to decline well into 2026.
Ethena’s ENA token debuted on the market on April 2, 2024, and has spent much of the time since then in the top 100 cryptos.
The synthetic dollar protocol rallied after falling to an all-time low in September 2024.
However, 2025 has not been kind to ENA, resulting in a new all-time low on Oct. 10.
On Dec. 8, 2025, ENA was worth about $0.280.
Let’s take a look at our own Ethena price predictions. We’ll also examine the Ethena price history and talk a little about what Ethena is and what it does.
Let’s look at the ENA price predictions made by CCN on Dec. 8, 2025. We will use the wave count method to make the predictions, while the minimum and maximum prices will depend on the price movement during the year.
Since there is less than two years of price history, we will only make an ENA prediction for 2026.
Minimum ENA Price Prediction
Average ENA Price Prediction
Maximum ENA Price Prediction
2026
$0.080
$0.100
$0.521
The most likely wave count suggests that ENA is mired in an A-B-C correction since its all-time high in April 2024. If the count is accurate, ENA is in wave B of this structure.
Get These Top Crypto Casino Offers Now!
Sponsored
Disclosure
We sometimes use affiliate links in our content, when clicking on those we might receive a commission at no extra cost to you. By using this website you agree to our terms and conditions and privacy policy.
Despite the massive decline, bulls have a reason to be optimistic.
Get These Top Crypto Casino Offers Now!
Sponsored
Disclosure
We sometimes use affiliate links in our content, when clicking on those we might receive a commission at no extra cost to you. By using this website you agree to our terms and conditions and privacy policy.
The upside may be limited, since the $0.350 resistance area is only 25% above the current price.
Nevertheless, the ENA price could surge higher if the breakout transpires as expected.
Short-Term Ethena Price Prediction
The Ethena price prediction for the next 24 hours is bullish. ENA could gradually increase until it hits the $0.35 resistance area.
Ethena Average True Range (ATR): ENA Volatility
The Average True Range (ATR) measures market volatility by averaging the largest of three values: the current high minus the current low, the absolute value of the current high minus the previous close, and the absolute value of the current low minus the previous close over a period, typically 14 days.
A rising ATR indicates increasing volatility, while a falling ATR indicates decreasing volatility.
ENA Weekly ATR | Credit: Valdrin Tahiri/TradingView
Since ATR values can be higher for higher-priced assets, normalize ATR by dividing it by the asset price to compare volatility across different price levels.
On Feb. 20, 2025, ENA’s ATR was 0.125, suggesting low volatility.
Ethena Relative Strength Index (RSI): Is ENA Overbought or Oversold?
The Relative Strength Index (RSI) is a momentum indicator that traders use to determine whether an asset is overbought or oversold.
Movements above 70 and below 30 show over- and undervaluation, respectively. Movements above and below the 50 line also indicate if the trend is bullish or bearish.
ENA Weekly RSI | Credit: Valdrin Tahiri/TradingView
On Feb. 20, 2025, the Ethena RSI was 39, indicating bearish conditions, with ENA nearing oversold territory.
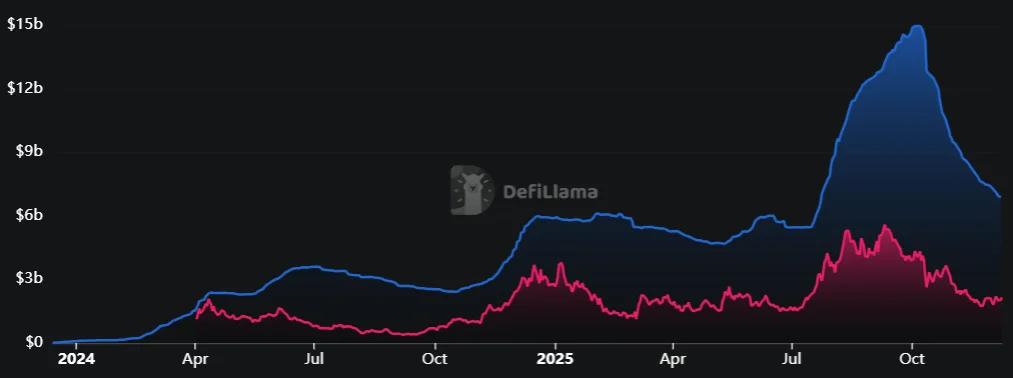
Ethena Market Cap to TVL Ratio
The Total Value Locked (TVL) to market cap ratio (TVL ratio) measures the valuation of a decentralized finance (DeFi) project by comparing its market capitalization to the total value of assets locked in its smart contracts.
This ratio indicates the project’s utilization and correlates the platform’s health with the locked asset value.
A ratio above 1.0 indicates overvaluation because the market cap exceeds the value of assets used in the platform. A ratio below 1.0 indicates undervaluation because the market cap is lower than the value of locked assets.
On Dec. 8, 2025, the Ethena TVL ratio was 0.3, suggesting undervaluation.
CCN Strength Index
The CCN Strength Index combines an array of advanced market signals to measure the strength of individual cryptocurrencies over the last 30 days.
Every day, it assigns a strength score, ranging from 0 to 100, to the top 500 assets by market capitalization on CoinMarketCap, focusing on both trend direction and the intensity of price movements.
0 to 24: Assets exhibit significant weakness, showing signs of sustained downtrend behavior.
25 to 35: The price tends to move within stable bounds with minimal volatility.
36 to 49: Assets begin a stable uptrend but without strong surges.
50 to 59: Consistent growth with moderate price advances, building momentum.
60+: Sharp price movements and high demand indicate stronger volatility and trend shifts.
The index dynamically adapts to rapid changes. For example, an asset experiencing a 100% increase within a short timeframe would see a sharp jump in its score to reflect the intensity of the rise.
However, should that asset stabilize at this new price level, the score will gradually taper down and align with the dampened momentum as the movement normalizes. The same principle applies to rapid declines: a sudden drop will spike the score downward, but as volatility decreases, the score will slowly adjust back up.
On Dec. 8, 2025, Ethena scored 44.2 on the CCN Index, suggesting moderate momentum.
ENA CCN Index | Credit: CCN
Ethena Price Performance Comparisons
At its heart, Ethena is a Decentralized Finance (DeFi) protocol, so let’s compare its recent performance to that of other cryptos in the same category with a similar market cap.
Let’s now take a look at some of the key dates in the Ethena price history. While past performance should never be taken as an indicator of future results, knowing what the coin has done can help give us some very useful context when it comes to either making or interpreting an Ethena price prediction.
0xcfc40d4eca21f60d329f1e6b9b3d6069eaa20bbc. This wallet held 3,089,622,802 ENA or 20.6% of the supply.
0xc4e512313dd1ce0795f88ec5229778edf1fdf79b. This wallet held 2,800,000,000 ENA or 18.67% of the supply.
0x688ae58ebd684b3c475c81584f976593930ca67f. This wallet held 1,549,799,920 ENA or 10.33% of the supply.
0xb2af973905f05bc82bf97486b6ab883598d98298. This wallet held 1,363,095,866 ENA or 8.85% of the supply.
0x54b8c65f0635fd91c8729dd3269c630d9aed54e5. This wallet also held 1,317,747,126 ENA or 8.78% of the supply.
Ethena Supply and Distribution
Supply and Distribution
Figures
Total supply
15,000,000,000
Circulating supply (as of Dec. 8, 2025)
7,690,125,000 (51.3% of total supply)
Holder distribution (as of Dec. 8, 2025)
Top 10 holders owned 85.27% of the total supply.
From the Ethena Whitepaper
In its technical documentation or whitepaper, Ethena says it is “a synthetic dollar protocol built on Ethereum that provides a crypto-native solution for money, USDe, alongside a globally accessible dollar savings asset.”
What Is Ethena?
Ethena is, like its whitepaper says, a stablecoin protocol based on the Ethereum blockchain. It offers a stablecoin called USDe. Unlike traditional stablecoins like USDC or USDT, USDe is not pegged to fiat currencies.
Instead, it is a synthetic dollar collateralized with crypto assets and short futures positions.
The ENA token supports the platform.
How ENA Works
ENA holders can vote on changes to the Ethena network. People can also buy, sell, and trade ENA on exchanges.
Is Ethena a Good Investment?
It is hard to say. Ethena has settled into its position in the top 100 pretty well. However, one does have to ask whether something that carries the faint whiff of an algorithmic stablecoin has much of an appeal following 2022’s collapse of LUNA.
That said, it has performed well when the market has gone up, so you should also keep an eye on the wilder world of crypto for any developments.
As always with crypto, you should do your own research before deciding whether or not to invest in Ethena.
Will Ethena go up or down?
No one can really tell right now. While the Ethena crypto price predictions are largely positive, price predictions have a well-earned reputation for being wrong. Keep in mind that prices can fluctuate and change.
Should I invest in Ethena?
Before deciding whether to invest in Ethena, research ENA and other related coins and tokens, such as Ethereum (ETH) and Solana (SOL).
Either way, you must also ensure you never invest more money than you can afford to lose.
FAQs
How many Ethena are there?
As of Dec. 8, 2025, 7.69 billion ENA were in circulation out of a total supply of 15 billion.
Will Ethena reach $10?
According to our price predictions based on technical analysis, ENA won’t reach a double-figure level at any point this year.
What is Ethena?
The ENA token gives holders a vote on changes to the Ethena platform. People can also buy, sell, and trade it on exchanges.
Disclaimer:
The information provided in this article is for informational purposes only. It is not intended to be, nor should it be construed as, financial advice. We do not make any warranties regarding the completeness, reliability, or accuracy of this information. All investments involve risk, and past performance does not guarantee future results. We recommend consulting a financial advisor before making any investment decisions.
Valdrin Tahiri is a cryptocurrency analyst and reporter at CCN, specializing in technical analysis with a focus on Elliott Wave theory, on-chain metrics, and fundamental research. He brings over seven years of experience in the crypto space as both a trader and writer.
He discovered cryptocurrencies in 2017 while earning his MSc in Financial Markets at the Barcelona School of Economics, which sparked a deep interest in blockchain and market dynamics. Since then, he’s contributed to top crypto outlets like BeInCrypto and CoinGape.
Valdrin also served as Community Manager of BeInCrypto’s Telegram group for three years, helping grow it into one of the largest crypto communities worldwide. His expertise in market structure and price patterns allows him to break down complex trends into clear, actionable insights.
He’s published thousands of articles covering altcoins, Bitcoin cycles, and macro trends.
Giuseppe Ciccomascolo began his career as an investigative journalist in Italy, where he contributed to both local and national newspapers, focusing on various financial sectors.
Upon relocating to London, he worked as an analyst for Fitch's CapitalStructure and later as a Senior Reporter for Alliance News. In 2017, Giuseppe transitioned to covering cryptocurrency-related news, producing documentaries and articles on Bitcoin and other emerging digital currencies. He also played a pivotal role in establishing the academy for a cryptocurrency exchange website. Crypto remained his primary area of interest throughout his tenure as a writer for ThirdFloor.