CCN’s forecast sees strong DASH upside into 2026 and beyond. | Credit: Hameem Sarwar
Share
Key Takeaways
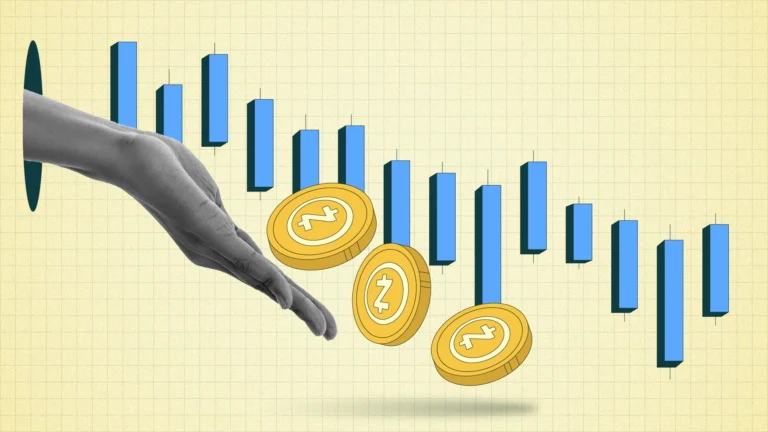
DASH’s price has increased by 87% in 90 days, but has recently dropped.
Long-term forecasts are more bullish than the short-term forecasts.
This prediction reveals how DASH is expected to perform next year and beyond.
Dash, one of the pioneers of privacy-oriented cryptocurrencies, has staged an impressive comeback after years in the shadows.
Having survived the brutal crypto winters and multiple market corrections, DASH seemed to have held a stronger position for the coming year.
In fact, the altcoin has increased nearly 87% over the past 90 days and briefly reached $75 for the first time since 2023. In recent times, it has declined from that height.
Amid this performance, there have been predictions that the crypto will trade higher. But will it?
Let’s examine our Dash price prediction, made on Dec. 8, 2025. We will also reveal the Dash price history and provide a brief overview of what Dash is and its key features.
Let’s look at the DASH price predictions made by CCN on Dec. 8, 2025. To make these predictions, we will look at the fundamentals, market sentiment, and technical analysis.
Minimum DASH Price Prediction
Average DASH Price Prediction
Maximum DASH Price Prediction
2026
$38.72
$128.84
$195.54
2027
$21.04
$32.16
$56.40
2030
$249.44
$380.09
$477.85
DASH Price Prediction 2026
Earlier in the year, DASH did not show any sign of breaking out. However, over the last few months, things have changed amid rising bullish sentiment surrounding privacy coins.
Although that sentiment has waned somewhat, demand for DASH may still rise in 2026. Therefore, the market value could trade higher before the end of the year.
Thus, the DASH price prediction for 2026 could be between $38.72 and a maximum value of $195.54
Get These Top Crypto Casino Offers Now!
Sponsored
Disclosure
We sometimes use affiliate links in our content, when clicking on those we might receive a commission at no extra cost to you. By using this website you agree to our terms and conditions and privacy policy.
In the coming years, privacy might become mainstream in the crypto market. However, the market might decline into a bear phase, potentially dragging the DASH price down.
As such, the DASH price prediction for 2027 could be between $21.04 and $56.40.
DASH Price Prediction 2030
2030 might be a big year for cryptocurrencies, including DASH. While many might hope that the altcoin will reach its all-time high, that might not happen.
However, the price is likely to trade much higher, with targets ranging between $249.44 and $477.85.
DASH Price Analysis
The weekly chart shows that DASH has maintained its rounding bottom pattern despite the recent correction. This resilience signals that long-term structure remains intact.
Meanwhile, the Moving Average Convergence Divergence (MACD) stays above the zero line, confirming that broader momentum still leans bullish.
However, the shorter and longer EMAs on the MACD remain at odds, showing that bulls and bears are locked in a fight for control.
However, this outlook shifts quickly if sellers step in. If bears gain dominance, the projected breakout may fail, and DASH’s price could slide below $30, invalidating the bullish setup entirely.
Short-Term DASH Prediction
In the short term, DASH’s price may struggle to break out of its current range. This is due to the technical setup on the daily chart.
As seen below, DASH is stuck in a descending channel. At the same time, the Awesome Oscillator (AO) is in the negative region, indicating bearish momentum.
Should this trend persist, the altcoin may decline to the support level at $36.60.
On the contrary, if buying pressure increases, DASH might break out above the upper trendline. In that case, the DASH coin could rise to $69.46.
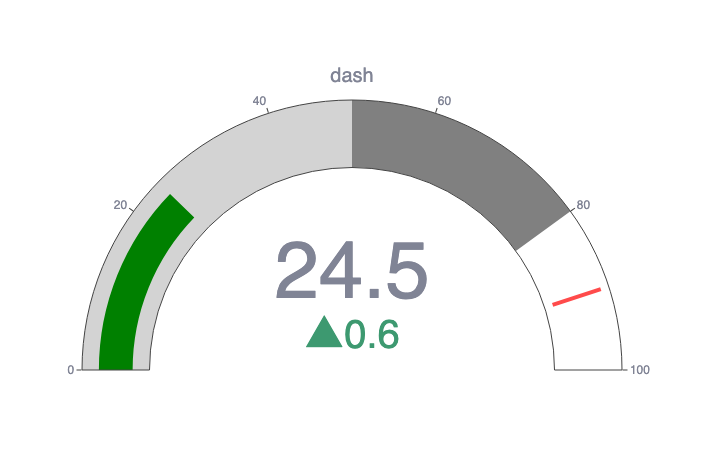
The CCN Strength Index combines a range of advanced market signals to measure the strength of individual cryptocurrencies over the past 30 days.
Every day, it assigns a strength score, ranging from 0 to 100, to the top 500 assets by market capitalization on CoinMarketCap, focusing on both trend direction and the intensity of price movements.
0 to 24: Assets exhibit significant weakness, showing signs of sustained downtrend behavior.
25 to 35: The price tends to move within stable bounds with minimal volatility.
36 to 49: Assets begin a stable uptrend but without strong surges.
50 to 59: Consistent growth with moderate price advances, building momentum.
60+: Sharp price movements and high demand indicate stronger volatility and trend shifts.
The index dynamically adapts to rapid changes. For example, an asset experiencing a 100% increase within a short timeframe would see a sharp jump in its score to reflect the intensity of the rise.
However, should that asset stabilize at this new price level, the score will gradually taper down and align with the dampened momentum as the movement normalizes. The same principle applies to rapid declines: a sudden drop will spike the score downward, but as volatility decreases, the score will slowly adjust back up.
We examined the Dash price history and identified periods when the price was at its lowest, spanning specific days, months, quarters, and even weeks of the year, indicating the best times to buy DASH.
Day of the Week
Saturday
Week
7
Month
May
Quarter
Second
Dash Price History
Following that, let’s now take a look at some of the key dates in the Dash price history. While past performance should never be taken as an indicator of future results, understanding what the coin has done can provide valuable context when making or interpreting a Dash price prediction.
Time period
Dash price
Last week (Dec. 1, 2025)
$51.89
Last month (Nov. 8, 2025)
$82.65
Three months ago (Sept. 8, 2024)
$25.55
Last year (Dec. 8, 2024)
$57.77
Five years ago (Dec. 8, 2020)
$95.32
Launch price (Feb. 14, 2014)
$0.21
All-time high (December 20, 2017)
$1,642.22
All-time low (Feb. 14, 2014)
$0.21
Who Owns the Most Dash (DASH)?
At the time of writing, one wallet held nearly 6% of the Dash supply.
XnT33zjrFKjt3ymfyQZs2FPiKNer3WVj14. This wallet held 1,021,724 DASH, or 5.41% of the supply.
XstYcYeqoX7E99Az9kgXEhvEcCBA7mVbvP. This wallet held 335,613 DASH, or 1.78% of the supply.
XmZQkfLtk3xLtbBMenTdaZMxsUBYAsRz1o. This wallet held 154,675 DASH, equivalent to 0.82% of the total supply.
Xe9Q6UHvXCraQS9SdsTgAgyhhBZKVB2bKZ. This wallet held 149,470 DASH, equivalent to 0.79% of the total supply.
XqqECz6o5zYDF6DcoPPWwbcT6NPi7XcA8P. This wallet held 144,609 DASH, equivalent to 0.77% of the total supply.
Dash Supply and Distribution
Supply and distribution
Figures
Maximum Supply
18,920,000
Circulating supply (as of Dec. 8, 2025)
12,510,688 (64.38% of maximum supply)
Holder distribution
The top 10 holders owned 12.17% of the supply as of Dec. 8, 2025
From the Dash Whitepaper
In its technical documentation or whitepaper, Dash says it is “a cryptocurrency based on Bitcoin, the work of Satoshi Nakamoto, with various improvements such as a two-tier incentivized network, known as the Masternode network.”
“Included are other improvements such as Darksend, for increasing fungibility, and InstantX, which allows instant transaction confirmation without a centralized authority.”
Dash (DASH) Explained
Dash is a blockchain that aims to give its users privacy. However, it is important to note that it is run by a decentralized autonomous organization (DAO) and supported by the DASH crypto coin.
Dash was founded in 2014 and was originally called Xcoin. It was created as a branch of Litecoin (LTC), a spin-off of Bitcoin.
How Dash Works
People who hold DASH can add blocks to the Dash blockchain and secure the network. People can also buy, sell, and trade DASH on exchanges.
Is Dash a Good Investment?
It is hard to say. The coin has been around for a long time. However, after a long time, it is back among the top 100 cryptos by market cap.
In addition, with increasing crackdowns on privacy coins and crypto mixers, DASH faces some uncertainty going forward.
As always with crypto, you should do your own research before deciding whether or not to invest in Dash.
Will Dash go up or down?
No one can really tell right now. While the Dash crypto price predictions are mainly optimistic, they have a reputation for being wrong. Keep in mind that prices can fluctuate and change.
Should I invest in Dash?
Before you decide whether or not to invest in Dash, you will have to do your own research, not only on DASH but also other related coins and tokens such as Ethereum (ETH) and Solana (SOL). Either way, you must also ensure you never invest more money than you can afford to lose.
FAQs
How many Dash are there?
As of Dec. 8, 2025, 12,510,688 DASH were in circulation, representing the total supply.
Will DASH reach $100?
Considering its recent performance, DASH will likely reach three figures before 2026 ends or by early 2027, based on the signs from its technical analysis
What is Dash used for?
DASH coin holders can add blocks to the Dash blockchain and secure the network. People can also buy, sell, and trade it on exchanges.
Disclaimer:
The information provided in this article is for informational purposes only. It is not intended to be, nor should it be construed as, financial advice. We do not make any warranties regarding the completeness, reliability, or accuracy of this information. All investments involve risk, and past performance does not guarantee future results. We recommend consulting a financial advisor before making any investment decisions.
Victor Olanrewaju is a crypto analyst and reporter at CCN with deep roots in on-chain research and technical analysis. His crypto journey began in 2017, but it was the 2020 Uniswap airdrop that sparked a full-time pivot into the space.
With a foundation in copywriting, Victor honed his craft creating high-converting content for leading crypto brokers — most notably an XRP price prediction that ranked #1 on Google during the 2021 bull run.
He later joined AMBCrypto in 2022, where he combined storytelling with technical and on-chain analysis to cover key market narratives.
In 2024, he expanded his expertise at BeInCrypto, collaborating with analysts and using tools like Glassnode, Santiment, and IntoTheBlock to break down Bitcoin and altcoin trends.
At CCN, Victor covers the top cryptocurrencies, memecoins, macro shifts, blending real-time insights with deep-dive metrics.
He holds a Bachelor’s degree in Physics from the University of Ibadan, equipping him to simplify complex data for a wide audience. Follow his work or connect on LinkedIn or X.
Valdrin Tahiri is a cryptocurrency analyst and reporter at CCN, specializing in technical analysis with a focus on Elliott Wave theory, on-chain metrics, and fundamental research. He brings over seven years of experience in the crypto space as both a trader and writer.
He discovered cryptocurrencies in 2017 while earning his MSc in Financial Markets at the Barcelona School of Economics, which sparked a deep interest in blockchain and market dynamics. Since then, he’s contributed to top crypto outlets like BeInCrypto and CoinGape.
Valdrin also served as Community Manager of BeInCrypto’s Telegram group for three years, helping grow it into one of the largest crypto communities worldwide. His expertise in market structure and price patterns allows him to break down complex trends into clear, actionable insights.
He’s published thousands of articles covering altcoins, Bitcoin cycles, and macro trends.