Bitcoin (BTC) fell after failing to break out from a parallel channel.
The Crypto Market Cap (TOTALCAP) prevented a breakdown with a bounce.
Altcoins have been hit the hardest during the ongoing crypto market crash.
Bitcoin’s latest dip has rattled the crypto market, sparking debate over whether the bull run is losing steam or if this is just another healthy correction.
After failing to break through key resistance levels, Bitcoin’s momentum has cooled — and the weakness has spread across the broader market.
Altcoins are taking the biggest hit, while traditional safe-haven assets like gold and silver are also sliding, fueling concern that the pullback could be part of a wider macro slowdown.
So, is this the start of a deeper downturn — or just the market catching its breath? Here’s what the charts suggest might come next.
Why Is Bitcoin Down Today?
The Bitcoin price has increased since its $103,530 low on Oct. 17. While the increase has been substantial, it is also contained within an ascending parallel channel.
These channels typically exhibit corrective movements, suggesting that an eventual breakdown is the most likely future outcome.
To add to this bearish prediction, the Bitcoin price reached the channel’s resistance trendline on Oct. 27 and subsequently declined.
Get These Top Crypto Casino Offers Now!
Sponsored
Disclosure
We sometimes use affiliate links in our content, when clicking on those we might receive a commission at no extra cost to you. By using this website you agree to our terms and conditions and privacy policy.
The rejection happened between the 0.5-0.618 Fibonacci retracement resistance levels, providing even more confluence to the bearish analysis.
Currently, Bitcoin’s price is trading in the lower portion of the channel, increasing the likelihood of a breakdown.
Momentum indicators suggest an eventual breakdown is likely. This is especially clear from the Moving Average Convergence/Divergence (MACD), which has formed a bearish cross (indicated by the black circle).
To top this off, the Relative Strength Index (RSI) has nearly fallen below 50 and will continue to do so if the price of Bitcoin continues to decline.
If Bitcoin breaks down, the main support area will be $106,500. However, since the entire bounce could be corrective, the price of Bitcoin is more likely to fall to new lows rather than initiate a trend reversal.
Why Did Crypto Crash?
The cryptocurrency market is also down and shows a similarly bearish chart, raising caution about whether the bounce will continue.
Bulls have shown resilience since the crypto market bounced after its Oct. 10 crash, creating a massive lower wick (green icon), validating its diagonal resistance, and reclaiming the $3.60 trillion horizontal support area.
The crypto market went down after a rejection at the channel’s resistance trend line (red icon) and now risks a breakdown from the channel’s lower portion.
This would likely cause the crypto market to crash below the $3.60 trillion horizontal support area, which could trigger a prolonged bear market.
Altcoins Suffer the Most
Altcoins have suffered the most throughout this entire ordeal, especially if we ignore Ethereum (ETH) and focus on smaller-cap altcoins.
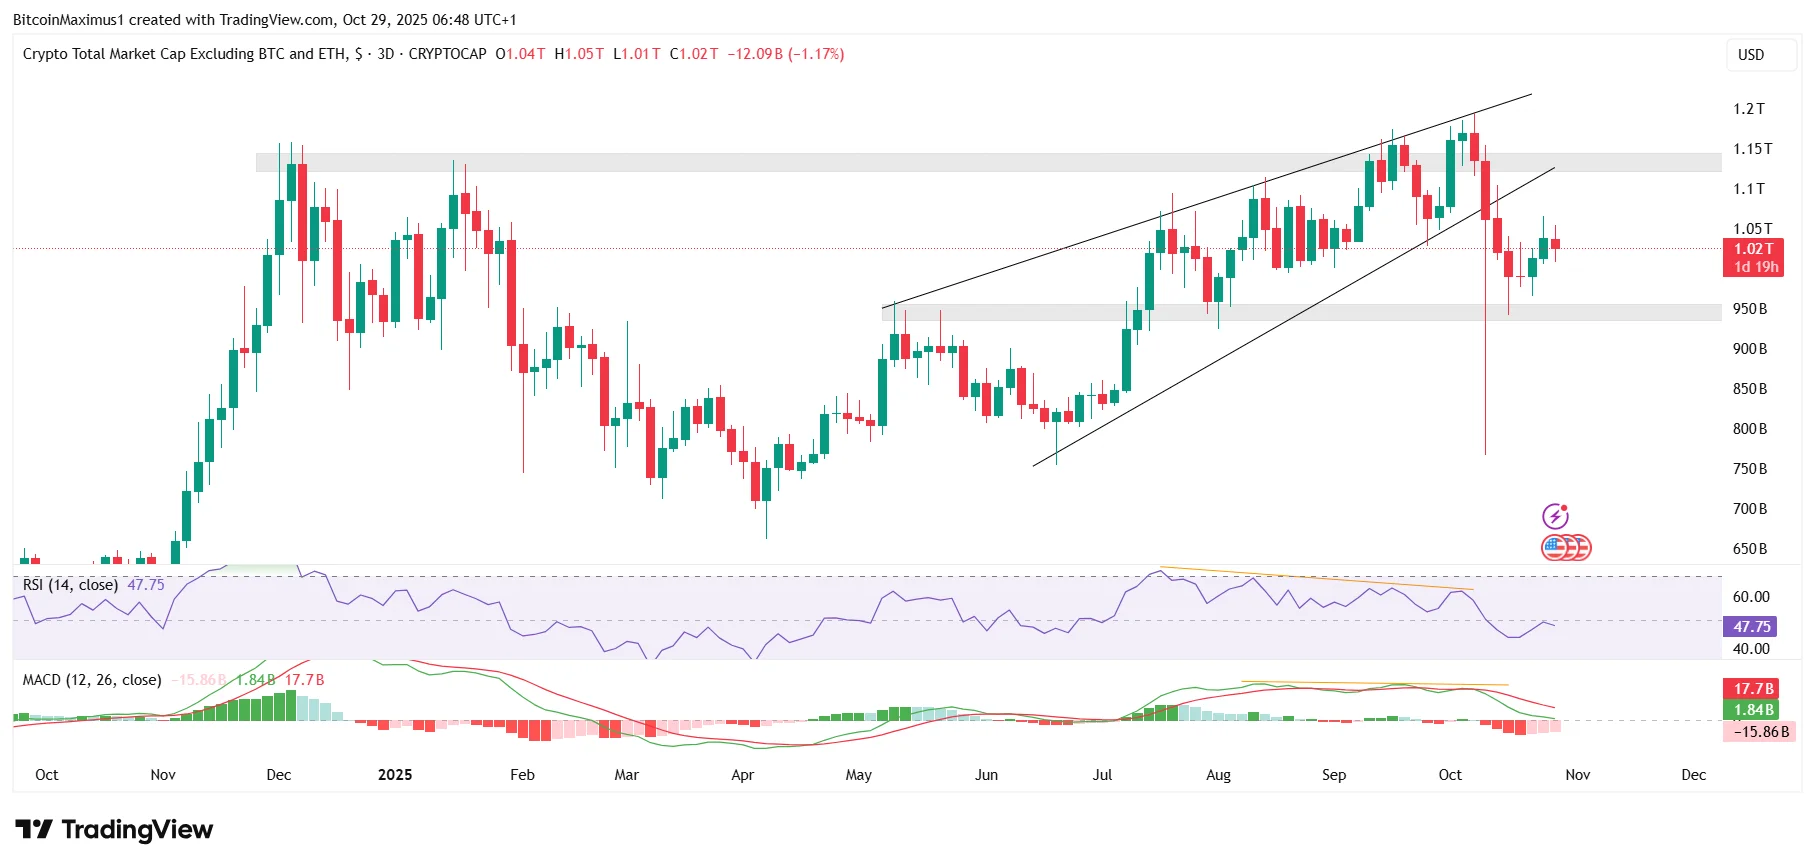
Unlike the rest of the crypto market, the Altcoin Market Cap (ALTCAP) does not trade above support.
On the contrary, the altcoin market deviated above its previous all-time high and broke down from an ascending wedge, a strong sign that the trend is bearish.
Momentum indicators show the same bearish divergences as the rest of the crypto market, preceding a much more significant crash.
Since the RSI and MACD are now in bearish territory and the price action shows no signs of a bullish trend reversal, new lows are likely, confirmed with a breakdown below the $950 billion support area.
The most bearish picture comes from the small-cap altcoin chart, which suggests that the crash will continue and altcoins will keep falling to new lows.
Small-cap altcoins exhibit all the bearish signs from the previous charts, but none of the bullish ones.
These altcoins trade inside an ascending parallel channel and are in its lower portion.
Additionally, they are nowhere near the all-time highs or horizontal support.
Finally, the RSI and MACD are in negative territory, below 50 and 0, respectively.
As a result, an eventual altcoin crash and new lows are likely before the end of the year.
Expert Commentary
Anthony Georgiades, Founder and General Partner at Innovating Capital, believes the recent crypto crash was more than a brief correction, noting that:
The Oct. 10 sell-off exposed excessive leverage and weak liquidity across smaller tokens.
Georgiades expects institutional capital to increasingly favor Bitcoin and Ethereum, while projects delivering real-world value through compute, storage, and data will outperform purely speculative assets.
He adds that stronger margin standards, on-chain collateral checks, and improved transparency across derivatives will be key to reducing future cascade risks, marking a step toward a more mature, investable market.
Bearish End to 2025
With Bitcoin losing steam and the total crypto market cap showing bearish momentum, the outlook remains uncertain heading into November.
Unless BTC and the rest of the crypto market break out from their bearish channels, the door remains open for further downside, especially among smaller altcoins.
For now, traders are bracing for what could be the next leg of the correction.
Disclaimer:
The information provided in this article is for informational purposes only. It is not intended to be, nor should it be construed as, financial advice. We do not make any warranties regarding the completeness, reliability, or accuracy of this information. All investments involve risk, and past performance does not guarantee future results. We recommend consulting a financial advisor before making any investment decisions.
Valdrin Tahiri is a cryptocurrency analyst and reporter at CCN, specializing in technical analysis with a focus on Elliott Wave theory, on-chain metrics, and fundamental research. He brings over seven years of experience in the crypto space as both a trader and writer.
He discovered cryptocurrencies in 2017 while earning his MSc in Financial Markets at the Barcelona School of Economics, which sparked a deep interest in blockchain and market dynamics. Since then, he’s contributed to top crypto outlets like BeInCrypto and CoinGape.
Valdrin also served as Community Manager of BeInCrypto’s Telegram group for three years, helping grow it into one of the largest crypto communities worldwide. His expertise in market structure and price patterns allows him to break down complex trends into clear, actionable insights.
He’s published thousands of articles covering altcoins, Bitcoin cycles, and macro trends.