Here's Why Hyperliquid Has Surged This Week | Credit: Hameem Sarwar
Share
Key Takeaways
Hyperliquid (HYPE) has increased 110% since the Oct. 10 crash.
The price broke out from a descending wedge and surged by 30%.
Can Hyperliquid break out above $50 and surge to new highs?
After a brutal correction that wiped out over half its value, Hyperliquid (HYPE) is showing strong signs of recovery.
The token has rallied more than 110% since the Oct. 10 crash, fueled by a breakout from a descending wedge and sustained momentum.
If HYPE can clear the critical $50 resistance area, the road to a new all-time high will be clear. Let’s examine the charts and determine whether that is likely to happen.
Why is HYPE Going Up?
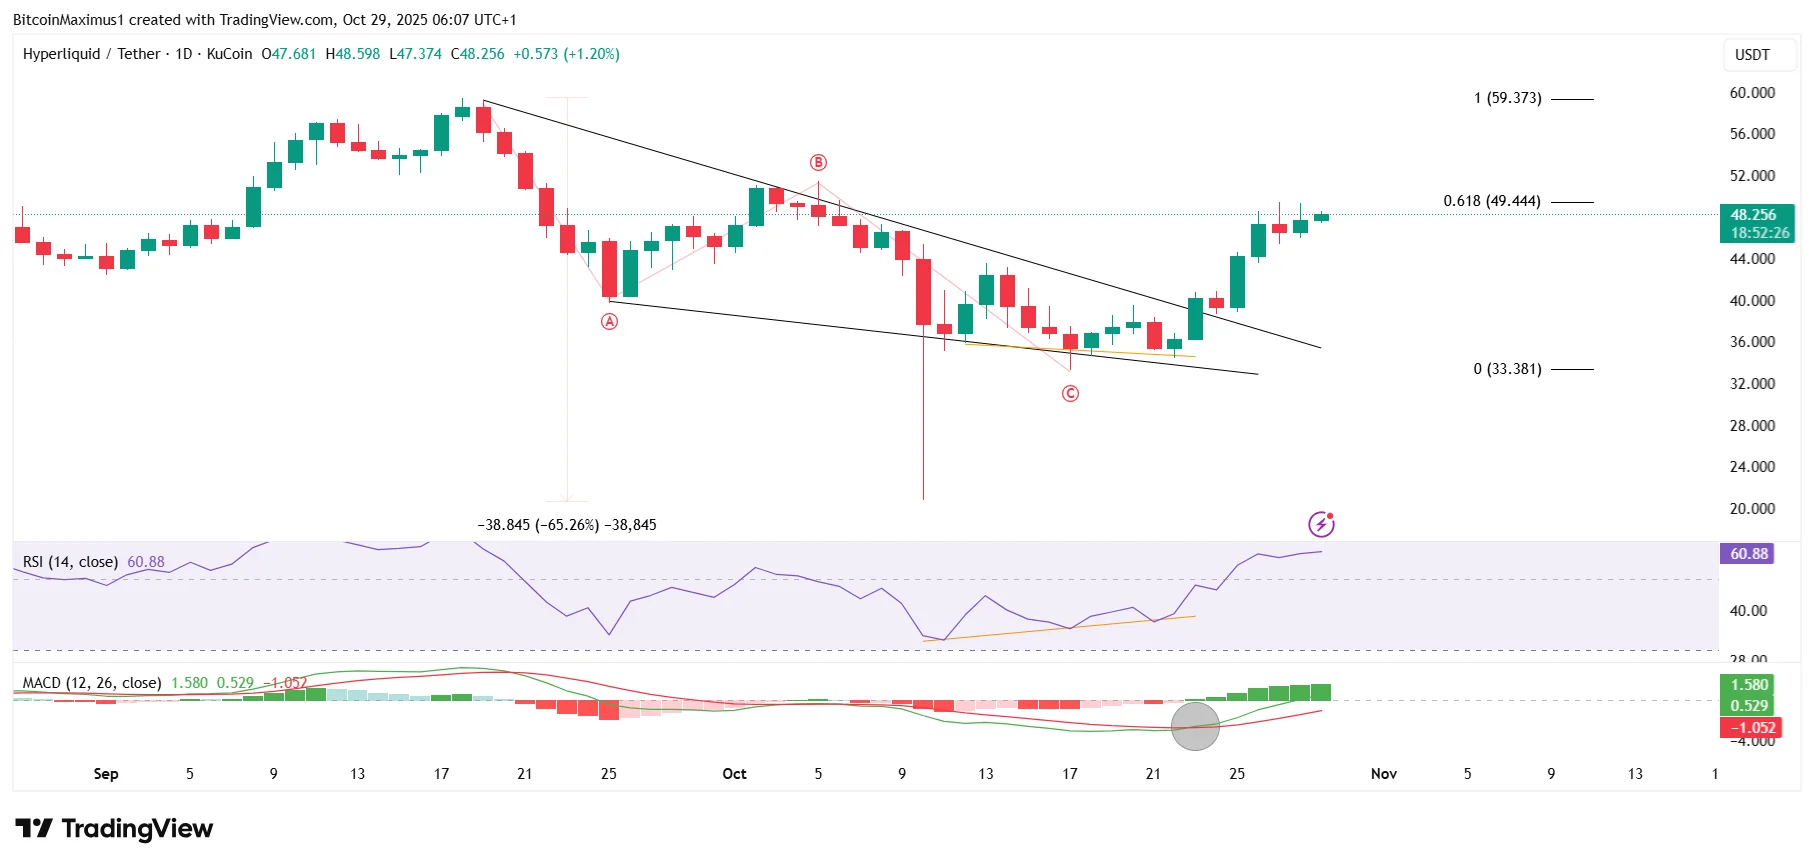
The price of HYPE fell by 65% after reaching its all-time high of $59.42 on Sept. 18.
On Oct. 23, the Hyperliquid price broke out from the wedge and has surged since, hitting a high of $49.40.
Get These Top Crypto Casino Offers Now!
Sponsored
Disclosure
We sometimes use affiliate links in our content, when clicking on those we might receive a commission at no extra cost to you. By using this website you agree to our terms and conditions and privacy policy.
While the rally is substantial, the HYPE price still trades at the 0.618 Fibonacci retracement resistance level, so the upward movement may be corrective until the price decisively closes above this level.
Nevertheless, the wave count and indicator readings support the possibility of a breakout.
According to the count, the HYPE price has completed an A-B-C correction (red), where waves A and C have nearly the same length.
Then, a bullish divergence in the Relative Strength Index (RSI) preceded the rally, which was followed by a bullish cross (black circle) in the Moving Average Convergence/Divergence (MACD).
So, the wave count gives a bullish HYPE prediction, suggesting that the price will eventually close above $49.45 and move to new highs.
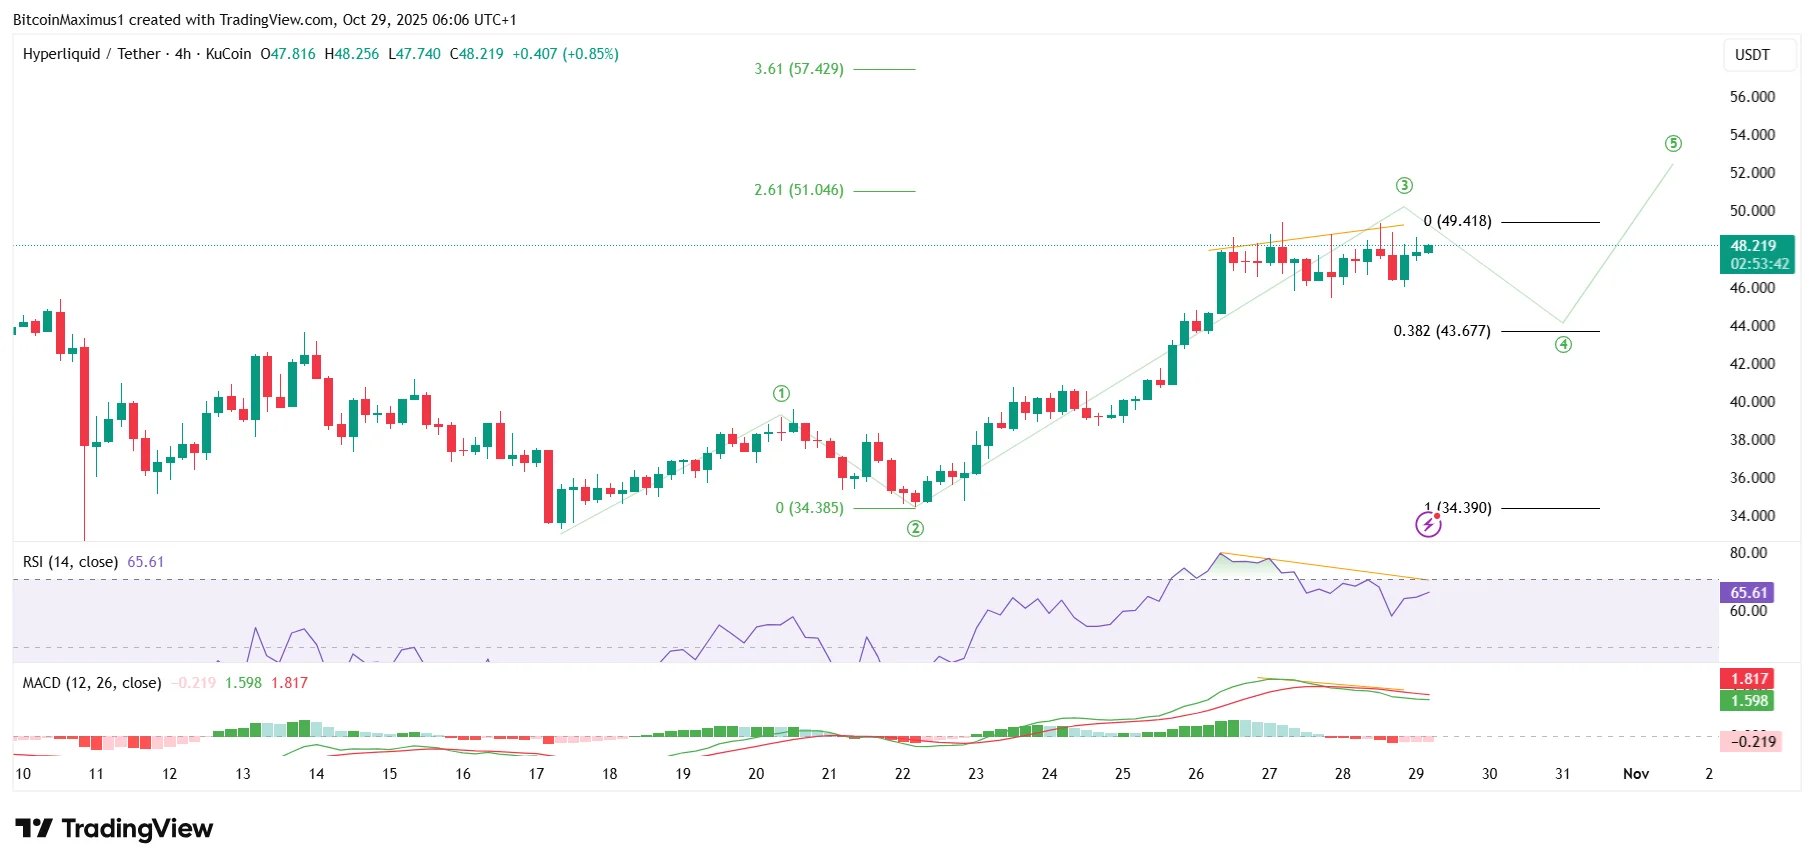
However, the short-term outlook suggests a retracement is due. Since the five-wave upward movement (green) started, the price of Hyperliquid has completed wave three in this rally.
Wave three is extended and 2.61 times longer than wave one. This is a common level for a local top, and the bearish divergences in the RSI and MACD (orange) support it.
If the count plays out, the price will fall and complete wave four near $44 before eventually resuming its upward trend.
Hyperliquid’s Technical Analysis
Hyperliquid’s long-term trend still leans bullish, though this week’s movement will be critical to determine if the future trend is bullish or bearish.
Today, the Hyperliquid price trades inside the $50 horizontal resistance area. The road to a new all-time high will be clear if it successfully breaks out.
However, the main bearish sign from the weekly time frame is the breakdown from the long-term ascending support trend line, which has existed since April.
Nevertheless, with the bullish daily readings and the increasing RSI, the price of Hyperliquid is likely to break out and surge to new highs.
Critical Breakout to ATH
With a confirmed wedge breakout, bullish wave structure, and strengthening RSI, Hyperliquid’s recovery looks technically solid.
A clean move above $50 could open the door for new record highs, but short-term retracements remain possible as indicators cool off.
If HYPE holds the key support near $44, it may be setting up for another explosive upward leg.
Disclaimer:
The information provided in this article is for informational purposes only. It is not intended to be, nor should it be construed as, financial advice. We do not make any warranties regarding the completeness, reliability, or accuracy of this information. All investments involve risk, and past performance does not guarantee future results. We recommend consulting a financial advisor before making any investment decisions.
Valdrin Tahiri is a cryptocurrency analyst and reporter at CCN, specializing in technical analysis with a focus on Elliott Wave theory, on-chain metrics, and fundamental research. He brings over seven years of experience in the crypto space as both a trader and writer.
He discovered cryptocurrencies in 2017 while earning his MSc in Financial Markets at the Barcelona School of Economics, which sparked a deep interest in blockchain and market dynamics. Since then, he’s contributed to top crypto outlets like BeInCrypto and CoinGape.
Valdrin also served as Community Manager of BeInCrypto’s Telegram group for three years, helping grow it into one of the largest crypto communities worldwide. His expertise in market structure and price patterns allows him to break down complex trends into clear, actionable insights.
He’s published thousands of articles covering altcoins, Bitcoin cycles, and macro trends.