Why The Crypto Market Fall is Nothing to Worry About | Credit: Hameem Sarwar
Share
Key Takeaways
Bitcoin’s (BTC) price created a bearish engulfing candlestick.
The Crypto Market (TOTALCAP) is retesting its previous all-time high.
BNB hit a new all-time high despite the crypto market correction.
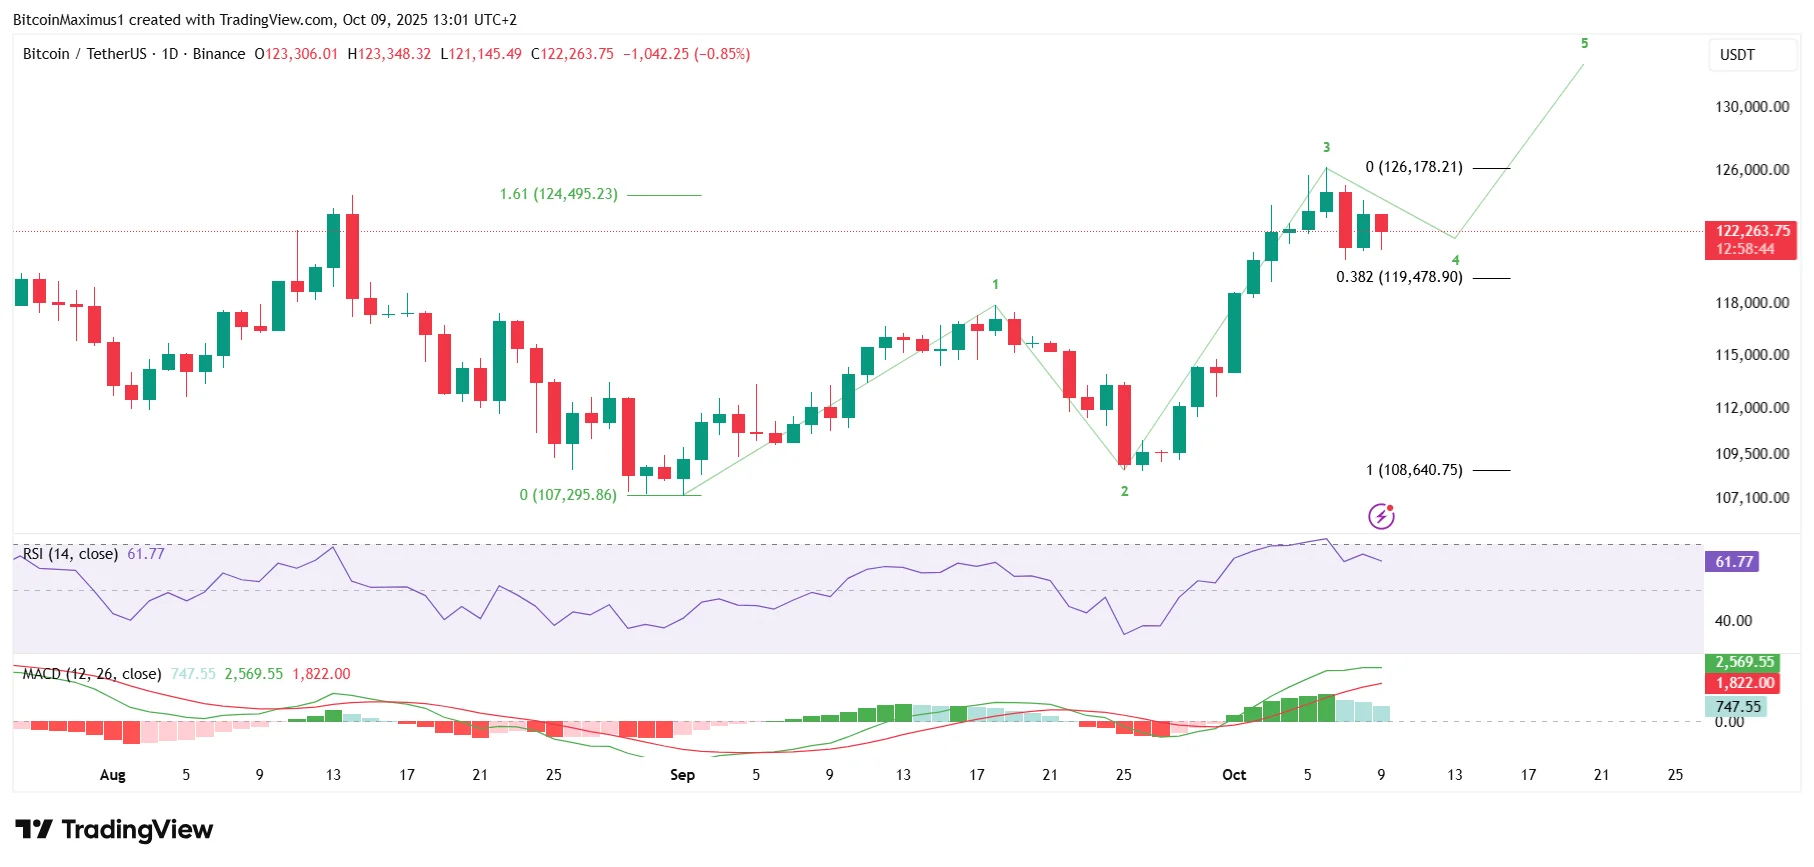
On October 6, the Bitcoin (BTC) price reached a new all-time high of $126,199, and the rest of the cryptocurrency market followed suit.
However, this week’s sudden decline has wiped out a significant portion of the gains, creating worry that the trend might be over.
With that in mind, let’s analyze the charts and determine why the crypto market is down today.
Bitcoin Price Declines
As the most prominent cryptocurrency, Bitcoin’s price movement has a significant impact on the rest of the cryptocurrency market.
Considering that, the bearish engulfing candlestick on Oct. 7 caused the rest of the crypto market to decline.
In the context of the long-term movement, however, the drop is nothing to worry about.
Get These Top Crypto Casino Offers Now!
Sponsored
Disclosure
We sometimes use affiliate links in our content, when clicking on those we might receive a commission at no extra cost to you. By using this website you agree to our terms and conditions and privacy policy.
Bitcoin’s price began an impulsive movement on Sept. 1. The second portion of the rally started on Sept. 25, and a correction is expected after 11 days of an upward trend.
The lack of a bearish divergence in the Relative Strength Index (RSI) and Moving Average Convergence/Divergence (MACD) also supports the hypothesis that the decline is temporary.
According to the count, the BTC price is finishing wave four in a five-wave upward movement.
Since wave two was sharp and deep, a gradual sideways consolidation for wave four is the most likely future outlook.
As a result, the BTC price might have already bottomed, possibly creating a symmetrical triangle, or fall to the 0.382 Fibonacci support level in its worst-case scenario.
Why is the Crypto Market Down?
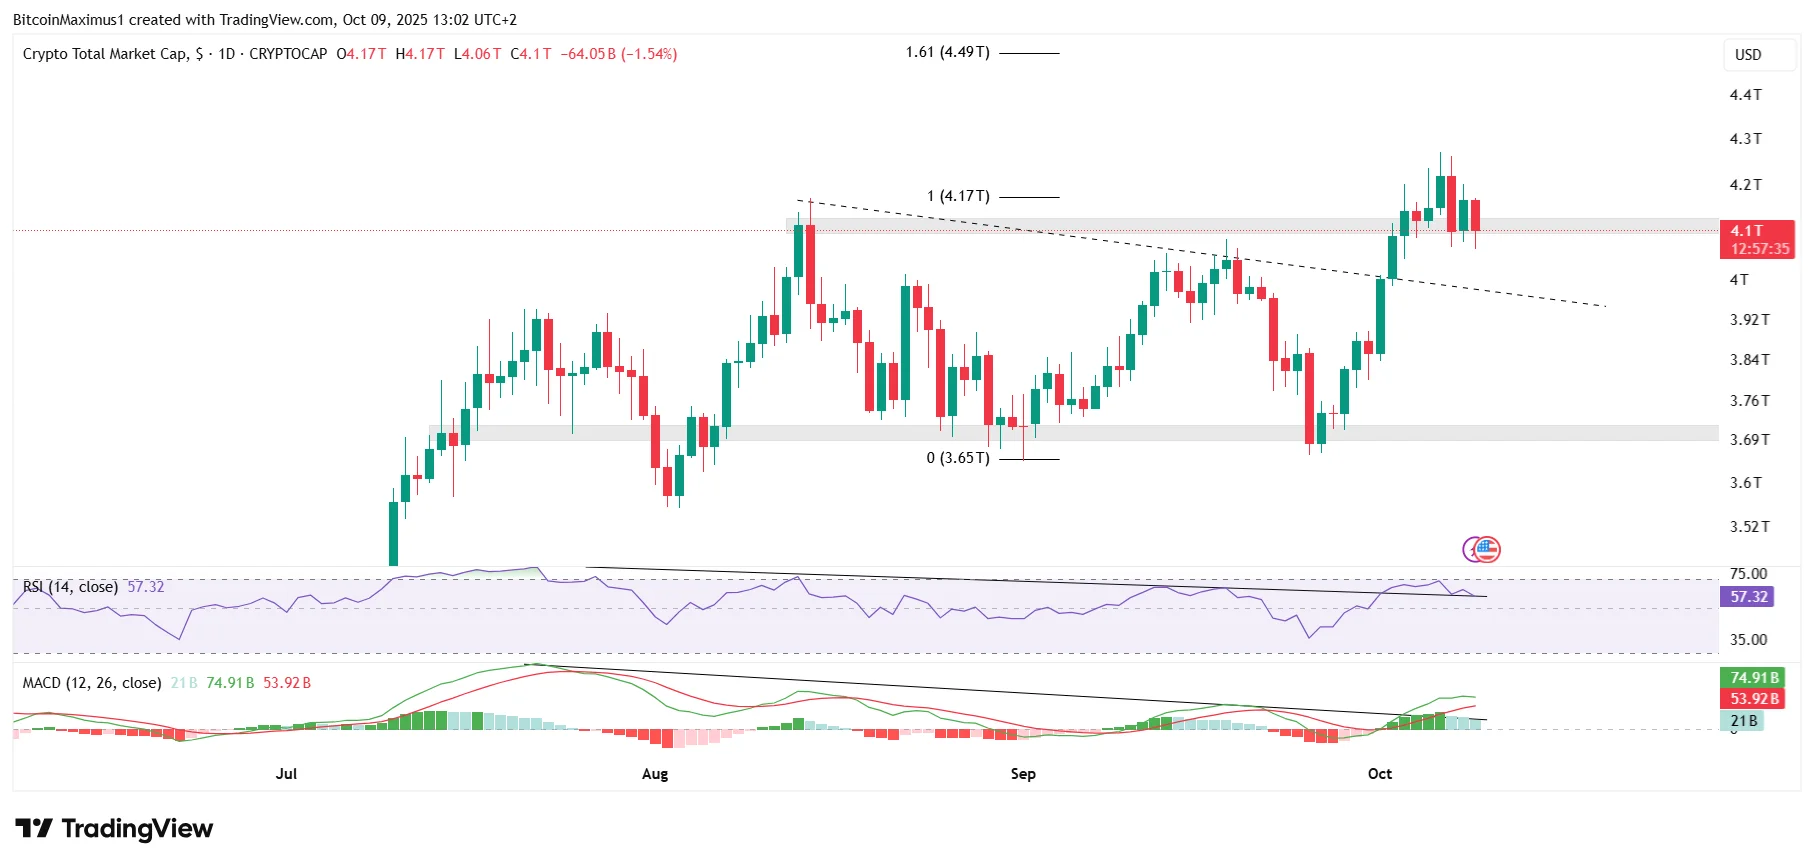
The Total Crypto Market (TOTALCAP) chart also suggests that the downward movement is temporary rather than the start of a longer-term trend reversal.
Even though TOTALCAP created a bearish engulfing candlestick on Oct. 8, it still trades inside the previous all-time high support at $4.12 trillion.
As long as TOTALCAP trades inside the level, the decline is simply a retest of the breakout level and will lead to higher prices.
Momentum indicators support this bullish prediction. The RSI and MACD have broken out from their diagonal resistances and retested them as support.
As a result, even though the crypto market is down today, the charts suggest the decline is temporary.
BNB Price Hits All-Time High
Even though the crypto market is down, some altcoins are still surging to new highs.
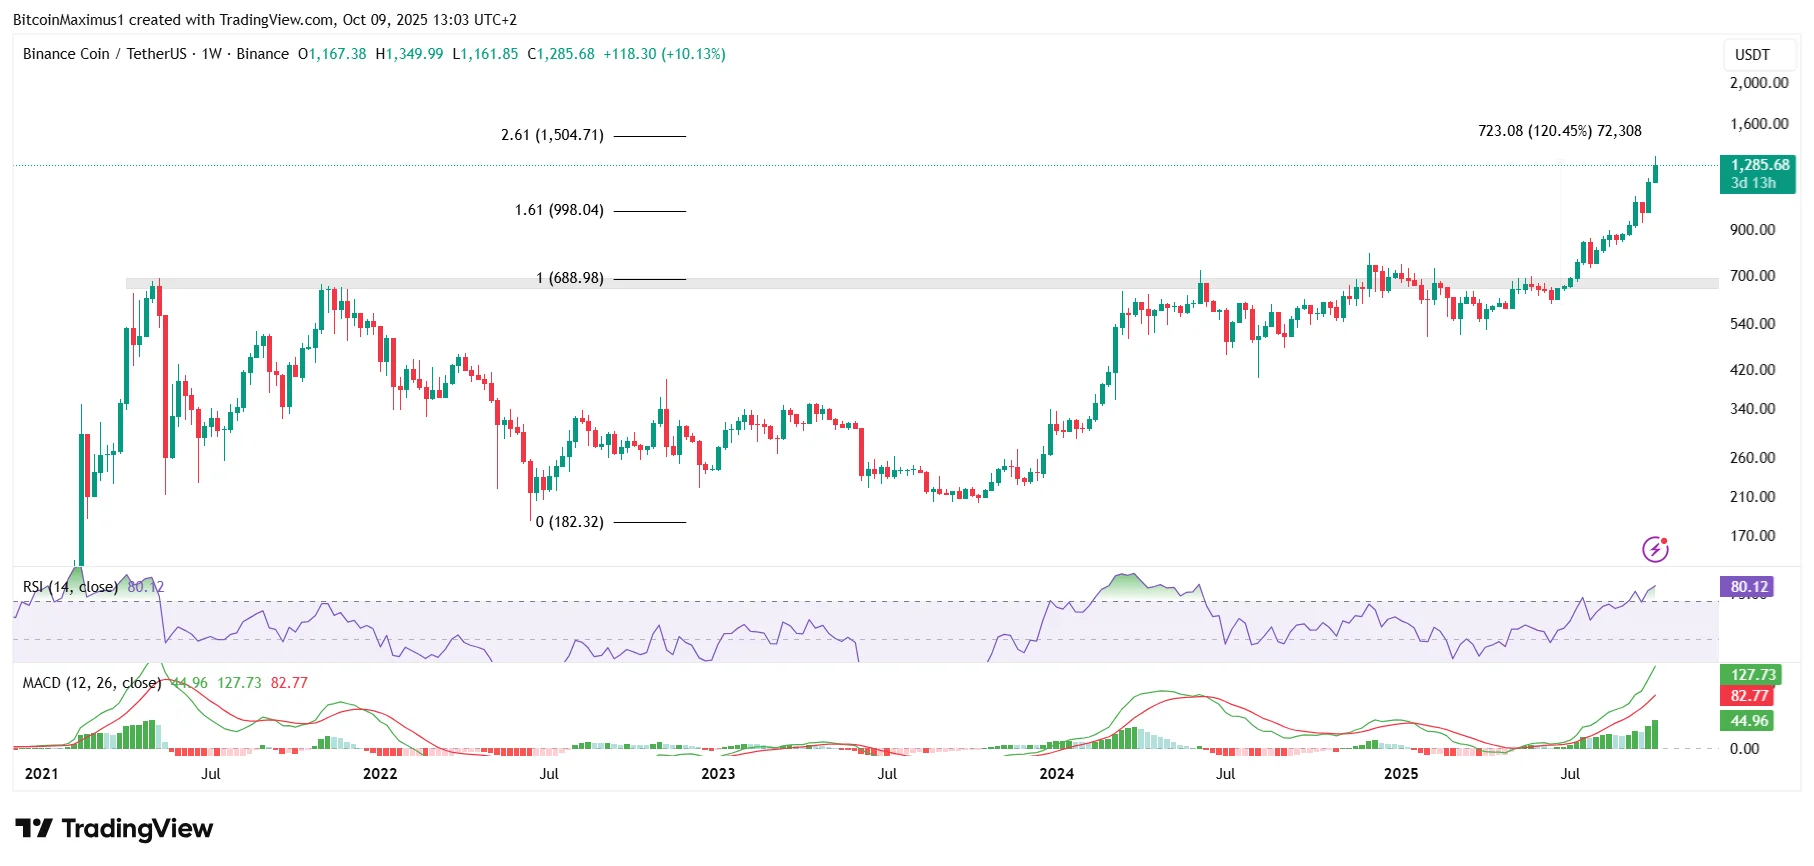
BNB is leading the way,with a 120% increase since June and a new all-time high of $1,349 this week.
The BNB rally became parabolic once the price broke out from the $670 resistance area, clearing the 1.61 external Fibonacci retracement level at $998 without any trouble.
BNB is quickly approaching the $1,500 resistance, which was created by the 2.61 external Fibonacci retracement and could represent a temporary local top.
The weekly time frame RSI and MACD have not generated any bearish divergences, so the BNB price increase might not stop anytime soon.
Final Thoughts
Despite the sharp pullback, Bitcoin’s correction looks more like a healthy pause than a trend reversal.
The broader crypto market still holds its key support levels, suggesting the rally has room to continue.
Meanwhile, BNB’s record-breaking surge highlights the strength of select altcoins even in a cooling market.
Overall, the charts point toward a temporary dip rather than the end of the bull run.
Disclaimer:
The information provided in this article is for informational purposes only. It is not intended to be, nor should it be construed as, financial advice. We do not make any warranties regarding the completeness, reliability, or accuracy of this information. All investments involve risk, and past performance does not guarantee future results. We recommend consulting a financial advisor before making any investment decisions.
Valdrin Tahiri is a cryptocurrency analyst and reporter at CCN, specializing in technical analysis with a focus on Elliott Wave theory, on-chain metrics, and fundamental research. He brings over seven years of experience in the crypto space as both a trader and writer.
He discovered cryptocurrencies in 2017 while earning his MSc in Financial Markets at the Barcelona School of Economics, which sparked a deep interest in blockchain and market dynamics. Since then, he’s contributed to top crypto outlets like BeInCrypto and CoinGape.
Valdrin also served as Community Manager of BeInCrypto’s Telegram group for three years, helping grow it into one of the largest crypto communities worldwide. His expertise in market structure and price patterns allows him to break down complex trends into clear, actionable insights.
He’s published thousands of articles covering altcoins, Bitcoin cycles, and macro trends.