Here's When the PI Price Decrease Will End | Credit: Hameem Sarwar
Share
Key Takeaways
Pi Network (PI) failed to break out from a 250-day resistance trend line.
PI completed a corrective A-B-C structure before the failed breakout.
Can PI eventually break out, or will it fall to new lows?
Pi Network (PI) continues to struggle under a long-term resistance trend line that has existed for over 250 days.
After a more than 90% decline since its all-time high, PI has made several unsuccessful breakout attempts.
Despite a brief recovery that made bulls hopeful, the trend cannot be considered bullish until PI breaks out.
Let’s examine the charts and figure out if that will happen.
Pi Network’s Technical Analysis
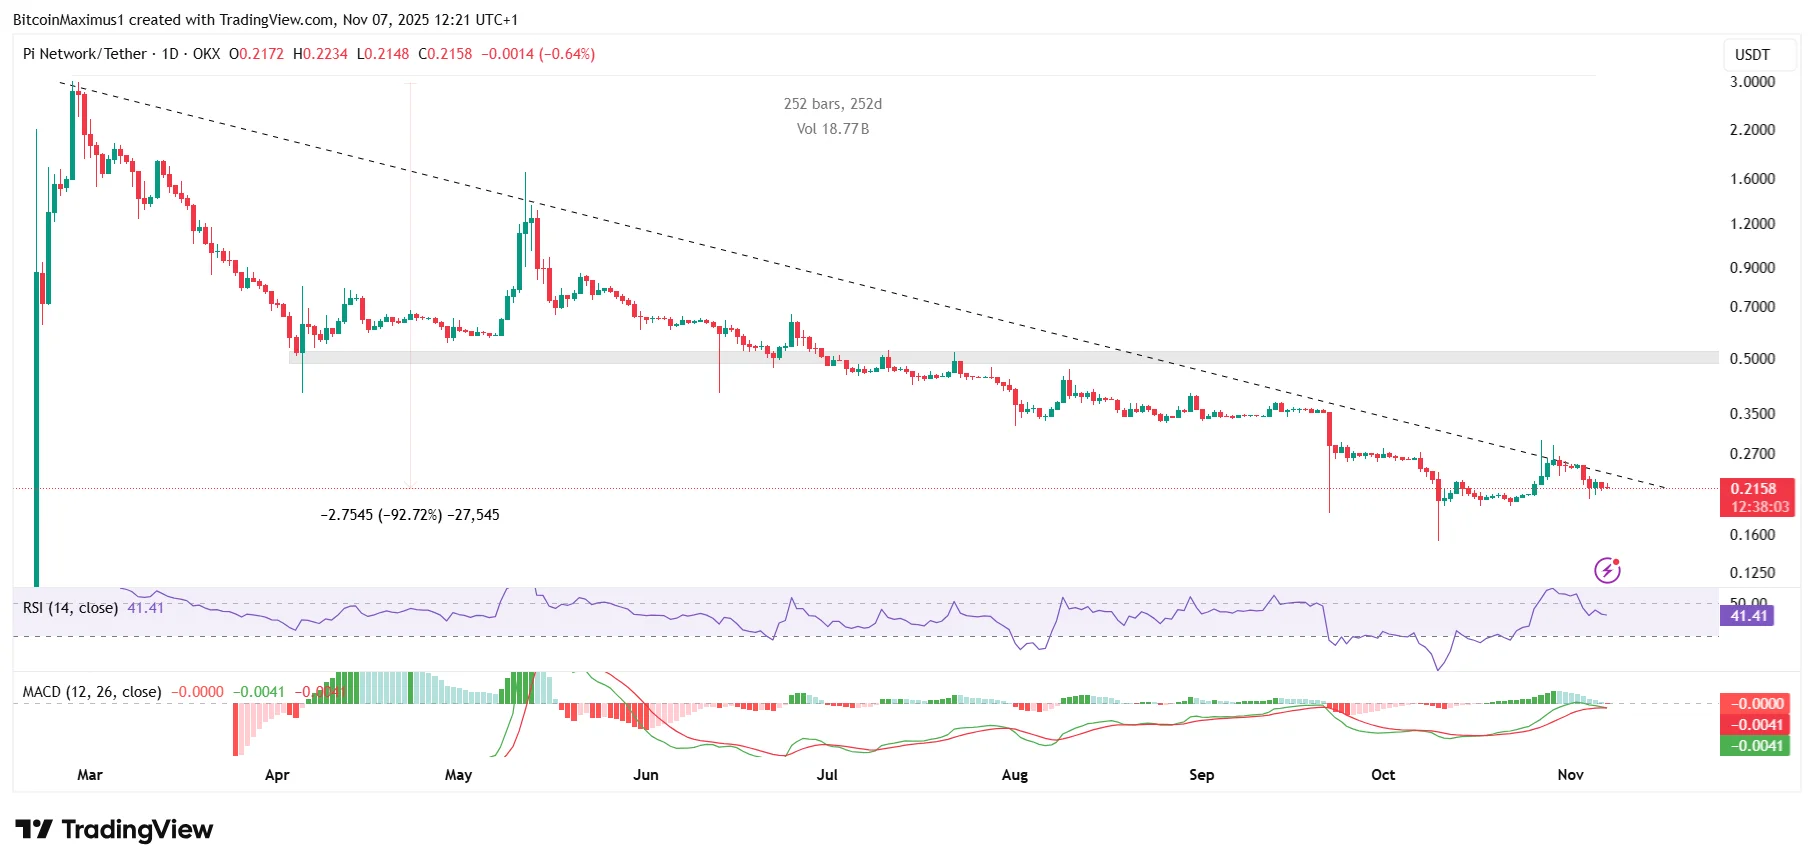
Since its all-time high of $3 in February, the PI price has fallen under a diagonal resistance trend line.
Until now, the price of Pi Coins has fallen by more than 93%. PI reached an all-time low of $0.153 but bounced, creating a long lower wick (green icon).
After the bounce, PI created a higher low and unsuccessfully attempted to break out from the resistance trendline, which had existed for more than 250 days.
Get These Top Crypto Casino Offers Now!
Sponsored
Disclosure
We sometimes use affiliate links in our content, when clicking on those we might receive a commission at no extra cost to you. By using this website you agree to our terms and conditions and privacy policy.
Even though the Relative Strength Index (RSI) and Moving Average Convergence/Divergence (MACD) are increasing, neither is above its bullish threshold.
The RSI is at 50 while the MACD is at 0. The indicators crossed their resistances last week but have failed to sustain their momentum because of the failed breakout.
As a result, the PI price prediction is still unclear and depends on whether the price will break out from its descending resistance trend line.
Will Pi Network Break Out?
The six-hour time frame price action leans bearish, suggesting that PI will not break out.
This is because of the corrective, A-B-C structure (red) created after the Oct. 10 bounce, defined by the symmetrical triangle in wave B.
Waves A and C had the same length, so the upward movement has likely ended.
If the downward movement continues, the next closest support will be at $0.190, the final horizontal support area before the all-time low.
PI Breakout Unlikely
Overall, Pi Network’s current price remains below critical resistance.
A successful breakout above resistance could push PI toward the $0.50 level, but failure to regain momentum may lead to a retest of lower supports near $0.190 or even new all-time lows.
Disclaimer:
The information provided in this article is for informational purposes only. It is not intended to be, nor should it be construed as, financial advice. We do not make any warranties regarding the completeness, reliability, or accuracy of this information. All investments involve risk, and past performance does not guarantee future results. We recommend consulting a financial advisor before making any investment decisions.
Valdrin Tahiri is a cryptocurrency analyst and reporter at CCN, specializing in technical analysis with a focus on Elliott Wave theory, on-chain metrics, and fundamental research. He brings over seven years of experience in the crypto space as both a trader and writer.
He discovered cryptocurrencies in 2017 while earning his MSc in Financial Markets at the Barcelona School of Economics, which sparked a deep interest in blockchain and market dynamics. Since then, he’s contributed to top crypto outlets like BeInCrypto and CoinGape.
Valdrin also served as Community Manager of BeInCrypto’s Telegram group for three years, helping grow it into one of the largest crypto communities worldwide. His expertise in market structure and price patterns allows him to break down complex trends into clear, actionable insights.
He’s published thousands of articles covering altcoins, Bitcoin cycles, and macro trends.