Key Takeaways
- Chainlink reached its yearly peak at $23, followed by a 48% drop.
- There was a recovery, but the future market direction is uncertain.
- LINK’s price action may signal start of a larger uptrend.
The price of Chainlink made its yearly high of $23 on March 11, after which we saw a notable downturn. It fell by 48%, dipping just below $12 on April 13 – values last seen in January. A recovery followed, pushing the price to $16 yesterday, April 23, increasing by 27%.
On April 23, LINK was trading slightly lower, posing a question – is the bearish period behind us, or was this recovery a reaction to an overly sold price?
Chainlink On-chain Data
As Chainlink‘s price increased, investors who had regained their profits may be inclined to sell to secure their gains. The recent market correction lowered the percentage of the total LINK addresses in profit.
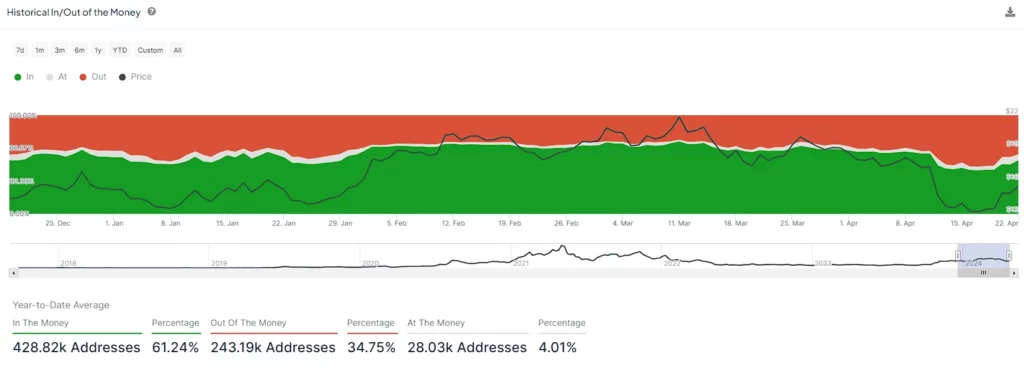
Looking at the historical in/out of money graph, we can see a decline in profitability following LINK’s price decline from $18 on April 8, when 36% were out of money, to 52% on April 15, when LINK fell to $13.
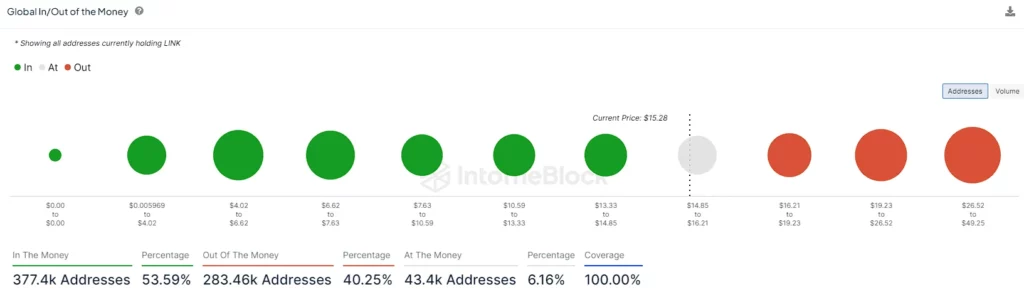
There are still slightly more profitable addresses than unprofitable ones, with 53.56% being in the money compared to 40% out of money. In the graph below, we can see that there is a significant cluster around the $16 mark, which can indicate potential selling pressure.
LINK Price Analysis
LINK‘s value soared to $22.50 on March 11, marking an impressive 81% climb from its $12.50 low on January 8. Before this surge, the cryptocurrency had hovered at approximately $15 since November.
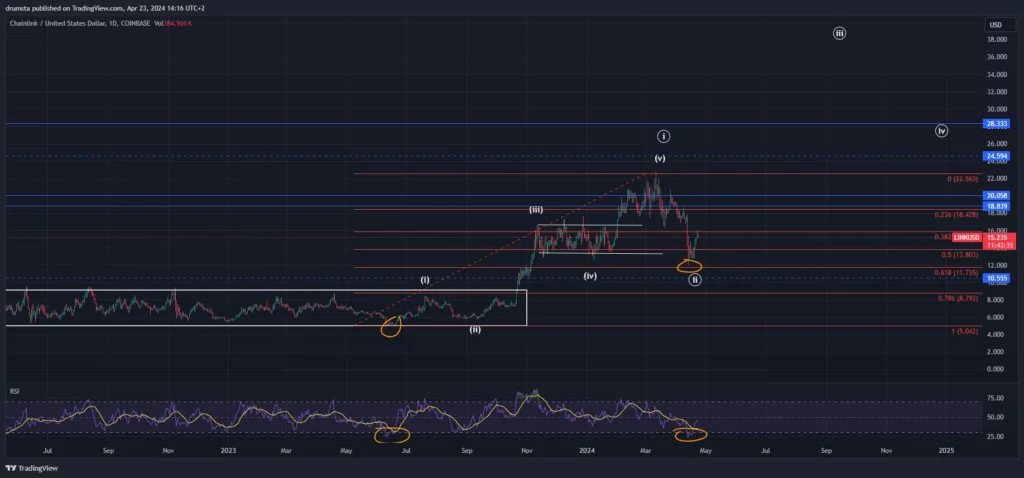
The bullish momentum for Chainlink kicked off when it surged past the $9 mark on October 9 of the previous year. The current wave pattern suggests that it may have completed an initial five-wave sequence of this significant bullish phase.
This is why the following downturn could be labeled as its first bull market correction. Here, wave structure, Fibonacci levels, and the daily chart RSI all confirm the assumption. We saw the price bouncing from the 0.618 Fibonacci level, a typical ending point of wave two in a five-wave advancement.
The daily chart Relative Strength Index fell to its lower bound, touching the oversold conditions. A similar thing happened in June when LINK started its primary uptrend. With the price increasing from April 13 low of $12, there are many indications that it started its larger third wave, which has the potential to bring the price to a new yearly high above $30.
However, to receive a stronger confirmation, a push is needed above $17. This would be above the horizontal zone from mid-November 2023 to January 31, 2024. If LINK manages to break this resistance it would be a clear signal of the next starting uptrend.
Disclaimers
Please note that the contents of this article are not financial or investing advice. The information provided in this article is the author’s opinion only and should not be considered as offering trading or investing recommendations. We do not make any warranties about the completeness, reliability and accuracy of this information. The cryptocurrency market suffers from high volatility and occasional arbitrary movements. Any investor, trader, or regular crypto users should research multiple viewpoints and be familiar with all local regulations before committing to an investment.

Nikola Lazic is a cryptocurrency analyst and investor working in the industry since 2017. He holds a bachelor's degree in Sociology, which enables him to better understand the psychology behind the crowd´s positioning. Consequently his preferred analytical tool is Elliott Wave Theory in combination with price action analysis.
Combining his experience in trading and investing with knowledge in content writing he strives to bring the most accurate and actionable information.
Expertise: Cryptocurrencies, Technical analysis, Elliott Wave Theory, On-chain metrics, Research reports.