Will Layer3 (L3) price resume the uptrend after today's decline | Credit: Veronica Cestari
Share
Key Takeaways
Layer3 surged about 180% on Sunday after breaking out of a consolidation pattern.
The token’s price dropped 14% shortly after the rally amid increased profit-taking.
If L3 holds above key support and breaks the $0.022 resistance, it could continue the rally.
The weekend belonged to Layer3 (L3) bulls. But as it stands, Monday seems to belong to profit-takers.
At the time of writing, the Layer3 token has fallen by 14% in the last 24 hours. This happened shortly after the altcoin’s explosive rally on Sunday, which saw it rise 180% from its all-time low.
However, the analytical question the 14% drop raises is not whether it hurts. But whether it represents the healthy consolidation, a deeper correction, or the first signal before the move higher.
How Layer3 Broke Out
On April 5, the Layer3 token price rallied to $0.019. For context, that was the highest level that altcoin had reached since November. 2025.
According to CCN’s findings, the breakout occurred amid speculation about a “Big Week” announcement. The price action also stemmed from the rumor that L3 would soon gain a spot listing on Coinbase.
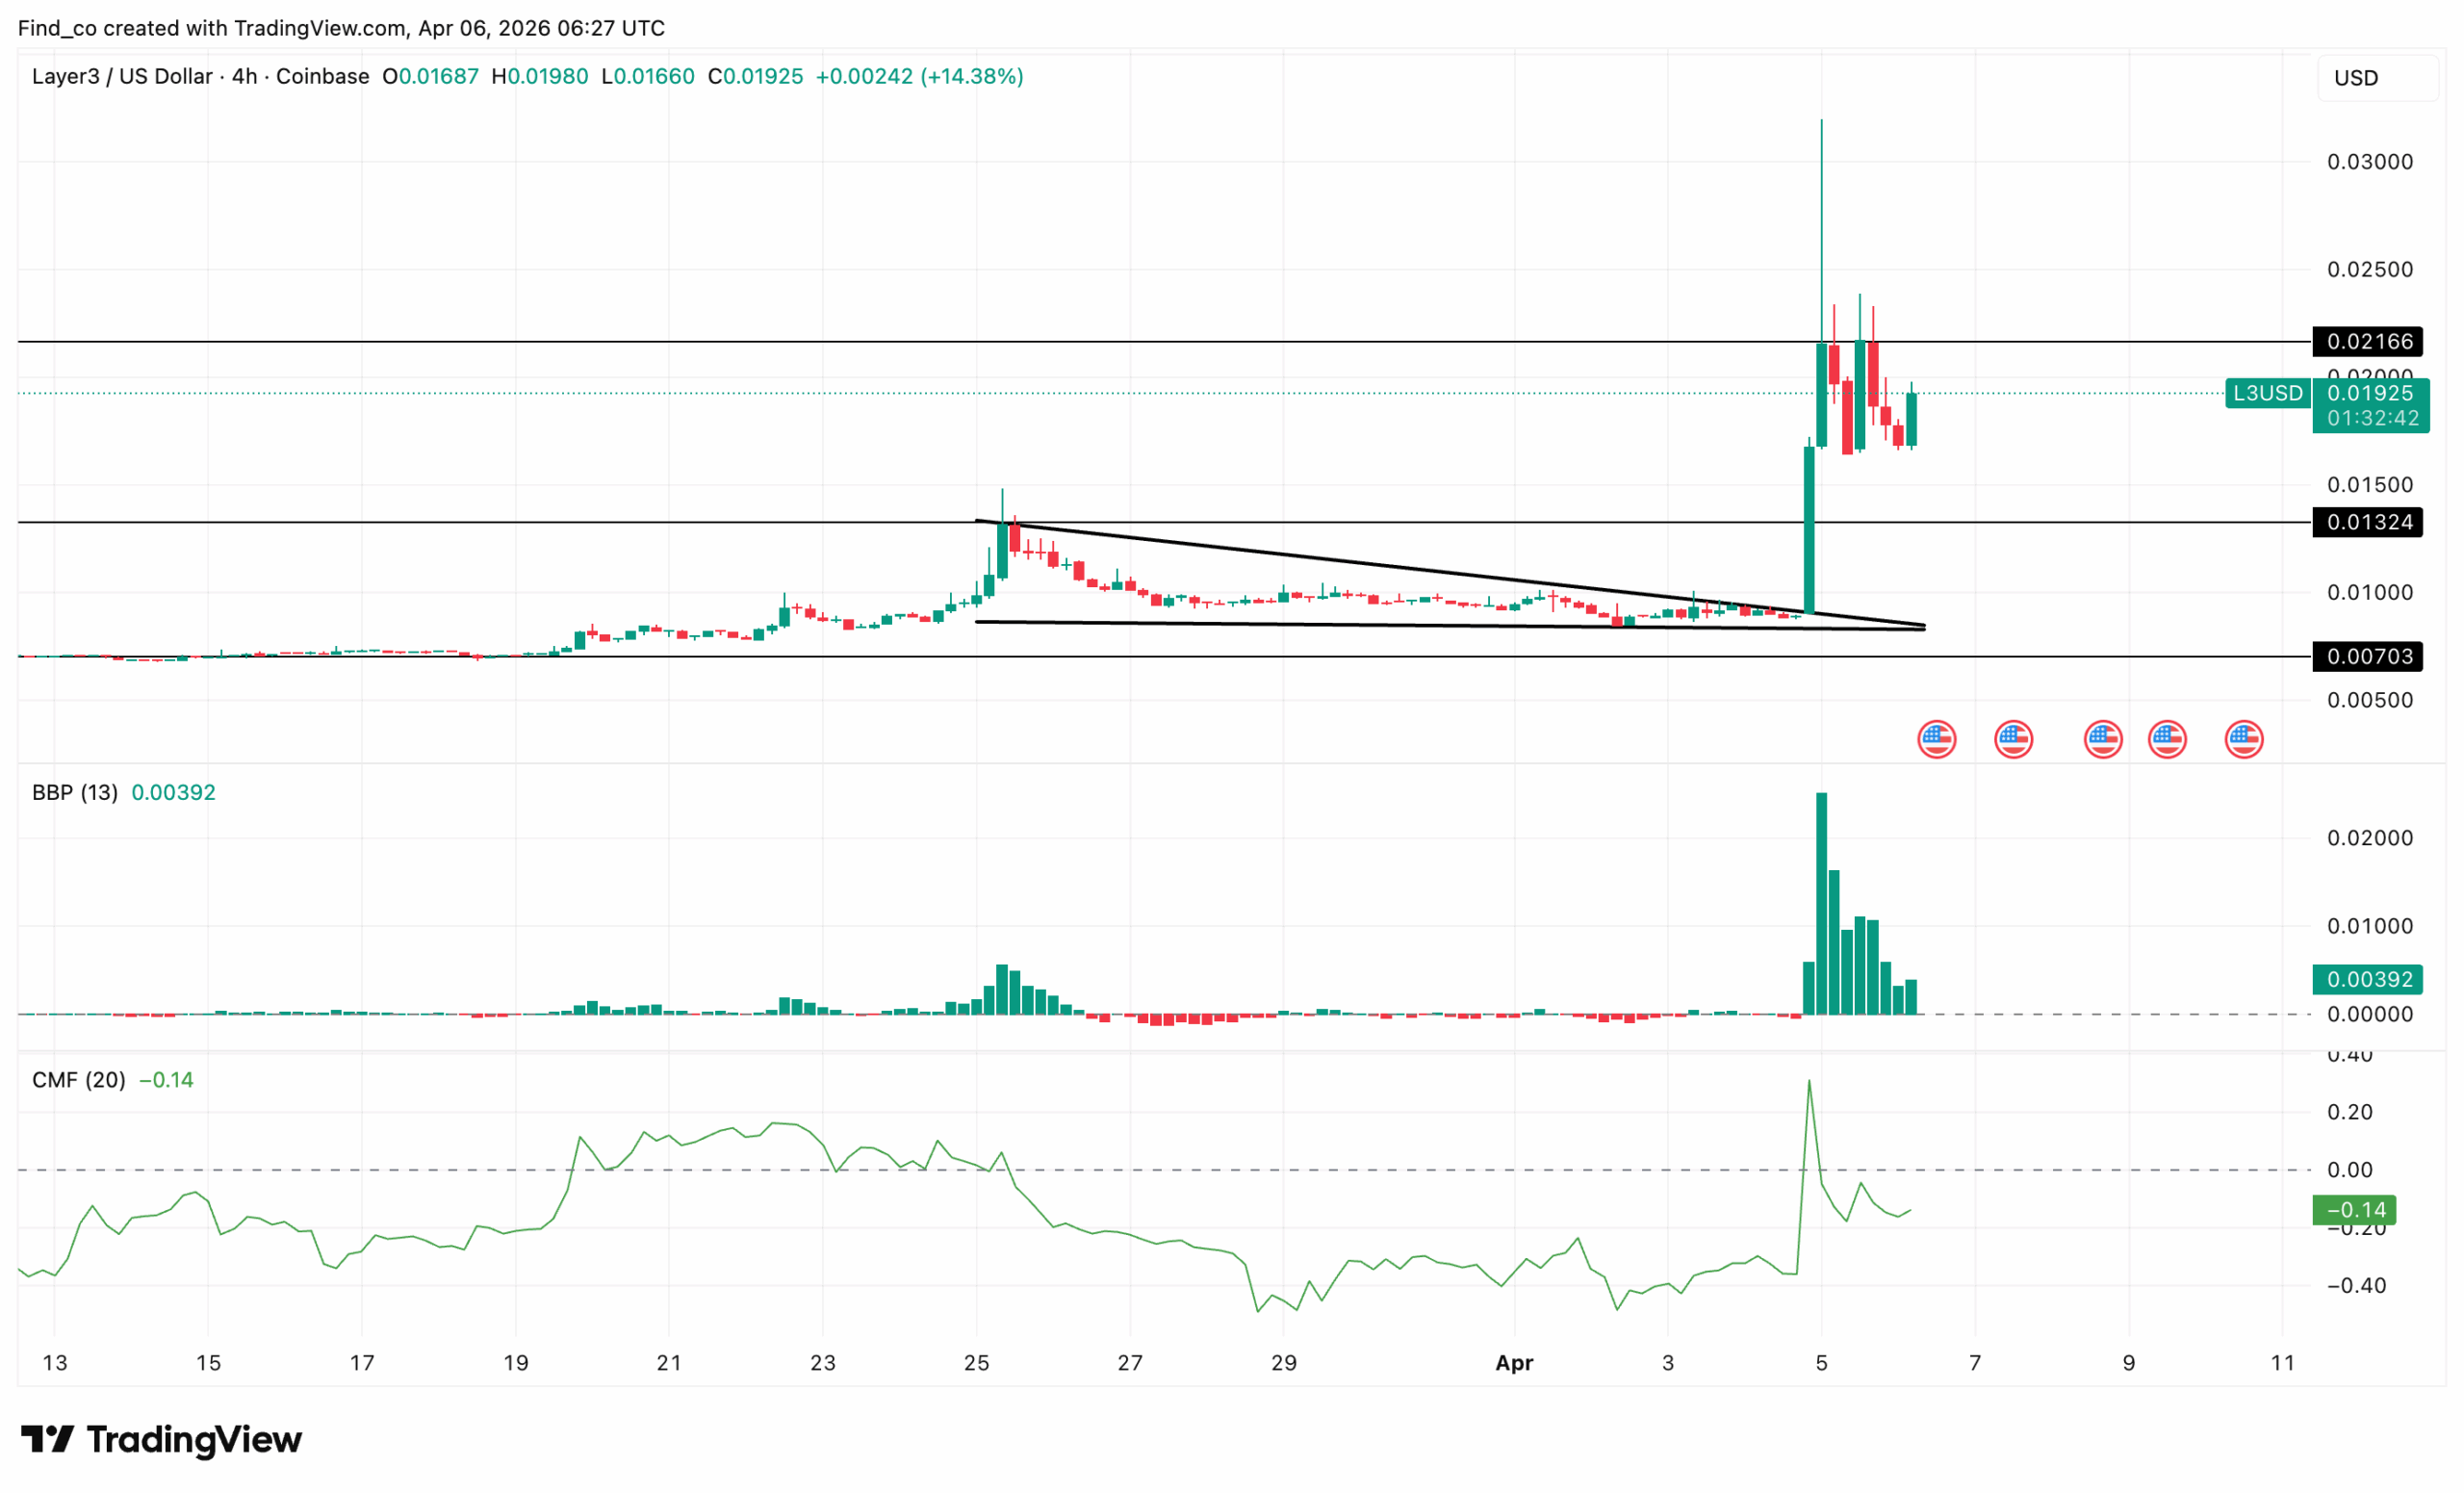
Amid that, the price action on the 4-hour chart shows a long period of compression.
As shown below, the L3 price traded inside a tightening wedge for weeks. Volatility declined, and price coiled near the $0.007 to $0.013 range.
Then the breakout occurred, driving the Layer3 token price above the wedge resistance. Moreover, it cleared the $0.013 level.
At the same time, the Bull Bear Power (BBP) indicator shows a sharp increase in buying pressure. This surge validates the breakout, as it is supported by strong participation.
Meanwhile, the L3 price quickly tested a higher resistance level, pushing toward the $0.022 zone.
This level now acts as the first major barrier, forming a short-term consolidation after the spike.
However, momentum remains elevated. Even after the pullback, Layer3’s price has held well above the breakout zone.
This suggests buyers are defending higher levels rather than exiting positions.
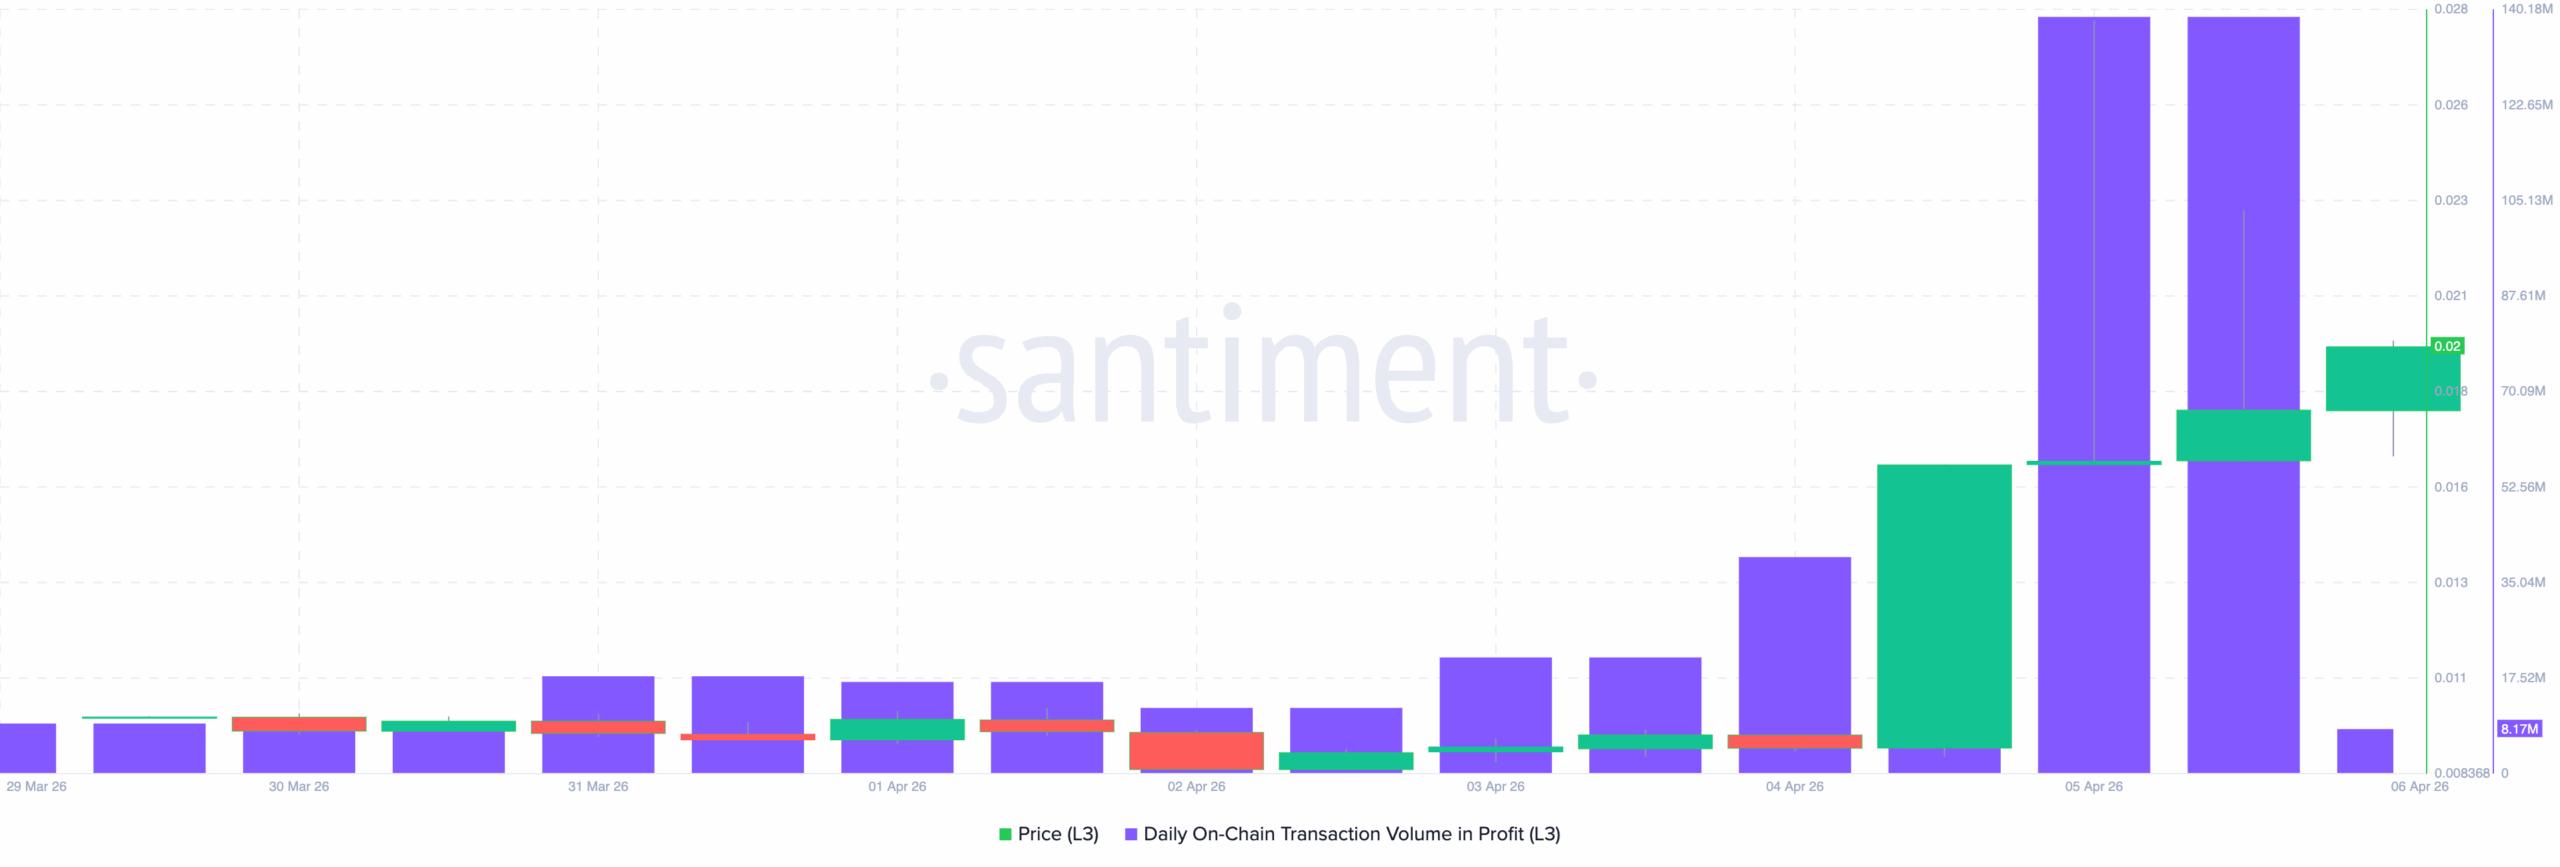
Notably, the volume of profit transactions remained relatively muted through late March. However, it began to rise steadily into early April.
This increase signaled that more holders moved into profitable positions.
Then, a major spike confirmed the move. Around April 5, profitable transaction volume surged dramatically. This spike aligned with the L3 price breakout.
But as that happened, the Layer3 price surge accelerated.
Meanwhile, the relationship between profit-taking and price became clear. As more transactions turned profitable, market participation increased.
Historically, this reinforces upward momentum, at least in the short term.
However, elevated profit activity also introduced risk. Historically, sharp spikes in realized profit often preceded short-term cooling.
Notably, after the peak in activity, volume dropped quickly. This suggested that the initial wave of profit realization had passed.
L3 On-Chain Transaction Volume in Profit | Credit: Santiment
At the same time, L3’s price began to stabilize rather than continue accelerating.
Looking ahead, if new demand emerges, the Layer3 token price could continue to rise. Otherwise, the market risked entering a period of consolidation after the spike.
L3 Price Prediction: Rally Not Done?
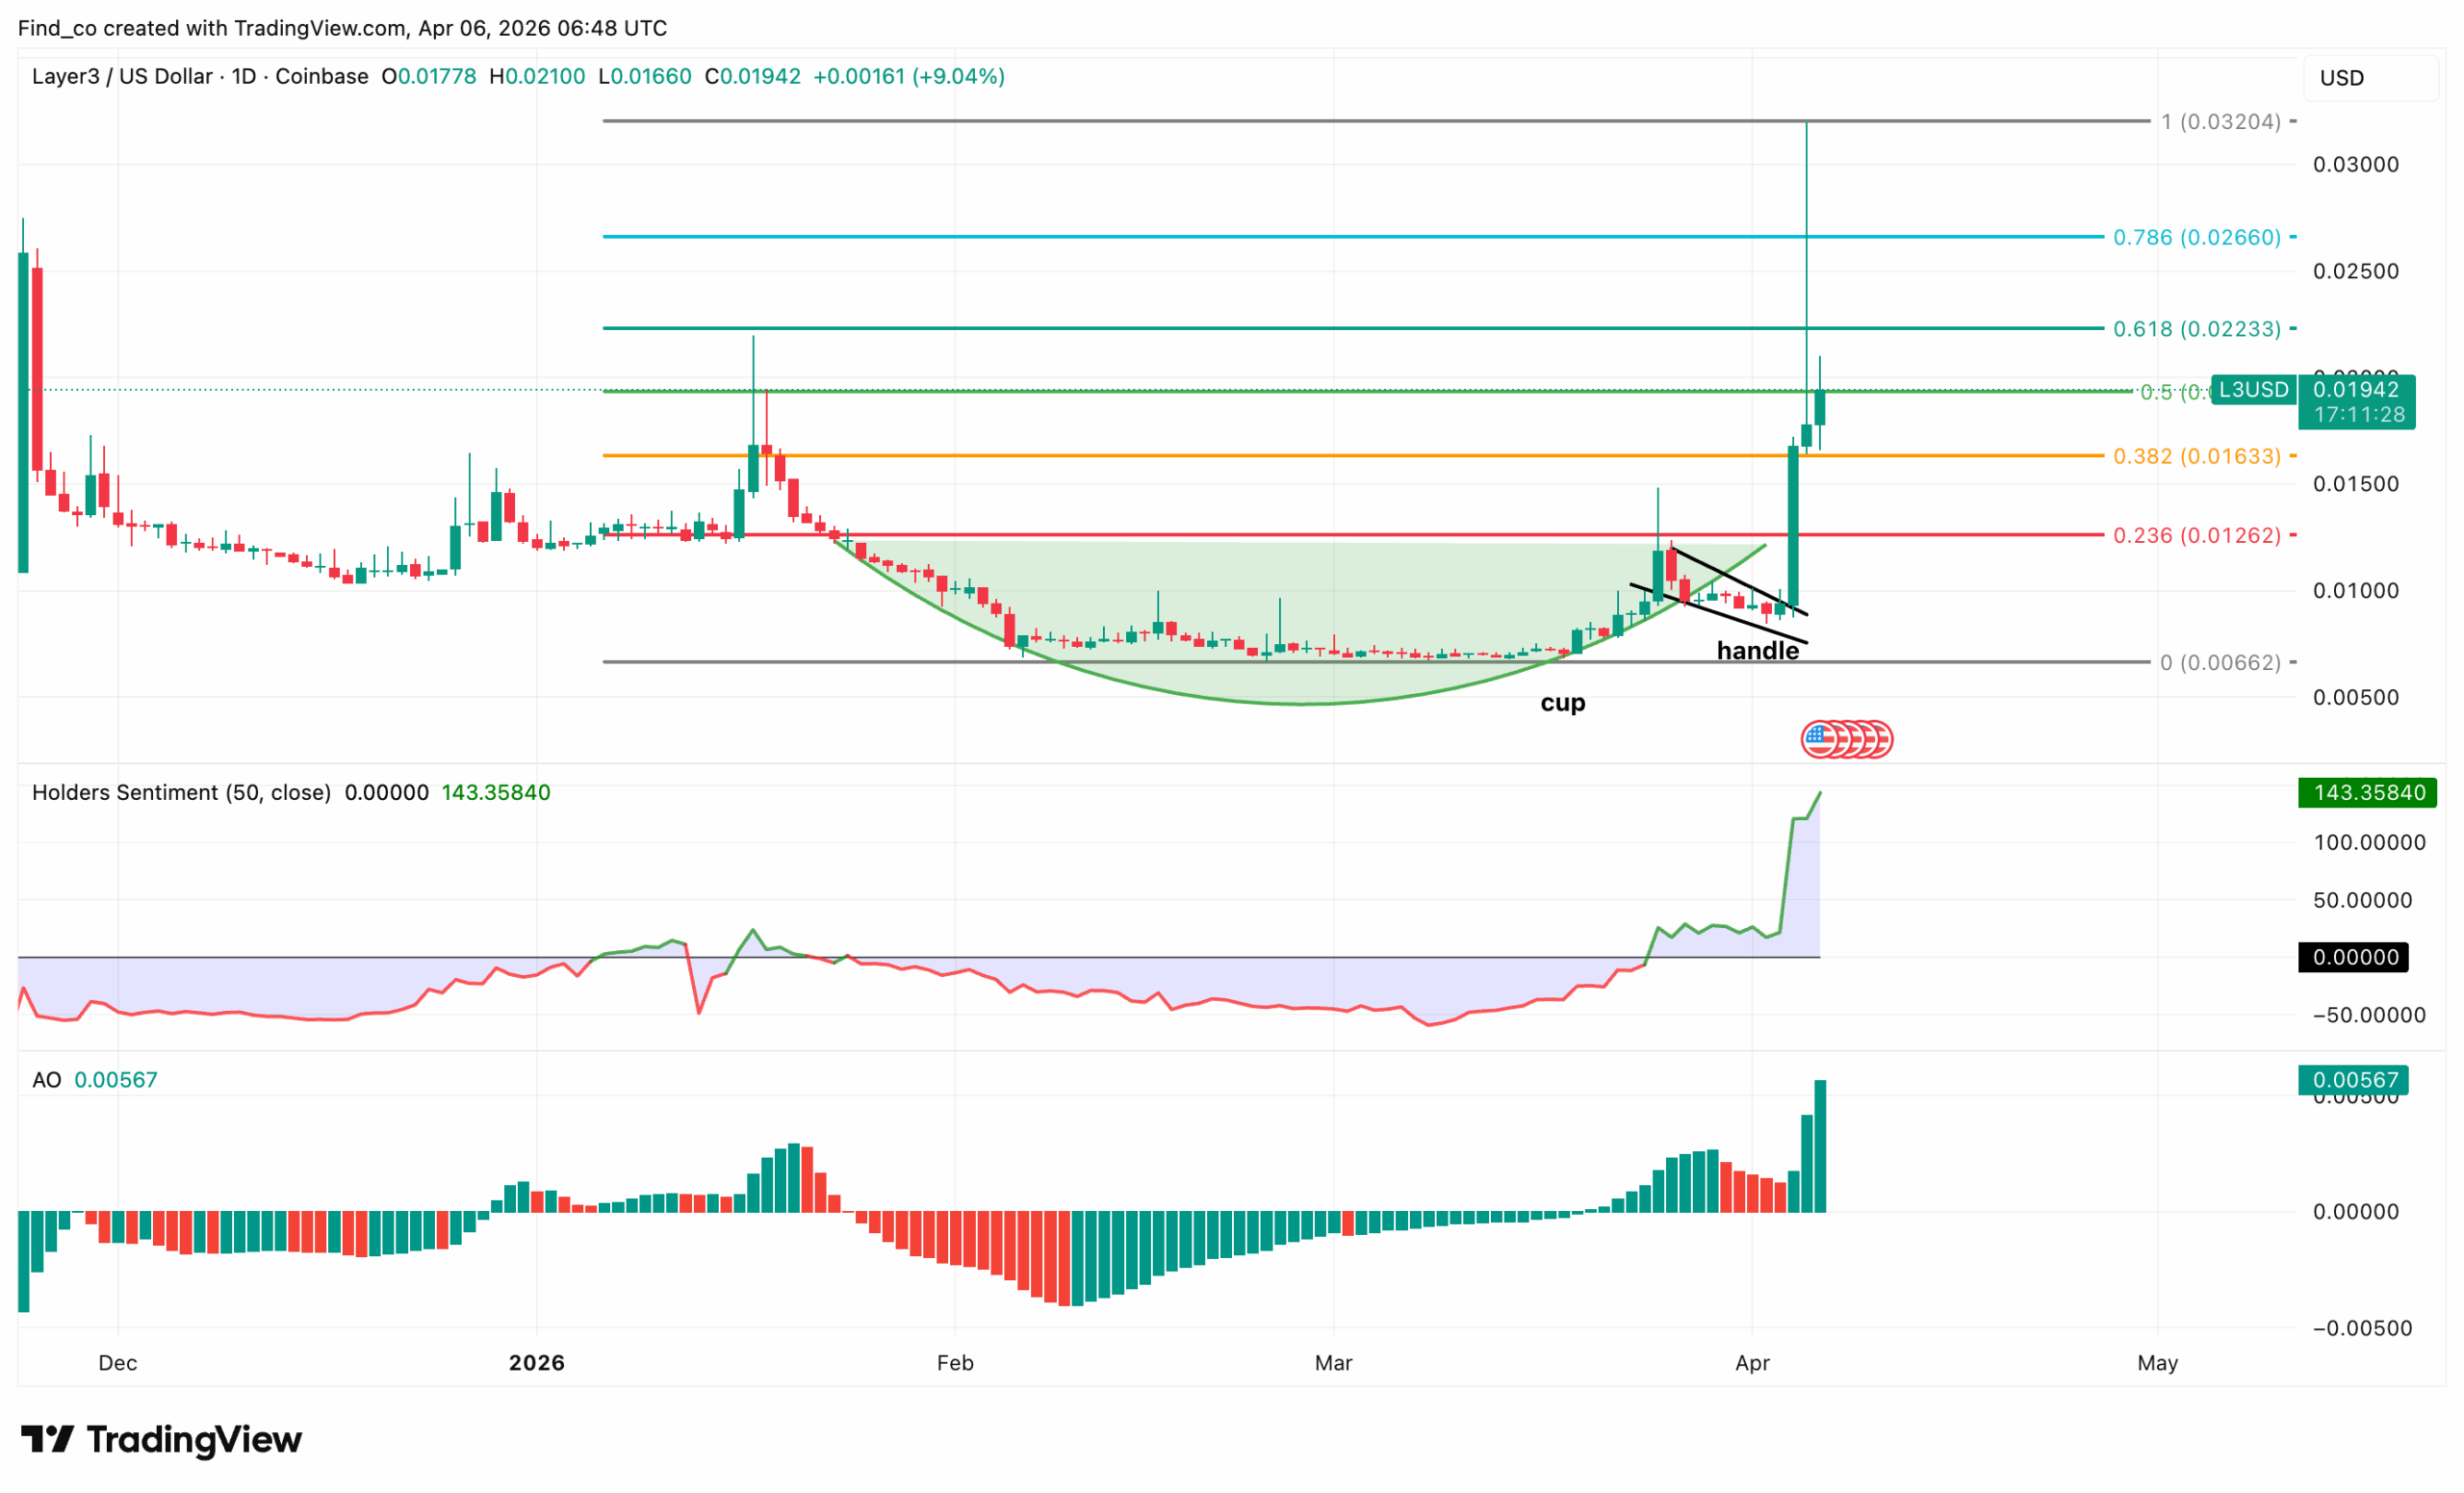
On the daily chart, the Layer3 token completed a bullish reversal pattern and broke out with strong momentum.
First, the chart showed a clear cup-and-handle formation. Price rounded out a long bottom through February and March.
Then, the handle formed near the resistance. Price consolidated just below the $0.013 zone. However, sellers failed to push it lower.
Next, the breakout occurred. As this happened, the L3 price surged above the handle, clearing the 0.236 and 0.382 Fibonacci levels.
At the same time, momentum indicators aligned with the move. The Awesome Oscillator (AO) flipped positive and accelerated higher.
Meanwhile, holder sentiment surged sharply. It moved from neutral/negative levels into strong positive territory. Importantly, this spike coincided with the breakout, suggesting rising confidence and participation.
Furthermore, as the rally approached the $0.022 zone, near the 0.5 and 0.618 levels, it became the next key barrier.
However, the move showed signs of short-term extension. The vertical rally and sentiment spike suggested elevated enthusiasm.
As a result, the altcoin risked entering a consolidation phase. However, as of this writing, the breakout level near $0.013 has become a strong support level.
So, as long as the L3 price holds above it, the bullish structure might remain intact.
On the upside, a break above $0.022 would have opened the path toward higher retracement levels. In that scenario, L3 might rise to the highest point of the wick at $0.032.
But to reach that point, it might need to break through the $0.027 resistance first.
However, if selling pressure increases, this outlook might change. If that were to happen, the Layer3 token price might slide to $0.016.
Disclaimer:
The information provided in this article is for informational purposes only. It is not intended to be, nor should it be construed as, financial advice. We do not make any warranties regarding the completeness, reliability, or accuracy of this information. All investments involve risk, and past performance does not guarantee future results. We recommend consulting a financial advisor before making any investment decisions.
Victor Olanrewaju is a crypto analyst and reporter at CCN with deep roots in on-chain research and technical analysis. His crypto journey began in 2017, but it was the 2020 Uniswap airdrop that sparked a full-time pivot into the space.
With a foundation in copywriting, Victor honed his craft creating high-converting content for leading crypto brokers — most notably an XRP price prediction that ranked #1 on Google during the 2021 bull run.
He later joined AMBCrypto in 2022, where he combined storytelling with technical and on-chain analysis to cover key market narratives.
In 2024, he expanded his expertise at BeInCrypto, collaborating with analysts and using tools like Glassnode, Santiment, and IntoTheBlock to break down Bitcoin and altcoin trends.
At CCN, Victor covers the top cryptocurrencies, memecoins, macro shifts, blending real-time insights with deep-dive metrics.
He holds a Bachelor’s degree in Physics from the University of Ibadan, equipping him to simplify complex data for a wide audience. Follow his work or connect on LinkedIn or X.