What's Behind the Bitcoin Crash? | Credit: Derek Fenech
Share
Key Takeaways
The Bitcoin (BTC) price fell 7% after its all-time high.
The BTC price is breaking down from an ascending wedge.
Can Bitcoin prevent another breakdown and return to its highs?
Bitcoin (BTC) reached a new all-time high of $124,517 on Aug. 14 but crashed afterward, falling by 7%. The sudden crash caused mass liquidations.
Bitcoin traders lost around $111 million, most from long positions. Ethereum (ETH) traders saw even heavier losses, at $211 million.
The liquidations also reset the funding rate, which had increased significantly over the past few weeks.
With BTC hovering above $115,000, let’s examine the charts to see if Bitcoin has started a bearish trend.
Bitcoin Crashes
The Bitcoin price began its bullish run this cycle in June 2022, at a low of $15,476.
After a 700% price increase, the rally led to a new all-time high of $124,474 last week.
Try Our Recommended Crypto Exchanges
Sponsored
Disclosure
We sometimes use affiliate links in our content, when clicking on those we might receive a commission at no extra cost to you. By using this website you agree to our terms and conditions and privacy policy.
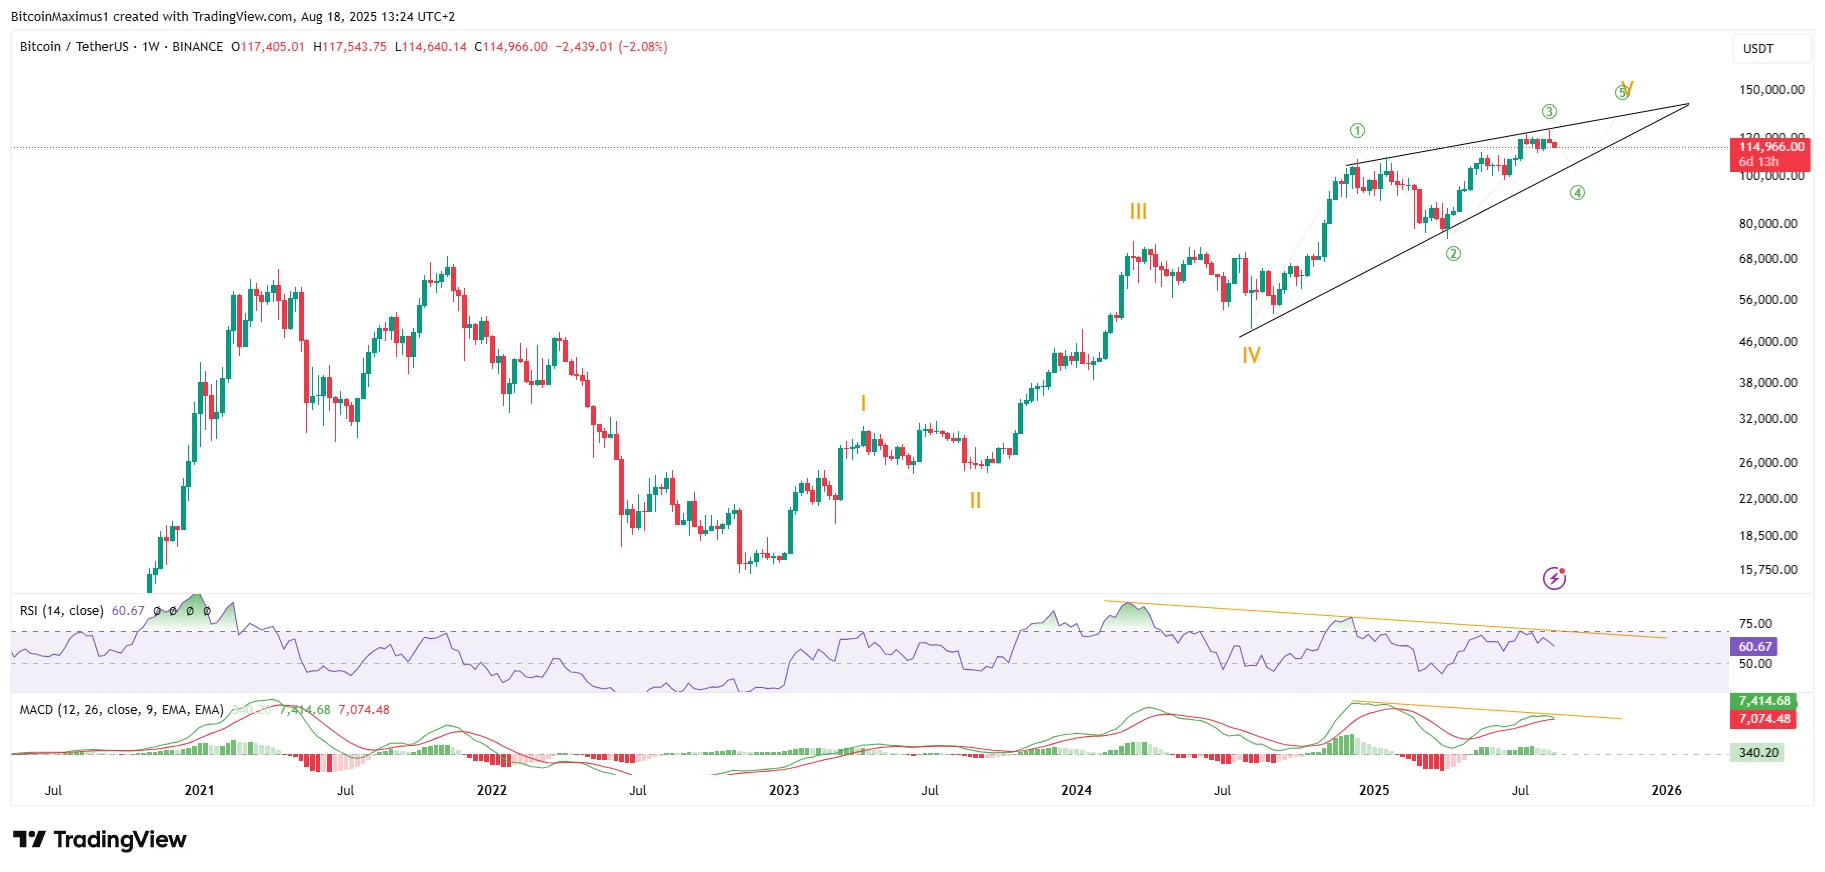
While the Bitcoin price increase has been parabolic at times, it has become much more gradual in the past 12 months.
Since Bitcoin started its fifth and final wave (orange) in July 2024, the price movement has created considerable overlap.
Combined with the ascending wedge shape, the BTC price may be in the fifth and final wave of an ending diagonal, ending the entire bull cycle.
BTC Weekly Movement | Credit: Valdrin Tahiri/ TradingView
Long-term momentum indicators like the Relative Strength Index (RSI) and Moving Average Convergence/Divergence (MACD) have created bearish divergences (orange), warning of an imminent cycle top.
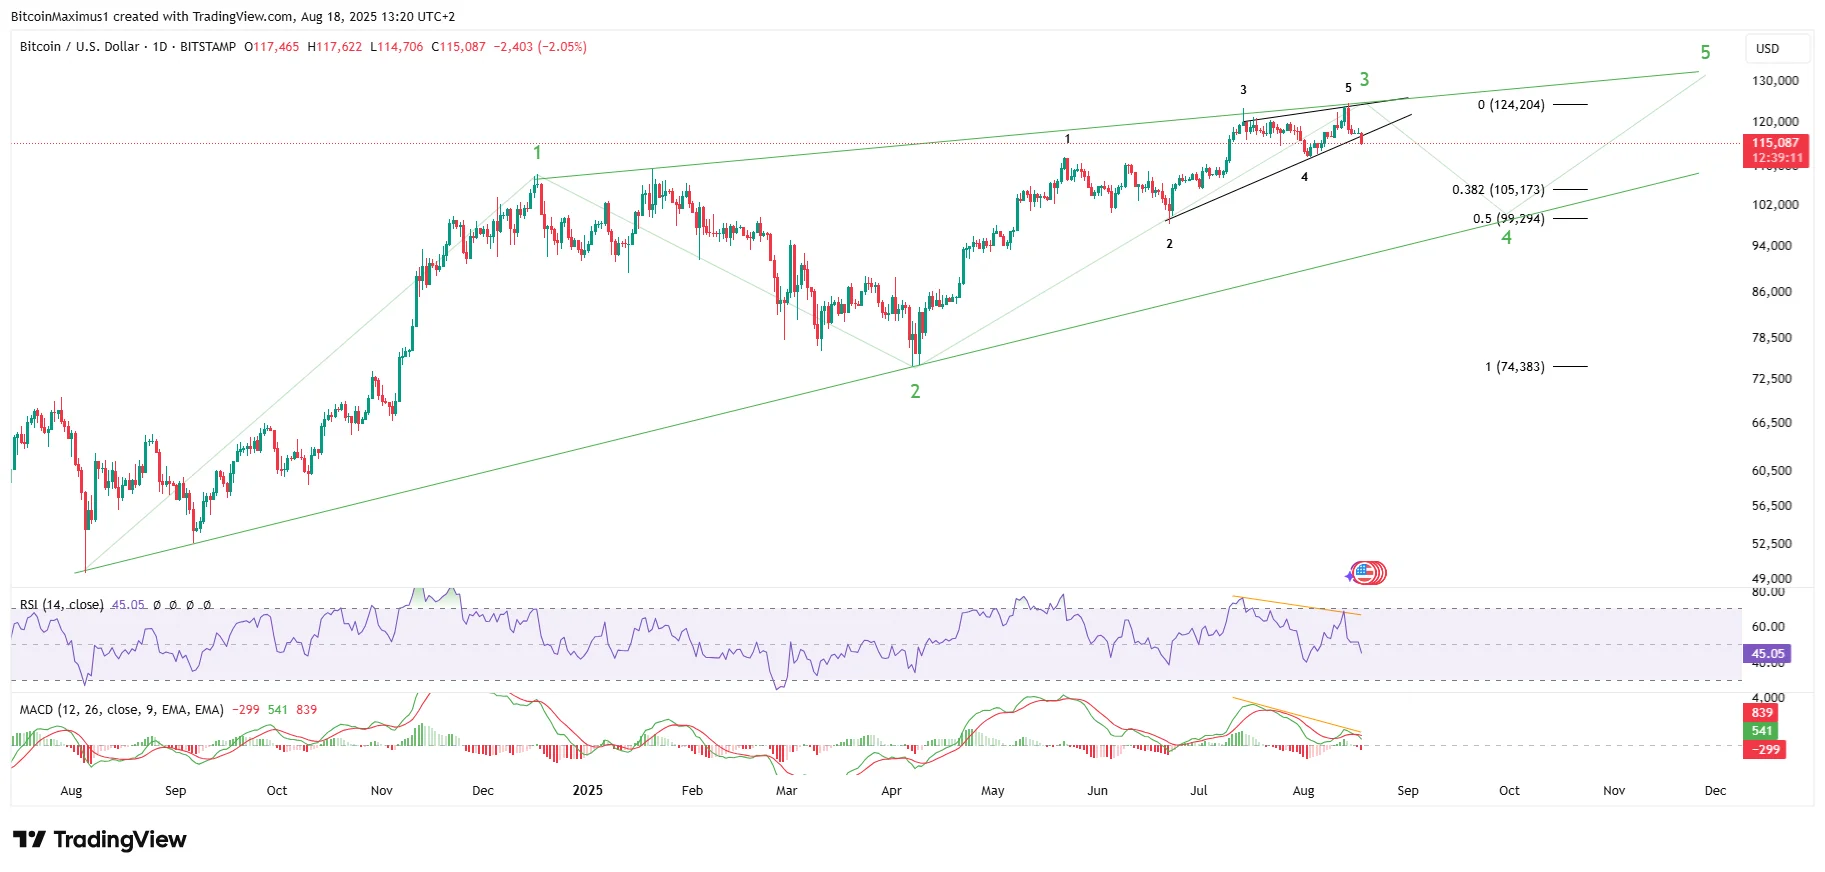
The daily time frame confirms this possibility, showing wave three ended with a diagonal structure (black).
The RSI and MACD generated massive bearish divergences (orange) between the highs of waves three and five, confirming the wave count.
BTC Daily Movement | Credit: Valdrin Tahiri/ TradingView
Since the price of Bitcoin is breaking down from its short-term wedge, it is all but sure that the movement will transpire as expected.
If the decline continues, the closest support will be $105,175, created by the 0.382 Fibonacci retracement support level.
However, the $99,300 Fibonacci support could also act as the bottom, since it coincides with the support trend line of the long-term ascending wedge.
So, the Bitcoin prediction is bearish, suggesting that new lows are likely. Let’s dive deeper into a shorter-term analysis to figure out where exactly Bitcoin will bottom.
Bitcoin Price Analysis
The short-term two-hour chart confirms that the short-term wedge is no more, indicating the breakdown has started.
Additionally, the wave count shows a completed wave one and two, meaning that Bitcoin is in wave three, often the sharpest.
Therefore, if the count transpires, the Bitcoin price is currently in the most rapid portion of its descent.
Disclaimer:
The information provided in this article is for informational purposes only. It is not intended to be, nor should it be construed as, financial advice. We do not make any warranties regarding the completeness, reliability, or accuracy of this information. All investments involve risk, and past performance does not guarantee future results. We recommend consulting a financial advisor before making any investment decisions.
Valdrin Tahiri is a cryptocurrency analyst and reporter at CCN, specializing in technical analysis with a focus on Elliott Wave theory, on-chain metrics, and fundamental research. He brings over seven years of experience in the crypto space as both a trader and writer.
He discovered cryptocurrencies in 2017 while earning his MSc in Financial Markets at the Barcelona School of Economics, which sparked a deep interest in blockchain and market dynamics. Since then, he’s contributed to top crypto outlets like BeInCrypto and CoinGape.
Valdrin also served as Community Manager of BeInCrypto’s Telegram group for three years, helping grow it into one of the largest crypto communities worldwide. His expertise in market structure and price patterns allows him to break down complex trends into clear, actionable insights.
He’s published thousands of articles covering altcoins, Bitcoin cycles, and macro trends.