The rally follows a three-week correction that reinforced the correlation between Bitcoin’s price and the global M2 money supply — a relationship now pointing toward a potential parabolic move, especially with possible rate cuts on the horizon in September.
With that backdrop, let’s dive into the charts and see where Bitcoin could be headed.
Bitcoin’s All-Time High
Bitcoin started its bull market in December 2022, and so far, it has developed into four visible upward movements.
The first lasted for 140 days, followed by 182- and 133-day rallies.
In the current one, the Bitcoin price has increased for 126 days and is still going strong.
Try Our Recommended Crypto Exchanges
Sponsored
Disclosure
We sometimes use affiliate links in our content, when clicking on those we might receive a commission at no extra cost to you. By using this website you agree to our terms and conditions and privacy policy.
While that is the case, there are several ways in which this wave five can play out.
With its all-time high today, Bitcoin’s price reached the wedge’s resistance trend line for the fourth time. The trend line has to hold for the pattern to remain valid.
While there are wave counts that fit better with the price movement, there is another reason why this is the primary count: momentum indicators.
The Relative Strength Index (RSI) and Moving Average Convergence/Divergence (MACD) have generated bearish divergences, a signal that has led to bearish trend reversals in the past.
So, Bitcoin has the strength to at least another rally, but how long the cycle will continue remains uncertain.
Bullish Bitcoin Predictions
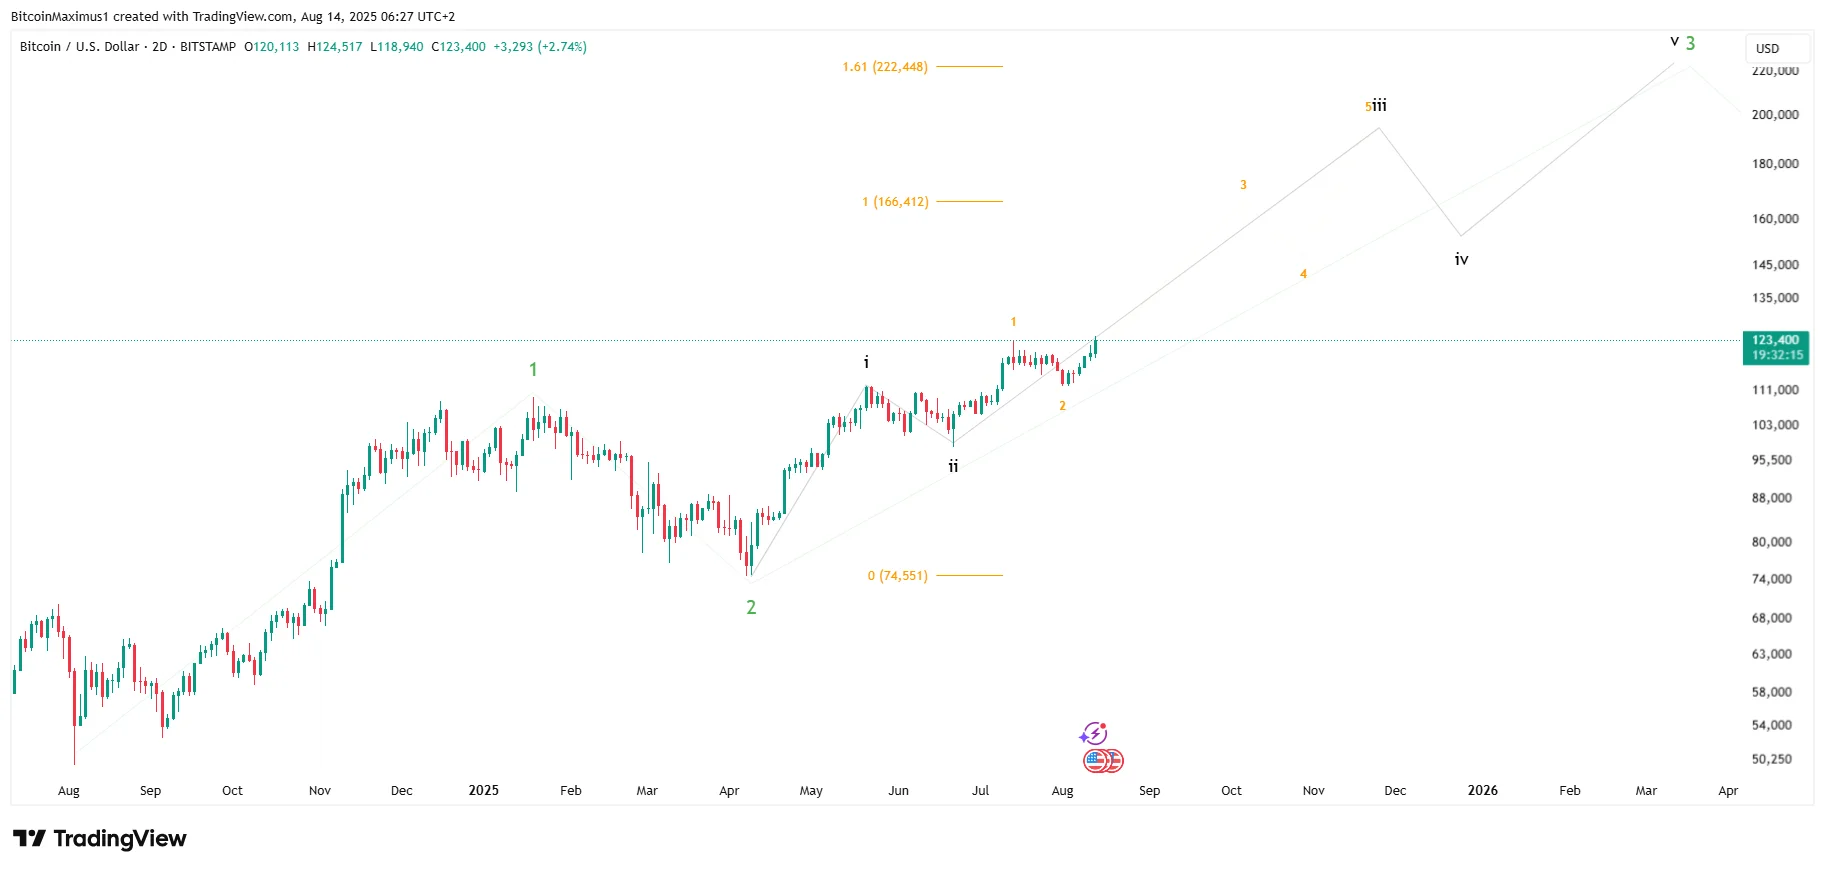
Based on the wave count alone, the two most likely counts suggest Bitcoin is completing a 1-2/1-2 wave extension that will take it well above $200,000.
The first count shows a triple 1-2/1-2/1-2 extension, shown by green, black, and orange, respectively.
In this count, the BTC price has begun the most rapid portion of its ascent, targeting $166,400 within weeks.
Then, the price of Bitcoin could reach a high of $222,450 before a more significant correction.
The second count is similar, except that Bitcoin has created a wedge instead of a parabola in the first wave extension.
While the final targets are the same, the BTC price will correct very soon in the current count, falling toward $95,000 – $100,000 before the upward trend resumes.
Disclaimer:
The information provided in this article is for informational purposes only. It is not intended to be, nor should it be construed as, financial advice. We do not make any warranties regarding the completeness, reliability, or accuracy of this information. All investments involve risk, and past performance does not guarantee future results. We recommend consulting a financial advisor before making any investment decisions.
Valdrin Tahiri is a cryptocurrency analyst and reporter at CCN, specializing in technical analysis with a focus on Elliott Wave theory, on-chain metrics, and fundamental research. He brings over seven years of experience in the crypto space as both a trader and writer.
He discovered cryptocurrencies in 2017 while earning his MSc in Financial Markets at the Barcelona School of Economics, which sparked a deep interest in blockchain and market dynamics. Since then, he’s contributed to top crypto outlets like BeInCrypto and CoinGape.
Valdrin also served as Community Manager of BeInCrypto’s Telegram group for three years, helping grow it into one of the largest crypto communities worldwide. His expertise in market structure and price patterns allows him to break down complex trends into clear, actionable insights.
He’s published thousands of articles covering altcoins, Bitcoin cycles, and macro trends.