Bitcoin's All-Time High is Closer Than You Think | Credit: Derek Fenech
Share
Key Takeaways
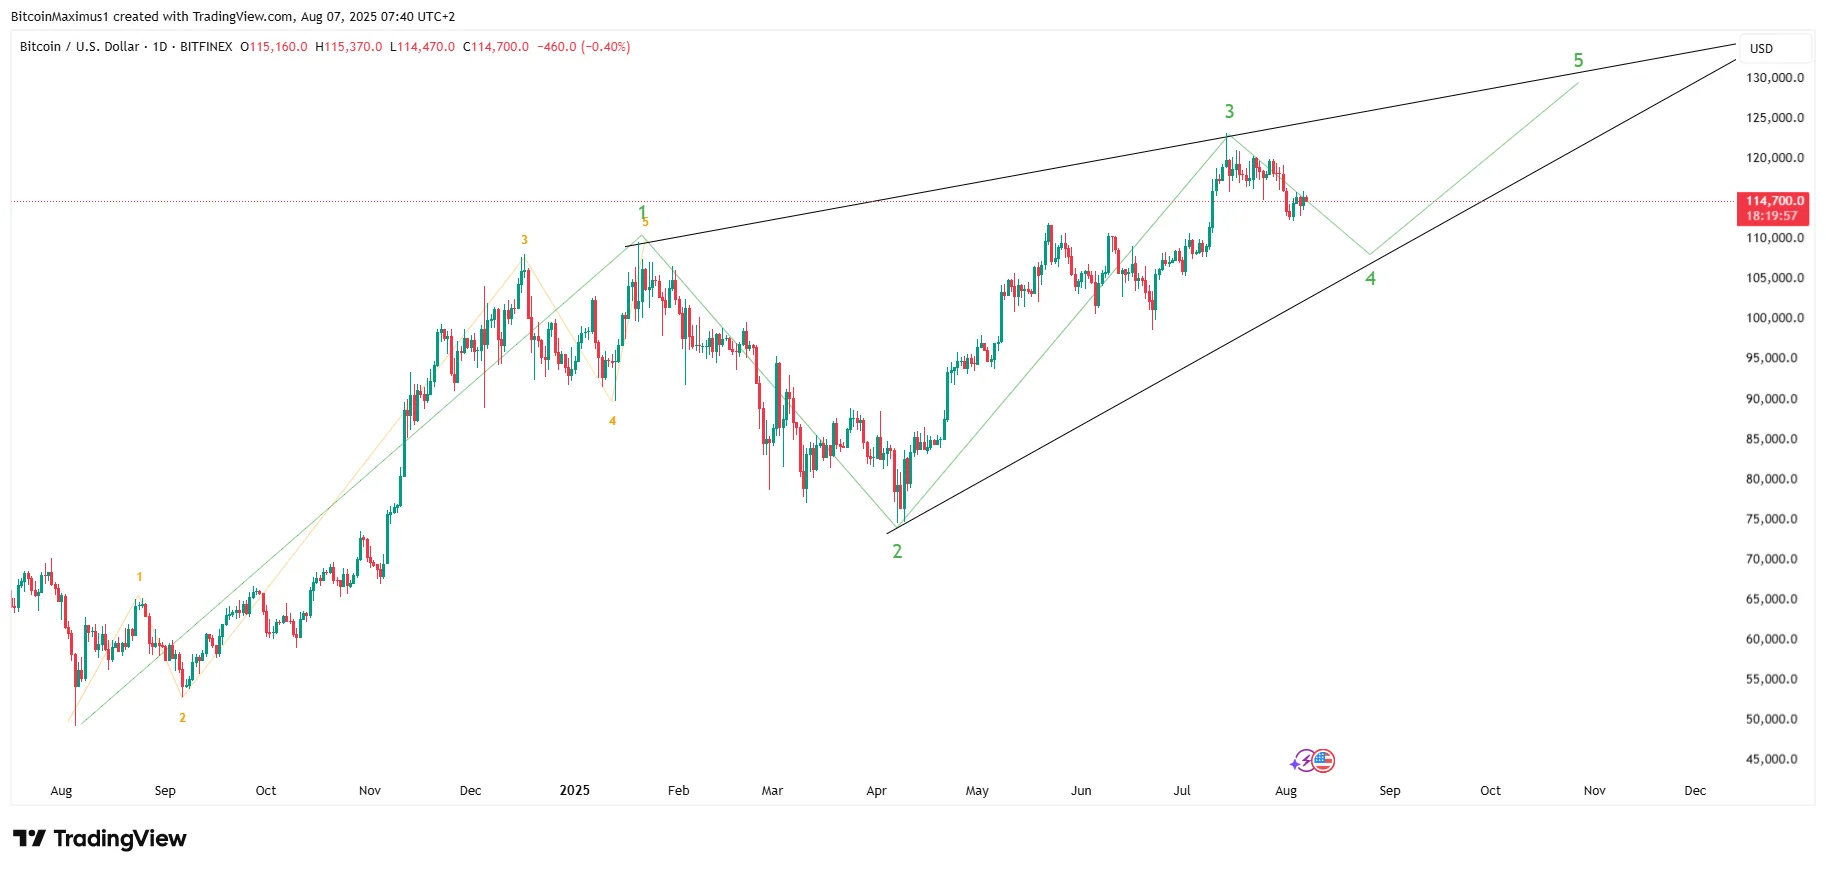
Bitcoin (BTC) could be creating a long-term ascending wedge.
The price of Bitcoin is in the fifth and final wave of its rally.
When and where will Bitcoin reach its cycle top?
Bitcoin (BTC) has cooled off since hitting its all-time high in July, leading to a noticeable drop in market dominance.
However, after a brief dip at the start of August, Bitcoin bounced back, reclaiming the $115,000 level yesterday and forming a bullish candlestick today.
The rebound has sparked fresh optimism that another all-time high could be just around the corner this month.
Let’s break down the charts to see how realistic that possibility is.
Bitcoin Price Analysis
Bitcoin kicked off its bull market in December 2022, and so far, it’s been a story of four clear upward legs.
The first rally lasted 140 days, followed by an 182-day stretch and a 133-day run. The current move has been going on for 119 days and counting.
Based on Elliott Wave theory, Bitcoin appears to be in its fifth and final wave of this cycle. That said, there’s more than one way to break down the rally structure.
Try Our Recommended Crypto Exchanges
Sponsored
Disclosure
We sometimes use affiliate links in our content, when clicking on those we might receive a commission at no extra cost to you. By using this website you agree to our terms and conditions and privacy policy.
Some analysts group the third and fourth moves together as one extended rally.
Others treat them as distinct waves. But regardless of interpretation, most counts agree: we’re in wave five. The real question is what form that final wave will take.
The most likely scenario at the moment points to an ending diagonal pattern—here’s why:
BTC is forming an ascending wedge, a signature trait of ending diagonals. The wedge’s slope was confirmed during the July all-time high.
Momentum indicators: Both the Relative Strength Index (RSI) and Moving Average Convergence/Divergence (MACD) have been flashing bearish divergences, a classic warning sign in past cycles that a top may be forming.
These patterns have often preceded sharp corrections in the past.
So, while Bitcoin may have more gas left for another bullish move, this fifth wave could mark the cycle’s final leg up.
The big unknown now is how high Bitcoin can climb before this cycle tops out.
A number of scenarios remain on the table. Some wave counts suggest the rally could extend to $160,000–$175,000.
A more bullish extension could even push BTC as high as $235,000 before the cycle truly ends.
Let’s break down each of those possibilities next.
Bitcoin’s Bearish Technical Analysis
The wave counts will be ranked from the least to the most bullish.
The most bearish count suggests the BTC price is in sub-wave five (orange) of wave five in its upward movement.
If this transpires, the next high will be the final, and BTC will top around $125,000.
The count is extremely unlikely. There is a massive discrepancy between waves one, three, and five, making it unlikely they are of the same degree.
Since we determined that wave five started in July 2024, sub-wave one was likely the increase until January 2025, and sub-wave three began in April 2025.
The only thing to determine is how sub-wave three will develop.
Since we discarded the extreme bearish scenario, the most plausible bearish one suggests that Bitcoin is in sub-wave four, which will end near $110,000.
Then, Bitcoin will complete its cycle with an ending diagonal between $125,000 – $130,000.
Bullish Bitcoin Extensions
The next series of Bitcoin price predictions for the rest of 2025 are the extensions.
While all are valid, and their structure fits exceptionally well with the current existing wave count, the Bitcoin price must go parabolic soon to remain plausible.
The bullish Bitcoin price analysis shows a series of 1-2/1-2/1-2 wave formations in green, black, and orange, respectively.
While another similar alternative involves Bitcoin trading in a short-term wedge, that is more unlikely because the extension would create a leading diagonal.
Since the Bitcoin analysis leads to the same price target, it is not worth monitoring at the moment.
Several Future Scenarios
No single valid count suggests that Bitcoin has reached its top.
However, the counts do not help determine an exact area for the top.
Possible highs range between $125,000 and $235,000, giving an extensive range for the top of the current cycle.
How the move develops and whether the Bitcoin price breaks out from its ascending wedge are key in determining where the top will be.
Disclaimer:
The information provided in this article is for informational purposes only. It is not intended to be, nor should it be construed as, financial advice. We do not make any warranties regarding the completeness, reliability, or accuracy of this information. All investments involve risk, and past performance does not guarantee future results. We recommend consulting a financial advisor before making any investment decisions.
Valdrin Tahiri is a cryptocurrency analyst and reporter at CCN, specializing in technical analysis with a focus on Elliott Wave theory, on-chain metrics, and fundamental research. He brings over seven years of experience in the crypto space as both a trader and writer.
He discovered cryptocurrencies in 2017 while earning his MSc in Financial Markets at the Barcelona School of Economics, which sparked a deep interest in blockchain and market dynamics. Since then, he’s contributed to top crypto outlets like BeInCrypto and CoinGape.
Valdrin also served as Community Manager of BeInCrypto’s Telegram group for three years, helping grow it into one of the largest crypto communities worldwide. His expertise in market structure and price patterns allows him to break down complex trends into clear, actionable insights.
He’s published thousands of articles covering altcoins, Bitcoin cycles, and macro trends.