If the market closes this week below $3.66 trillion, that would confirm an evening star pattern, which is typically a bearish reversal signal.
Get These Top Crypto Casino Offers Now!
Sponsored
Disclosure
We sometimes use affiliate links in our content, when clicking on those we might receive a commission at no extra cost to you. By using this website you agree to our terms and conditions and privacy policy.
This helps explain why the crypto market is down today and raises the possibility of further losses through August.
If the decline continues, the next major support zone lies between $3.26 trillion and $3.47 trillion, based on the 0.382–0.5 Fibonacci retracement levels.
Altcoins Crash
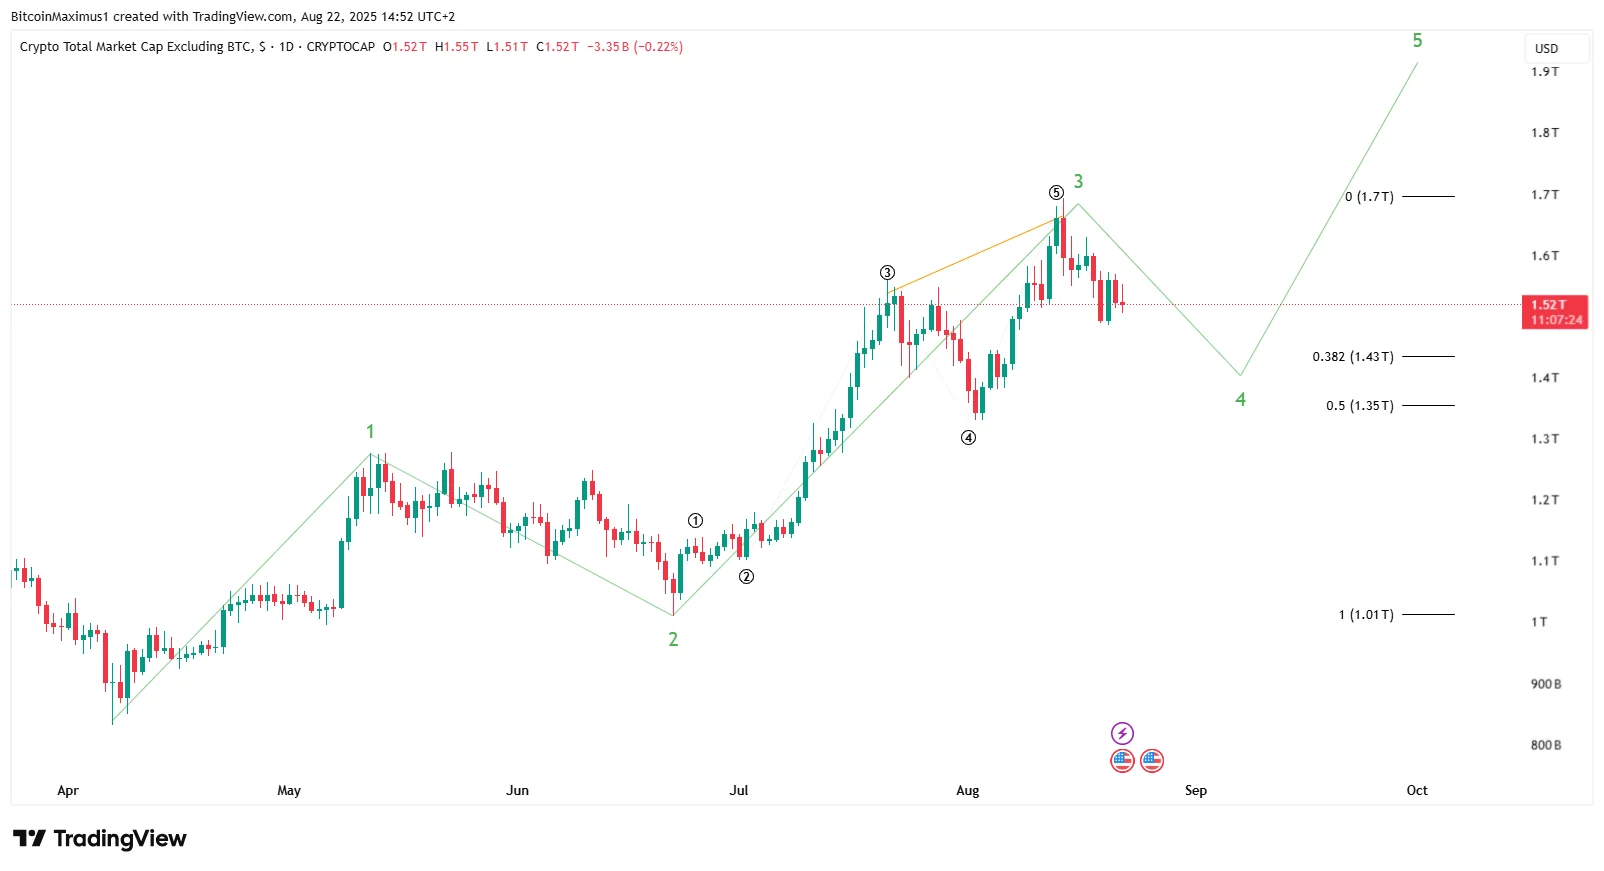
The altcoin chart is even more concerning, showing many bearish signs.
At first, the wave count shows that altcoins have completed wave three in a five-wave increase (green) and have now started a corrective wave four.
The sub-wave count (black) confirms that this is the case.
Just like the total market cap, the daily RSI and MACD have generated considerable bearish divergences, which could lead to a pronounced downward trend.
If the count transpires as predicted, altcoins could fall by another 10% on average, reaching the 0.382-0.5 Fibonacci retracement support level at $1.35 – $1.43 trillion.
Since wave two was gradual and deep, the wave four correction could be shallow and sharp.
Bitcoin & Ethereum Price
Bitcoin (BTC) and Ethereum (ETH) are the largest and second-largest cryptocurrencies, so their price movement affects whether the rest of the crypto market is down or not.
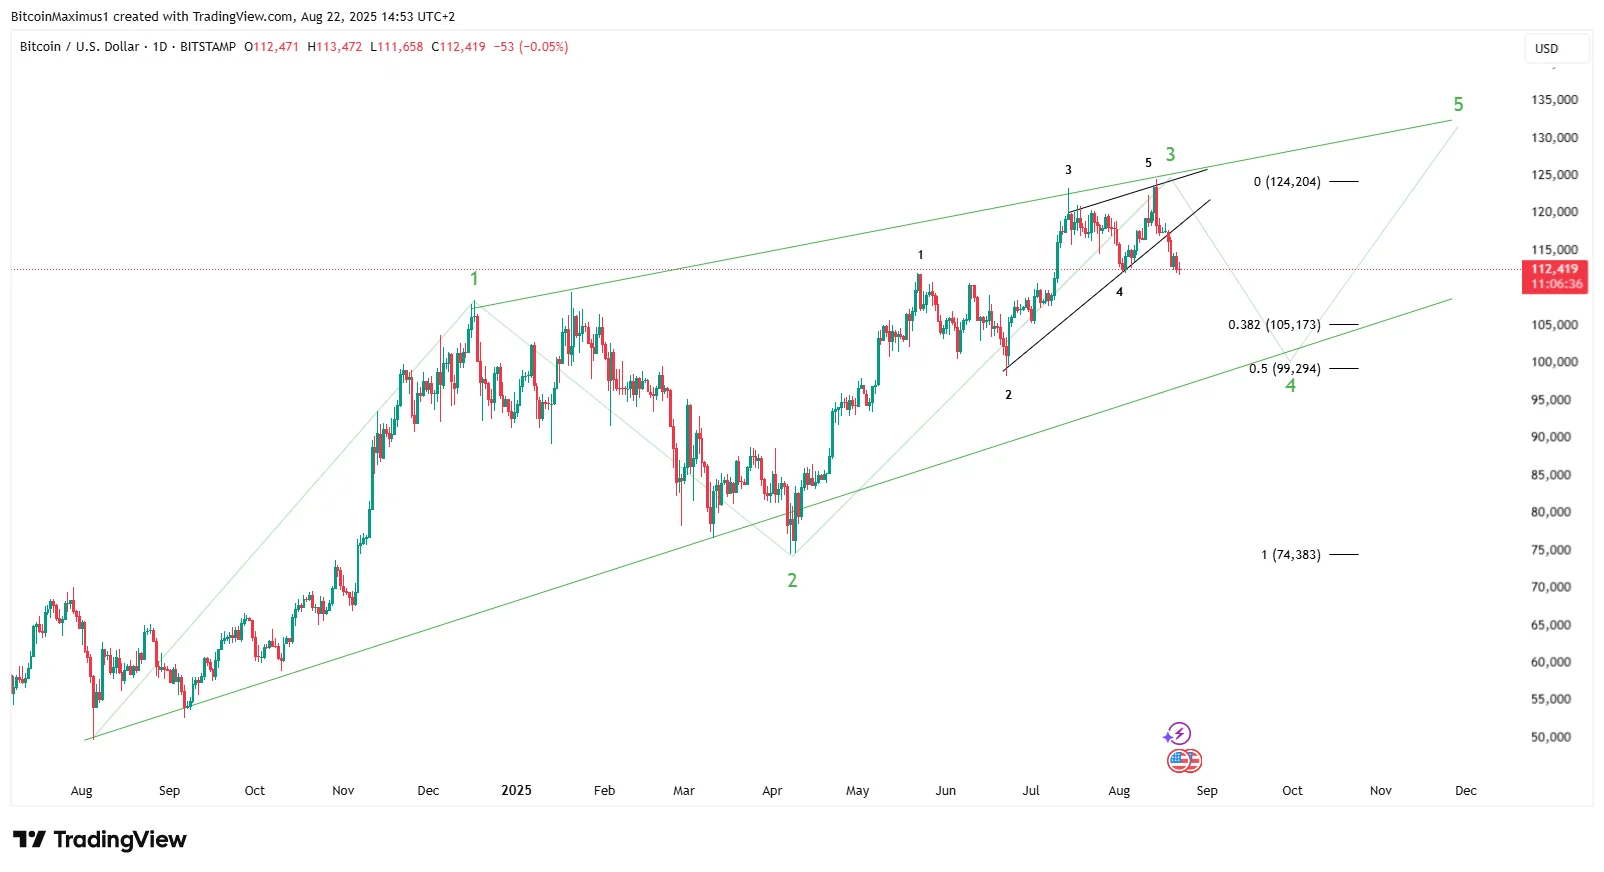
The Bitcoin price also shows signs of an imminent price top.
The wave count shows that the price has started wave four in a five-wave upward movement (green).
Bitcoin has also created diagonals for wave five and the entire upward movement.
Disclaimer:
The information provided in this article is for informational purposes only. It is not intended to be, nor should it be construed as, financial advice. We do not make any warranties regarding the completeness, reliability, or accuracy of this information. All investments involve risk, and past performance does not guarantee future results. We recommend consulting a financial advisor before making any investment decisions.
Valdrin Tahiri is a cryptocurrency analyst and reporter at CCN, specializing in technical analysis with a focus on Elliott Wave theory, on-chain metrics, and fundamental research. He brings over seven years of experience in the crypto space as both a trader and writer.
He discovered cryptocurrencies in 2017 while earning his MSc in Financial Markets at the Barcelona School of Economics, which sparked a deep interest in blockchain and market dynamics. Since then, he’s contributed to top crypto outlets like BeInCrypto and CoinGape.
Valdrin also served as Community Manager of BeInCrypto’s Telegram group for three years, helping grow it into one of the largest crypto communities worldwide. His expertise in market structure and price patterns allows him to break down complex trends into clear, actionable insights.
He’s published thousands of articles covering altcoins, Bitcoin cycles, and macro trends.