Binance Coin Price Remains Trending Upward Despite Market Slump — Is BNB Lagging Behind?

The price of Binance coin has made a significant recovery from its April 17 low but reached significant resistance today. A reversal looks more likely.
Key Takeaways
- BNB has shown resilience, hinting at potential breakout at a time when the crypto market is dropping.
- Binance Coin is near its resistance, leaving it poised for possible new high.
- The RSI suggests BNB is overbought, so any possible peak could be followed by decline, catching up to the overall market.
Despite a broader market slump, Binance Coin (BNB) continues to exhibit an upward price trend. This resilience raises questions about whether BNB lags behind other major cryptocurrencies or is poised for a breakout.
Binance Coin (BNB) Price Context
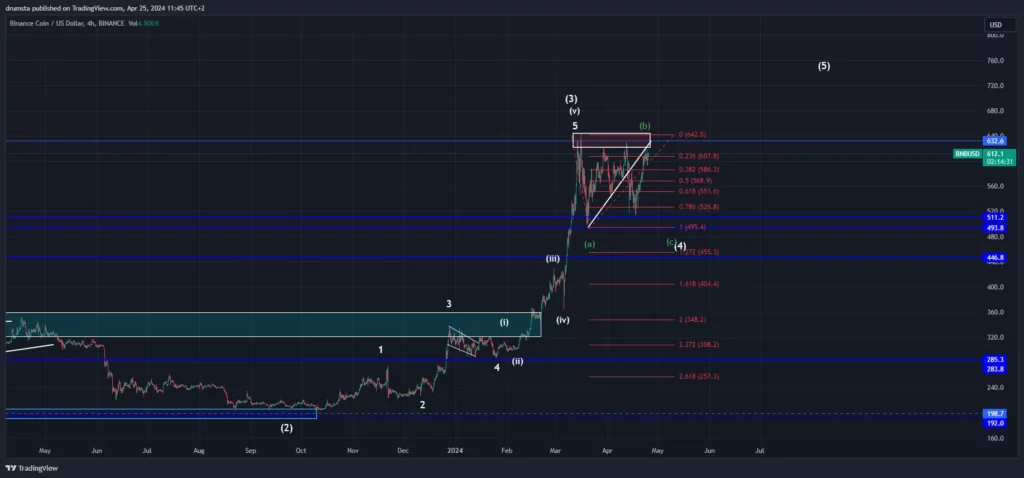
Binance Coin recently achieved its annual peak of $645 on March 16, only to retreat by 22% to $500 by March 20. Following a recovery to $628 on April 12, BNB experienced another dip, this time to a higher low of $512 on April 17.

BNB is hovering around $610 as it made a 20% recovery. This hints at a potential breakout from an ascending triangle pattern, raising the possibility of it surpassing its yearly high.
Currently, Binance Coin is close to its horizontal resistance zone between $623 and $645. These figures align with its March 13 high and March 16 peak respectively. This pattern has shaped into an ascending triangle, suggesting potential for further upward movement. However, another drop might occur before this consolidation completes.
The one-hour chart shows the Relative Strength Index (RSI) in the overbought zone at 72%. Historically, such levels have often indicated a peak followed by a decline. Meanwhile, the MACD oscillator showed a bearish signal, narrowing moving averages and downward curving oscillations signal weakening momentum, suggesting a possible reversal.
Binance Coin (BNB) Price Prediction
Expanding the view to the daily chart, the price movement from January 26 to March 16 appears as wave three of a larger pattern. Meanwhile, with the ongoing structure being a wave four correction in a triangle formation.

This corrective wave is likely in a three-wave pattern, where the bounce from March 20 represents its second sub-wave. If BNB faces rejection at the current resistance, it could form a double top and descend in its final corrective wave C, targeting $500. This was a key support level on March 20 and a potential retest point.
However, should BNB break through its current resistance, it could invalidate these bearish projections and possibly set a new all-time high. The development at this resistance zone will be crucial in determining whether BNB continues its ascent or revisits lower levels, with potential support at the 1.618 Fibonacci extension just above $400 if the downward momentum persists.
Conclusion
While BNB remains in an uptrend and is getting close to its yearly high, significant indicators show the possibility of incoming selling pressure. If we do see a reversal, it can cause another massive drop. The first target of $500 is 17% from its current level, while its most pessimistic target of $400 would be a drop of nearly 34%. It appears BNB is lagging behind the market, which already started this downturn. However, should the price stay above $600 the possibility of a breakout above its yearly high is greater.
Disclaimers
Please note that the contents of this article are not financial or investing advice. The information provided in this article is the author’s opinion only. It should not be considered as offering trading or investing recommendations. We do not make any warranties about the completeness, reliability and accuracy of this information. The cryptocurrency market suffers from high volatility and occasional arbitrary movements. Any investor, trader, or regular crypto users should research multiple viewpoints and be familiar with all local regulations before committing to an investment.


