Arthur Hayes Says Ethereum Will Go Higher | Credit: Derek Fenech
Share
Key Takeaways
The Ethereum (ETH) price nearly reached a new all-time high in August.
Ethereum has fallen by over 10% since its high of $4,788 on Aug. 14.
On-chain indicators suggest the market cycle top has not been reached yet.
Ethereum’s (ETH) price came close to breaking a new all-time high in August, reigniting speculation about where its ultimate cycle top may land.
Well-known figures such as Arthur Hayes and Tom Lee believe the price of Ethereum will go much higher this cycle.
On-chain indicators, such as the Block Subsidy Model and MVRV Pricing Bands, can help determine possible areas of interest.
Let’s examine a few charts and determine why the Ethereum price is rising and if the rally will continue.
Bullish Ethereum Sentiment
Ethereum sentiment has been extremely bullish since April, a complete turnaround from how it was during most of the bull cycle.
There are numerous reasons for this, the principal being positive price action, massive exchange-traded fund (ETF) inflows, and the increase in Ethereum’s dominance.
Get These Top Crypto Casino Offers Now!
Sponsored
Disclosure
We sometimes use affiliate links in our content, when clicking on those we might receive a commission at no extra cost to you. By using this website you agree to our terms and conditions and privacy policy.
BitMEX co-founder Arthur Hayes previously sold Ethereum at nearly $3,500, but recently admitted to rebuying above $4,100 because he believes the charts are heading higher.
Mark Newton, the managing director at Fundstrat Capital, whose CIO Tom Lee is one of the biggest Ethereum bulls, predicted a decline to $4,100 before a massive bounce.
As Mark Newton predicted, Ethereum’s decline has already occurred, and the price is currently bouncing. Let’s look at where it can head next.
Why is Ethereum’s Price Rising?
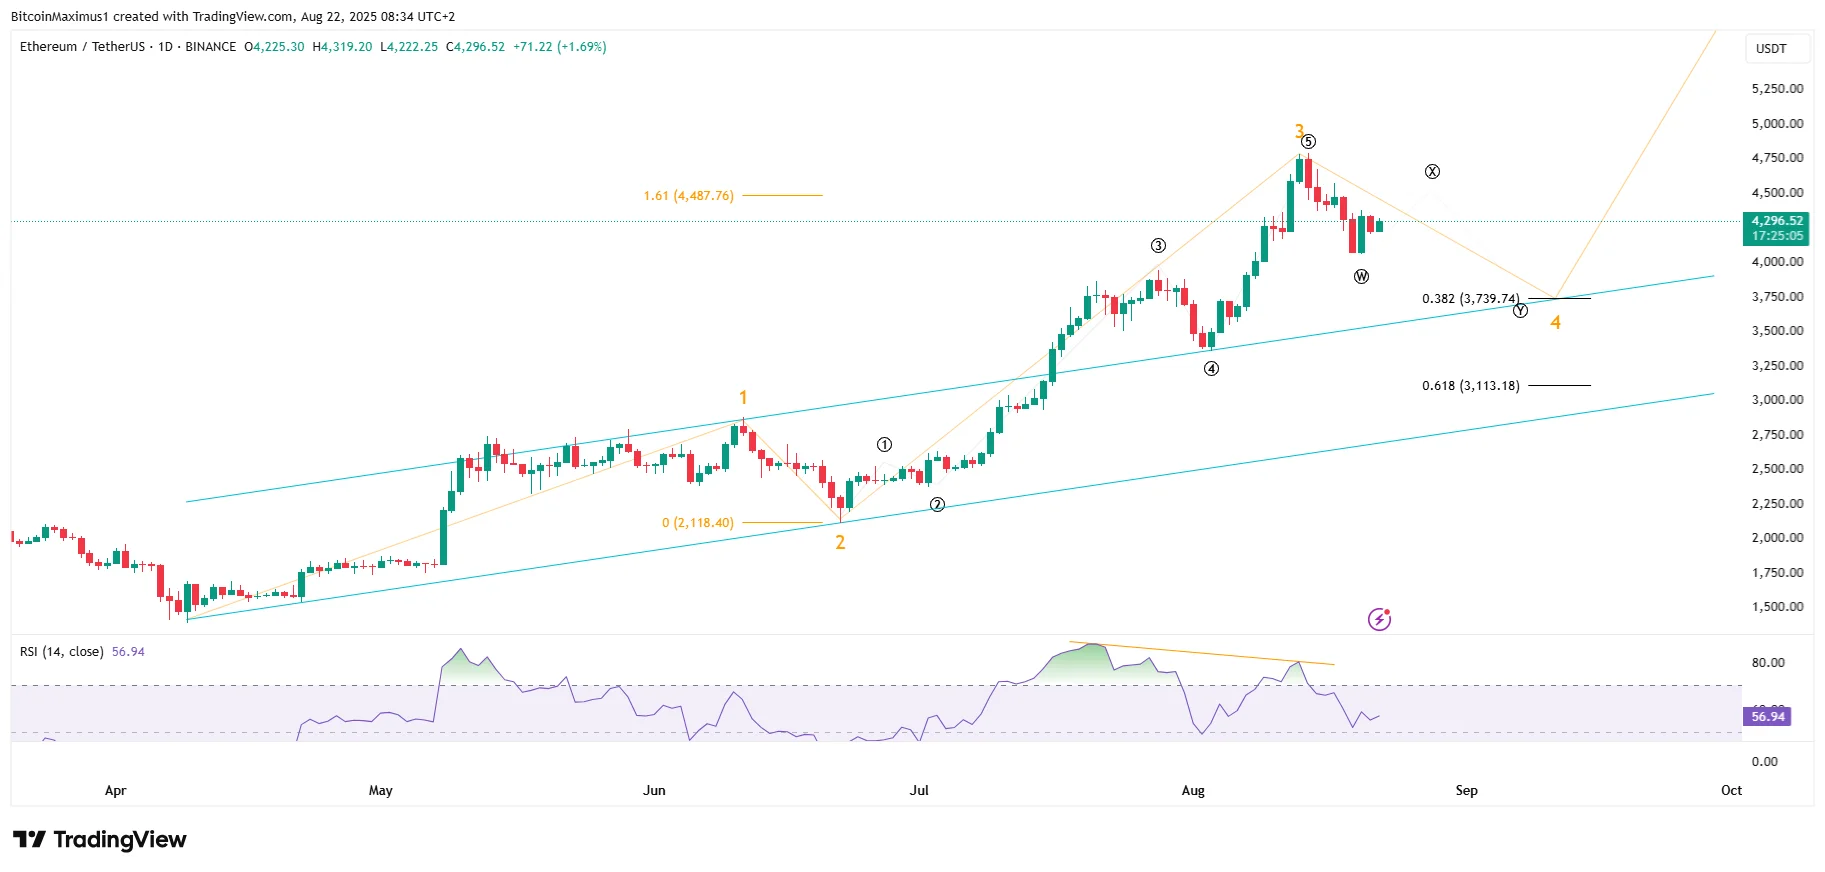
The price of Ethereum has increased rapidly since June, likely beginning a five-wave upward movement (orange).
If that is the case, it is currently in a corrective wave four, completing a fourth-wave pullback.
Ethereum’s decline started with a bearish divergence in the Relative Strength Index (RSI).
The most likely level for the end of wave four is at the 0.382 Fibonacci retracement support at $3,740, also hitting the previous channel’s resistance trend line.
While the downward trend could continue, the price of ETH has already started to bounce, since the first part of the correction is over.
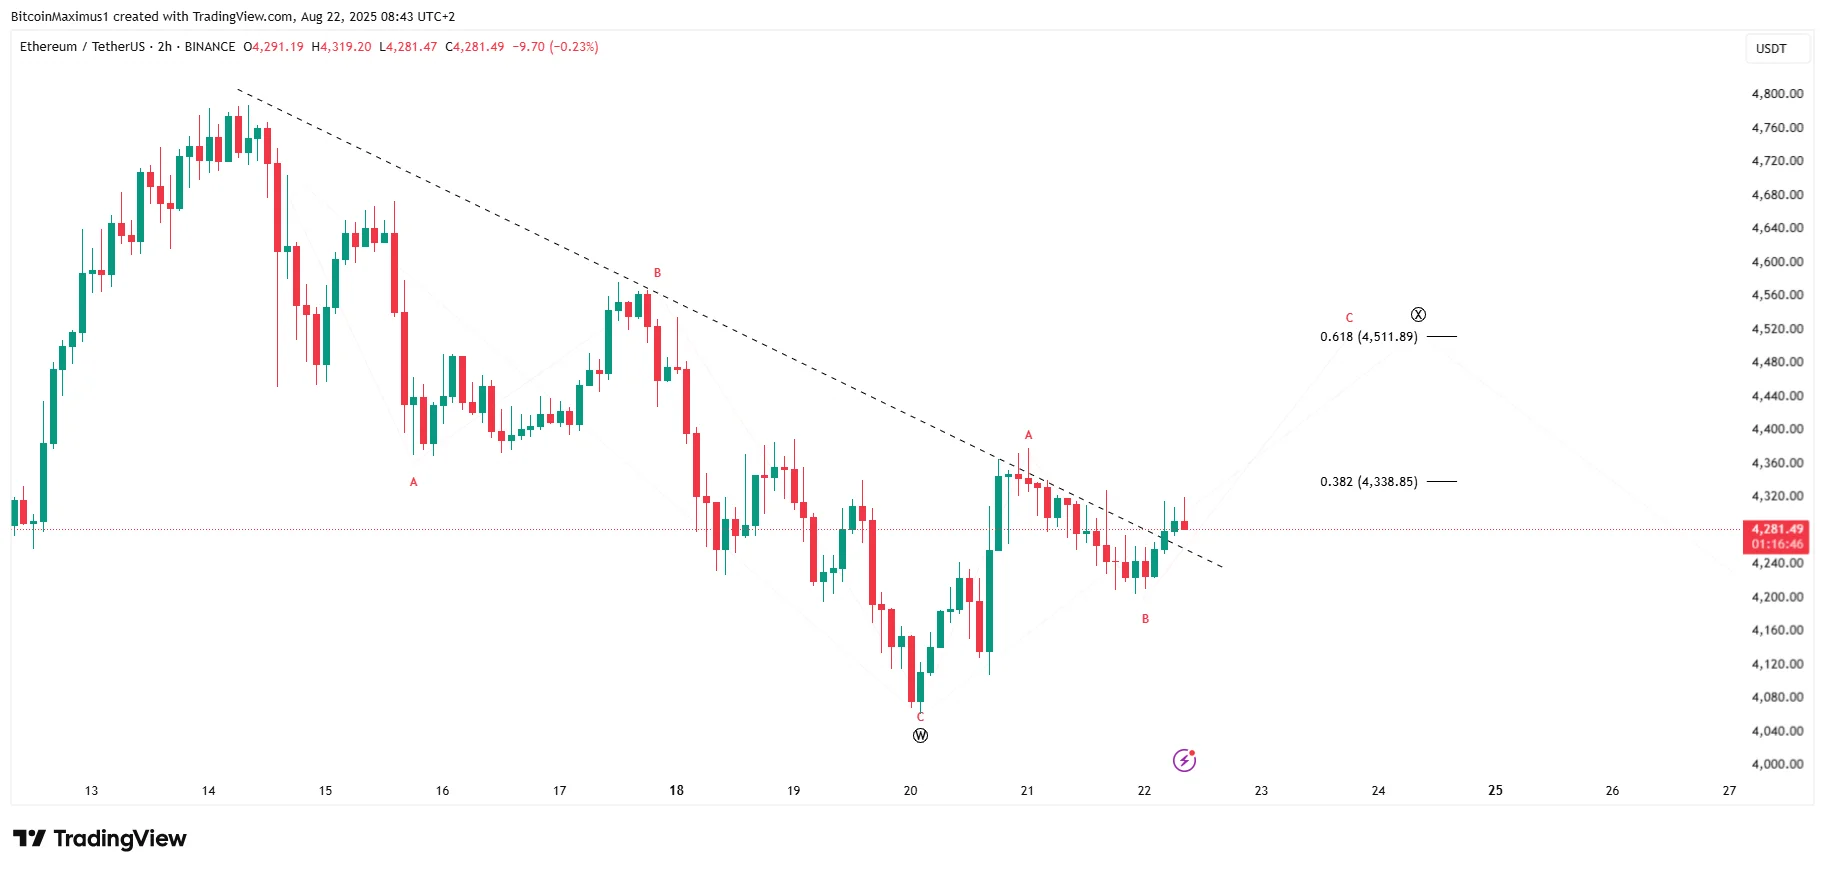
The short-term chart shows that Ethereum’s price is rising and broke out from its descending resistance trend line, the first sign that a bullish reversal has started.
While the curves will likely move upward alongside the price, the x16 thermocap is currently at $6,000, meaning Ethereum’s price could top slightly above this value.
The x32 thermocap is above $11,500, so the difference in the cycle top is massive, depending on which one Ethereum reaches.
MVRV Pricing Bands
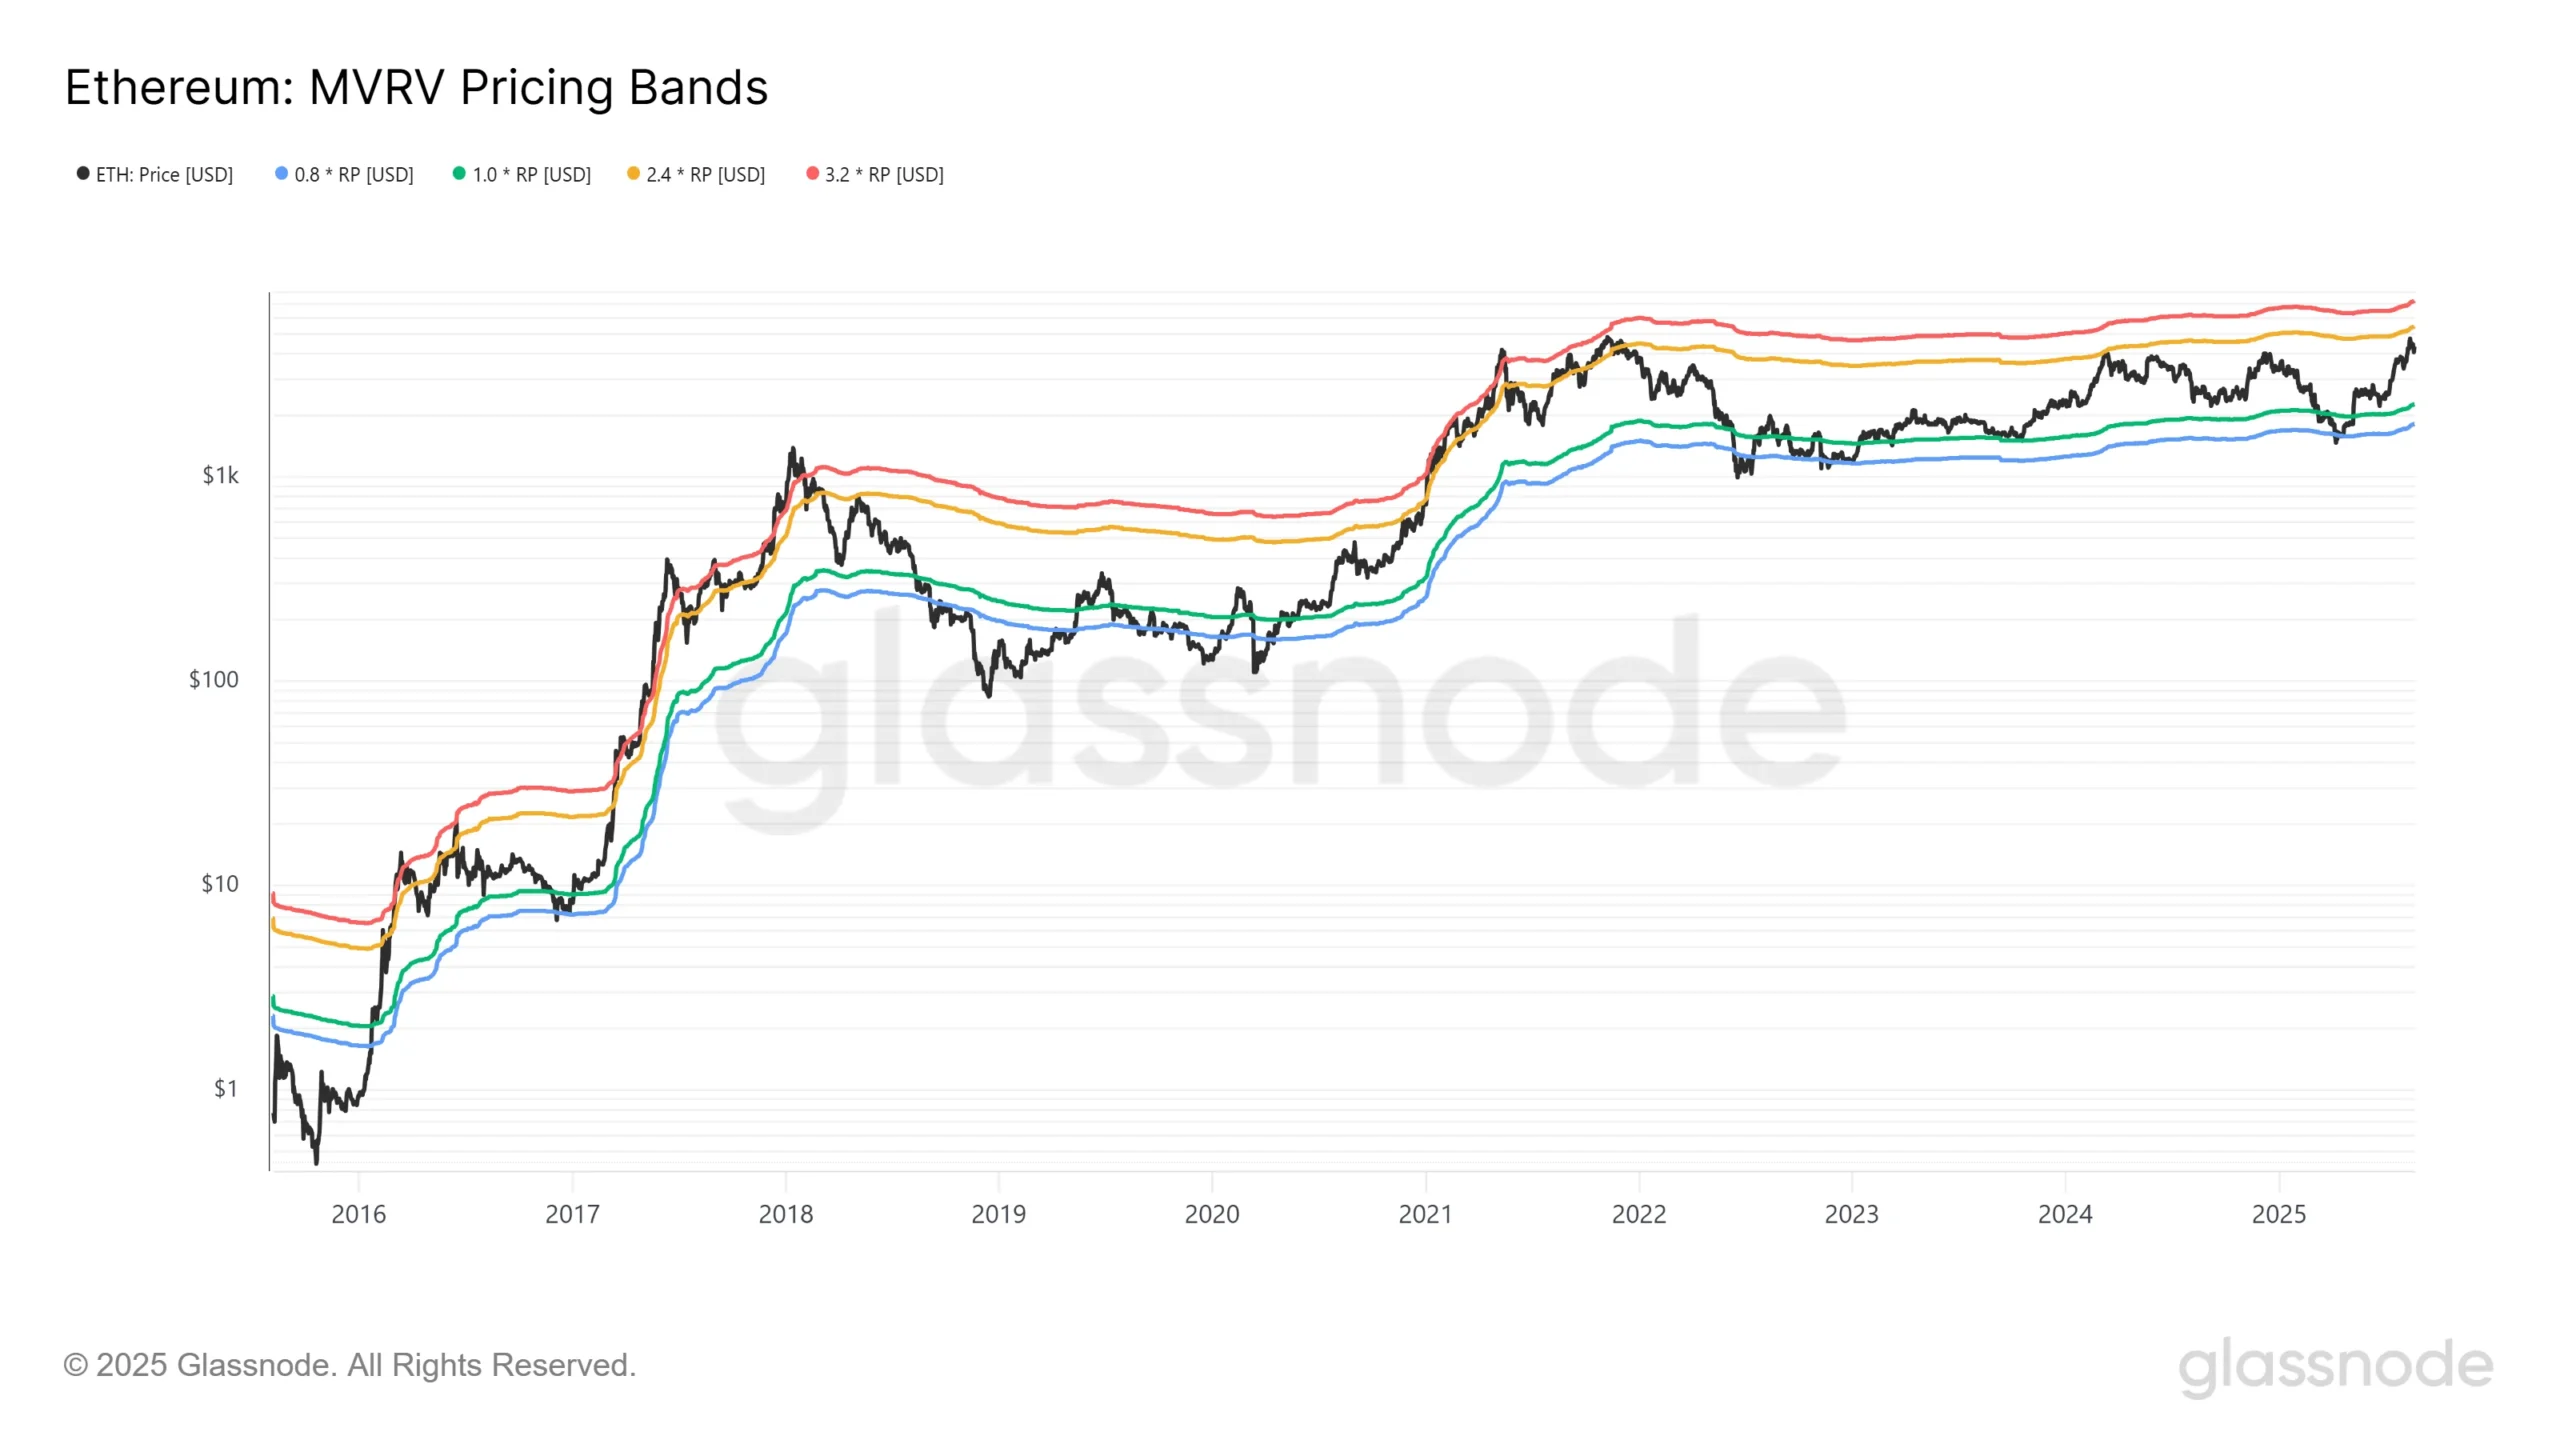
The MVRV pricing band is an on-chain indicator that helps identify the extreme levels of Ethereum’s market cycle.
Tracking these ratios identifies points where there are incredibly high unrealized profits or losses.
When the Ethereum price touches these bands, it often triggers intense selling or buying and a trend reversal.
Disclaimer:
The information provided in this article is for informational purposes only. It is not intended to be, nor should it be construed as, financial advice. We do not make any warranties regarding the completeness, reliability, or accuracy of this information. All investments involve risk, and past performance does not guarantee future results. We recommend consulting a financial advisor before making any investment decisions.
Valdrin Tahiri is a cryptocurrency analyst and reporter at CCN, specializing in technical analysis with a focus on Elliott Wave theory, on-chain metrics, and fundamental research. He brings over seven years of experience in the crypto space as both a trader and writer.
He discovered cryptocurrencies in 2017 while earning his MSc in Financial Markets at the Barcelona School of Economics, which sparked a deep interest in blockchain and market dynamics. Since then, he’s contributed to top crypto outlets like BeInCrypto and CoinGape.
Valdrin also served as Community Manager of BeInCrypto’s Telegram group for three years, helping grow it into one of the largest crypto communities worldwide. His expertise in market structure and price patterns allows him to break down complex trends into clear, actionable insights.
He’s published thousands of articles covering altcoins, Bitcoin cycles, and macro trends.