The amount of ETH held on centralized exchanges has dropped to 15.35 million — the lowest since 2016.
Ethereum’s price has support of nearly $3,626, which could trigger a sustained upswing in the short term.
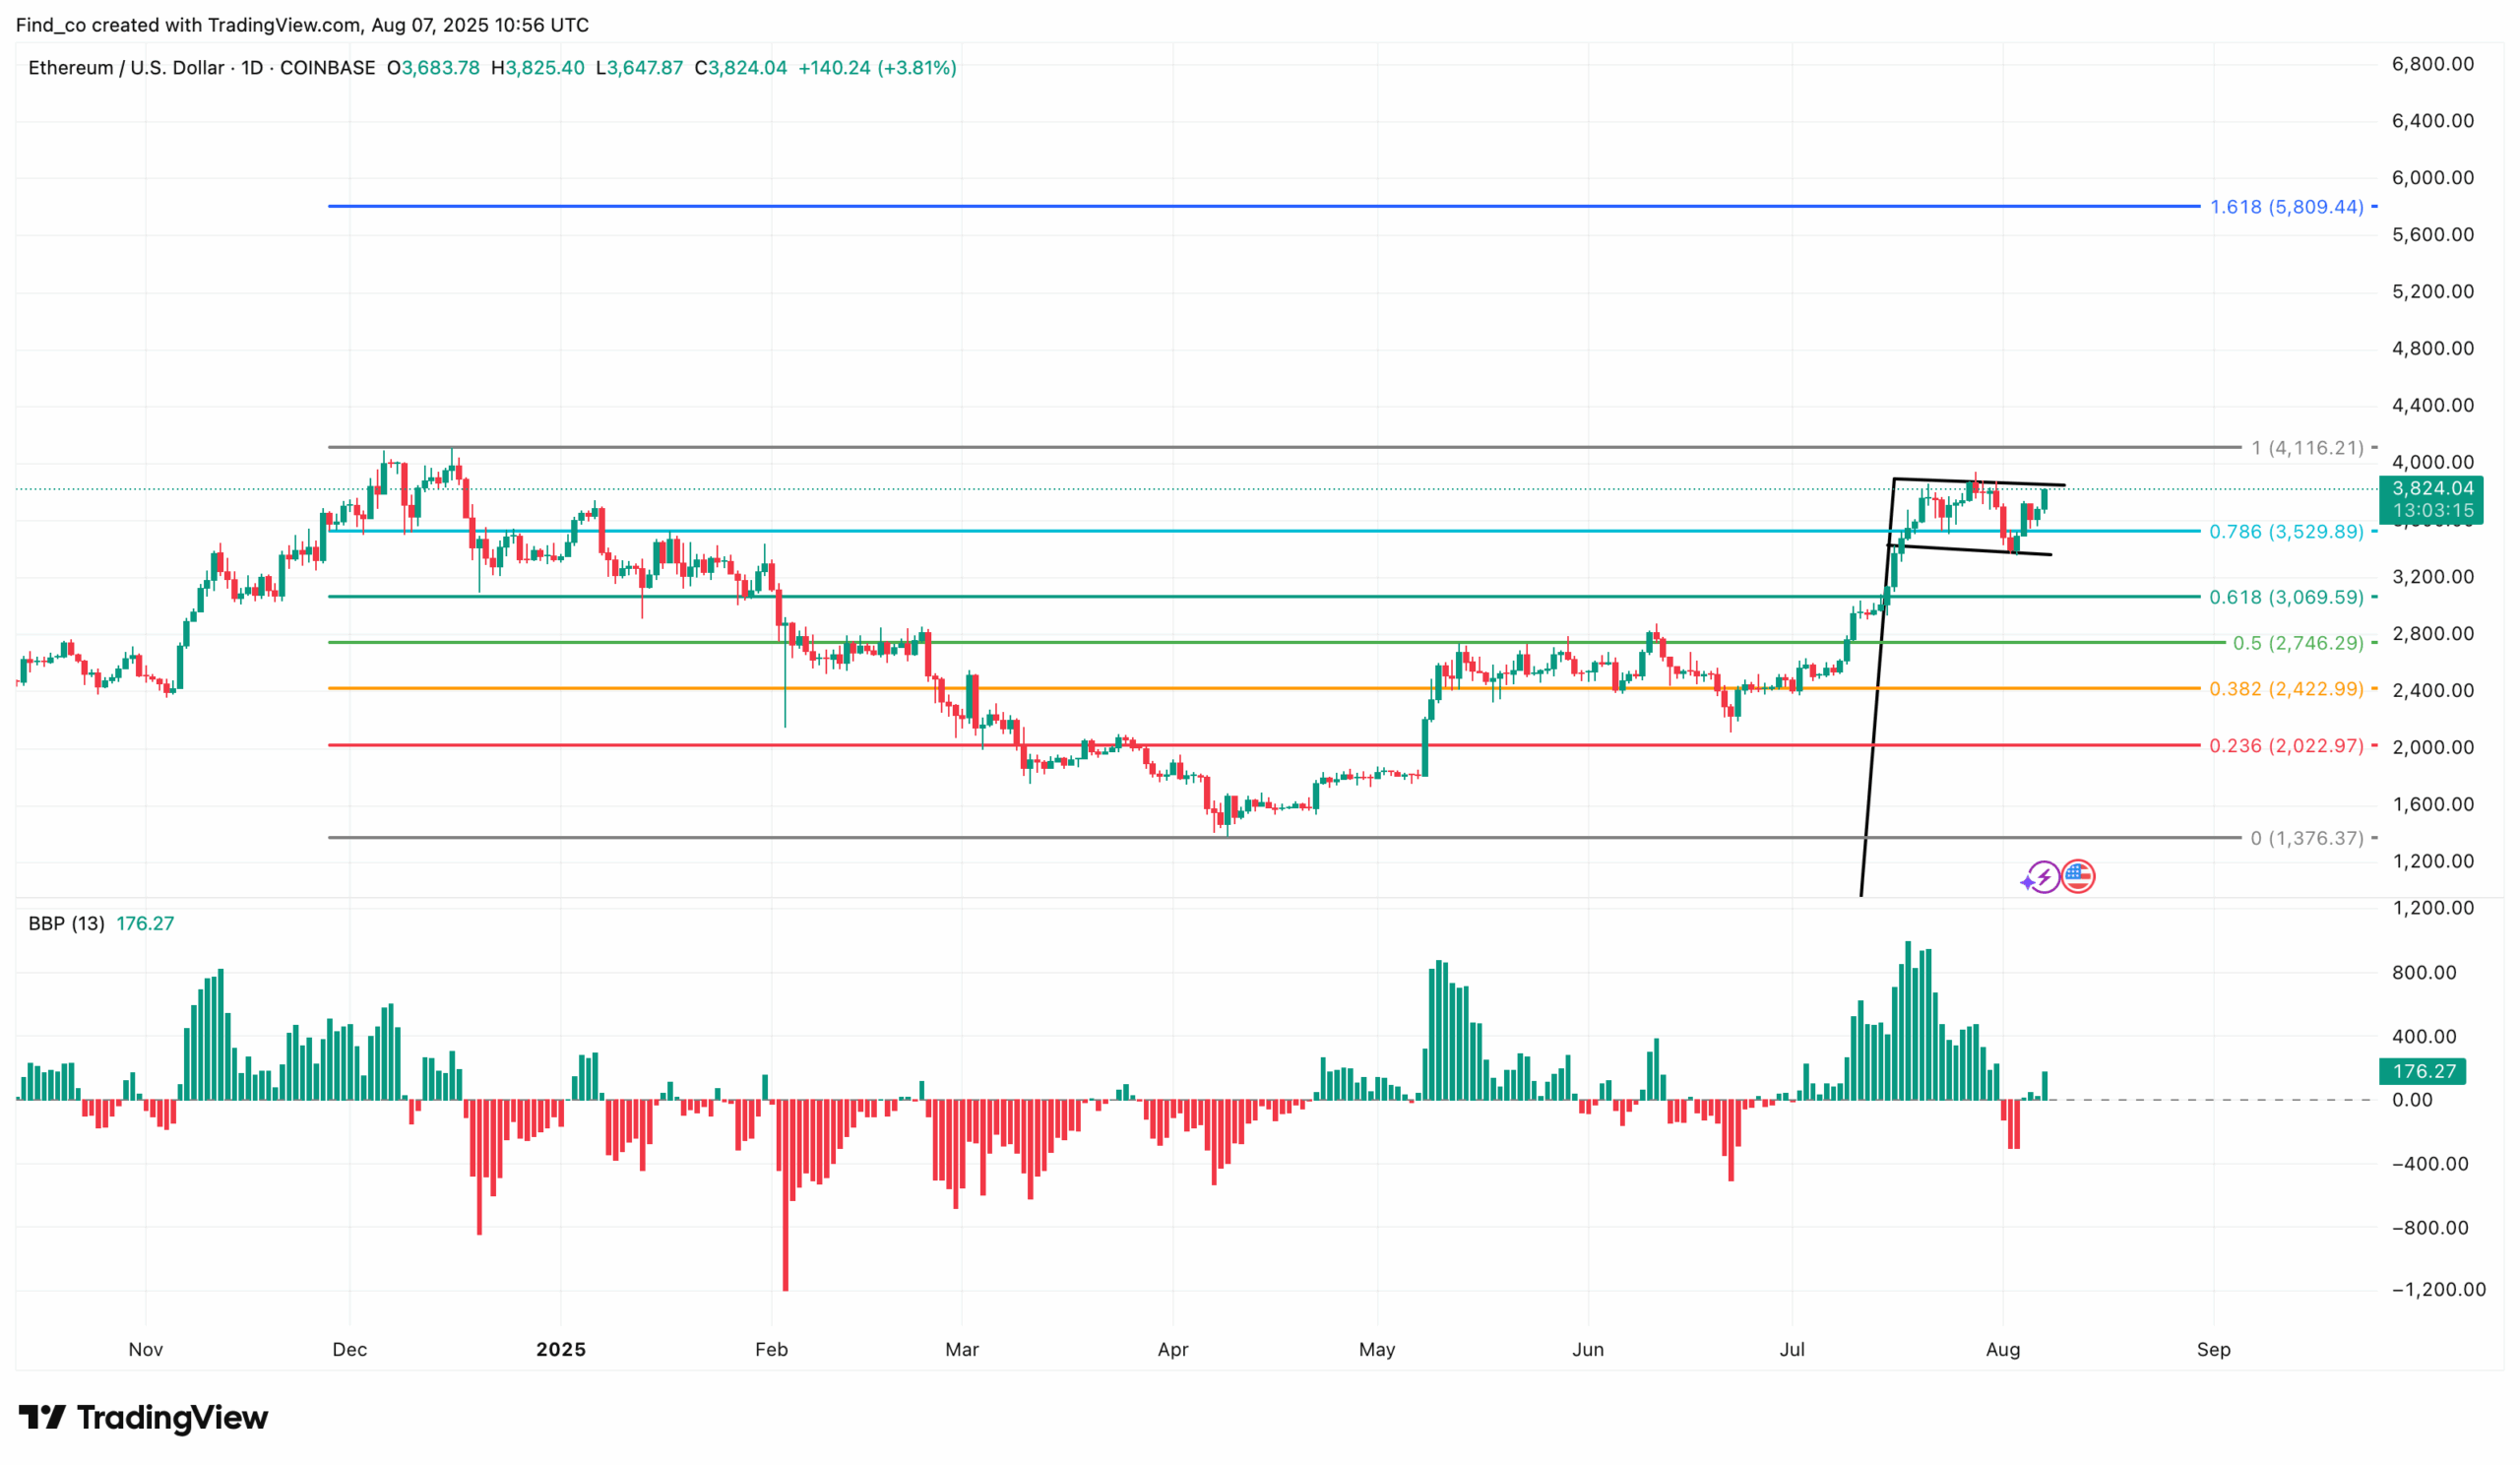
A bullish flag formation on the daily chart and rising BBP reading suggest a breakout toward $4,116.
Ethereum (ETH) has a nine-year low on exchange balances. This decline in supply isn’t just a footnote — it’s a market signal.
Price elasticity increases as ETH becomes more scarce on centralized exchanges (CEXs). That means when new demand enters the market, Ethereum’s price could be in line to break out.
But will ETH surge as soon as possible? Let’s find out.
Ethereum Sell Pressure Drops
As of April, the total supply of Ethereum held on centralized exchanges exceeded 18 million. That figure has since dropped significantly, falling to just 15.35 million ETH — the lowest level recorded since 2016.
This decline suggests a shift in investor behavior, with more ETH being moved into cold storage, DeFi protocols, or self-custody wallets, and away from exchanges where it’s readily available for sale.
Try Our Recommended Crypto Exchanges
Sponsored
Disclosure
We sometimes use affiliate links in our content, when clicking on those we might receive a commission at no extra cost to you. By using this website you agree to our terms and conditions and privacy policy.
Historically, such outflows from exchanges are seen as bullish indicators, signaling growing confidence among long-term holders and potentially foreshadowing a supply squeeze.
Therefore, if demand increases and institutional interest rises, the scarcity of readily available coins could help drive Ethereum’s price higher.
Key Buy Wall Emerges
Beyond the declining exchange supply, Ethereum’s on-chain metrics also align with a bullish narrative. The In/Out of the Money Around Price (IOMAP) indicator, which identifies key support and resistance levels based on wallet-level accumulation, reveals strong buying interest around the $3,626 price zone.
Approximately 3.48 million addresses acquired nearly 7 million ETH at this level, forming a substantial on-chain support cluster. This suggests that many holders are either in profit or close to breaking even, making it a psychologically significant level.
ETH In/Out of Money Around Price | Credit: IntoTheBlock
From a technical analysis standpoint, Ethereum’s daily chart has formed a bull flag pattern. Furthermore, the ETH price action is currently testing the upper boundary of the flag’s descending trendline, indicating a potential breakout may be underway.
A decisive move close to this trendline would confirm the pattern, potentially triggering a surge in bullish momentum. Besides that, the Bull Bear Power (BBP) has risen to the positive region again.
This rise in the BBP reading indicates that bears are no longer dominant. Hence, Ethereum’s price will likely break the overhead resistance at $4,116.
Once this happens, the cryptocurrency’s next move might be to hit its all-time high. If sustained, ETH might climb to a new all-time high of $5,809.
Disclaimer:
The information provided in this article is for informational purposes only. It is not intended to be, nor should it be construed as, financial advice. We do not make any warranties regarding the completeness, reliability, or accuracy of this information. All investments involve risk, and past performance does not guarantee future results. We recommend consulting a financial advisor before making any investment decisions.
Victor Olanrewaju is a crypto analyst and reporter at CCN with deep roots in on-chain research and technical analysis. His crypto journey began in 2017, but it was the 2020 Uniswap airdrop that sparked a full-time pivot into the space.
With a foundation in copywriting, Victor honed his craft creating high-converting content for leading crypto brokers — most notably an XRP price prediction that ranked #1 on Google during the 2021 bull run.
He later joined AMBCrypto in 2022, where he combined storytelling with technical and on-chain analysis to cover key market narratives.
In 2024, he expanded his expertise at BeInCrypto, collaborating with analysts and using tools like Glassnode, Santiment, and IntoTheBlock to break down Bitcoin and altcoin trends.
At CCN, Victor covers the top cryptocurrencies, memecoins, macro shifts, blending real-time insights with deep-dive metrics.
He holds a Bachelor’s degree in Physics from the University of Ibadan, equipping him to simplify complex data for a wide audience. Follow his work or connect on LinkedIn or X.