Algorand's price forecast reveals both risks and massive upside potential.
Share
Key Takeaways
While ALGO trades inside resistance, long-term projections are optimistic.
ALGO price predictions range from $0.12 to $0.85 and 2025 and 2026.
Algorand is attempting to break out from a horizontal resistance area.
Like many other altcoins, Algorand (ALGO) has been involved in an extended correction. However, it has rebounded in the last two weeks.
While the price action is positive, it is essential to examine the fundamentals and technical outlook. In this analysis, CCN examines the Algorand price prediction for 2025, 2026, and 2030.
Algorand Price Prediction
ALGO’s price has increased lately, and the altcoin might hit new highs before 2025 ends. Thus, we examined this segment’s Algorand price prediction for 2025, 2026, and 2030.
The wave count method will determine the average targets, while the minimum and maximum predictions depend on the price movement during the year.
Minimum ALGOPrice Prediction
Average ALGOPrice Prediction
Maximum ALGO Price Prediction
2025
$0.146
$0.610
$0.867
2026
$0.110
$0.170
$0.851
2030
$0.10
$0.30
$1
The most likely wave count shows that the ALGO price completed a five-wave downward movement (red) since November 2021.
Then, it started an A-B-C correction in July 2023 and is currently in wave C.
Try Our Recommended Crypto Exchanges
Sponsored
Disclosure
We sometimes use affiliate links in our content, when clicking on those we might receive a commission at no extra cost to you. By using this website you agree to our terms and conditions and privacy policy.
If wave C is 1.61 times longer than wave one, the ALGO price could reach a high of $0.867 before beginning another lengthy correction.
During these projected upward and downward movements, the wave count method gives Algorand price predictions of $0.610 and $0.170 for the end of 2025 and 2026, respectively.
Finally, we will use the daily rate of increase for the past five years to make an Algorand price prediction for the end of 2030.
ALGO has increased by only 5% since July 2020, and projecting this rate of increase until the end of 2030 leads to a price of $0.30.
Algorand Price Prediction for 2025
The wave count method gives an Algorand price prediction range between $0.146 and $0.867 for the end of 2025.
Algorand Price Prediction for 2026
The wave count method gives an Algorand price prediction range between $0.110 and $0.851 for the end of 2025.
Algorand Price Prediction for 2030
The wave count method combined with the daily rate of increase leads to an Algorand price prediction range between $0.10 and $1 for the end of 2030.
ALGO Price Analysis
The ALGO price fell by 76% under a descending resistance trend line between December 2024 and June 2025.
However, the momentum shifter afterward, and ALGO bounced, confirming the $0.160 horizontal area as support.
Even though it did not break out from the resistance trend line on the first try, the price of ALGO created a higher low in June and broke out last week.
Today, the ALGO price is knocking on the door of the $0.285 horizontal resistance area. This isn’t just a horizontal resistance area; it is a critical level that has thwarted every attempt at moving upward for over two years.
The only exception has been the aforementioned December 2024 high, but that was a deviation that led to a massive plunge.
So, a weekly close above this level will confirm the correction is finally over, paving the way for new highs.
Momentum indicators support the bullish ALGO prediction. The Relative Strength Index (RSI) and Moving Average Convergence/Divergence (MACD) trend upward.
ALGO Short-Term Price Prediction
The ALGO price prediction for the next 24 hours is bullish. ALGO will likely break out from the $0.285 resistance area and move to new highs.
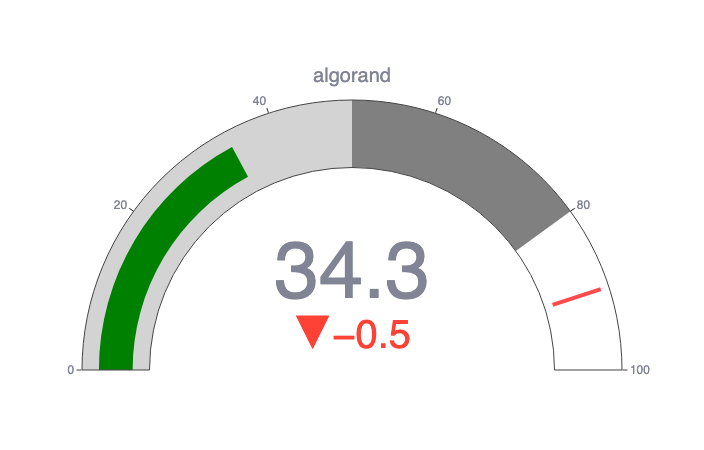
CCN Strength Index
The CCN Strength Index combines an array of advanced market signals to measure the strength of individual cryptocurrencies over the last 30 days.
Every day, it assigns a strength score, ranging from 0 to 100, to the top 500 assets by market capitalization on CoinMarketCap, focusing on both trend direction and the intensity of price movements.
0 to 24: Assets exhibit significant weakness, showing signs of sustained downtrend behavior.
25 to 35: The price tends to move within stable bounds with minimal volatility.
36 to 49: Assets begin a stable uptrend but without strong surges.
50 to 59: Consistent growth with moderate price advances, building momentum.
60+: Sharp price movements and high demand indicate more substantial volatility and trend shifts.
The index dynamically adapts to rapid changes. For example, an asset experiencing a 100% increase within a short timeframe would see a sharp jump in its score to reflect the intensity of the rise.
However, should that asset stabilize at this new price level, the score will gradually taper down and align with the dampened momentum as the movement normalizes. The same principle applies to rapid declines: a sudden drop will spike the score downward, but the score will slowly adjust as volatility decreases.
We looked at the Uniswap price history and found the lowest prices on certain days, months, quarters, and weeks in the year, suggesting the best times to buy UNI.
Day of the Week
Sunday
Week
8
Month
January
Quarter
Algorand Price History
Let’s look at the Algorand price history. While past performance does not guarantee future results, it can help provide context when making or interpreting and Algorand price prediction.
0x1a9c8182c09f50c8318d769245bea52c32be35bc. This wallet held 371,311,163 ALGO, representing 37.13% of the total supply.
0x5a52e96bacdabb82fd05763e25335261b270efcb. This wallet held 28,944,013 ALGO, representing 2.89% of the total supply.
0x47173b170c64d16393a52e6c480b3ad8c302ba1e. This wallet held 23,047,480 ALGO, representing 2.30% of the total supply.
0xf977814e90da44bfa03b6295a0616a897441acec. This wallet held 17,086,502 ALGO, representing 1.71% of the total supply.
0x5069a64bc6616dec1584ee0500b7813a9b680f7e. This wallet also held 15,320,414 ALGO, representing 1.53% of the total supply.
Uniswap Supply and Distribution
Supply and Distribution
Figures
Total supply
10,000,000,000
Circulating supply (as of July 14, 2025)
8,642,649,223 (60.1% of total supply)
Holder distribution as of July 14, 2025
The top 10 holders owned nearly 50% of the total supply
Who Founded Algorand?
Algorand was founded in 2017 by computer scientist Silvio Micali. A winner of the prestigious Turing Award of 2012. It is generally recognized as the highest distinction in computer science and is often referred to as the“Nobel Prize of Computing.”
What Is Algorand?
Algorand seems to be a cutting-edge blockchain technology platform founded by Turing Award-winning computer scientist Silvio Micali. Algorand supports various applications, from decentralized finance (DeFi) to central bank digital currencies (CBDCs), offering advanced smart contract capabilities and low transaction fees.
FAQs
How many Algorand are there?
On July 14, 2025, about 8.62 billion ALGO were in circulation out of a total supply of 10 billion.
Will Algorand reach $1?
It could do, although it may take some time. In fact, price predictions based on technical analysis predict it will reach that level by 2030.
It is worth noting that ALGO has traded above the dollar before, most recently in 2022.
What is Algorand used for?
ALGO is used to pay for transactions on the Algorand blockchain, and it can also be bought, sold, and traded on exchanges.
Valdrin Tahiri is a cryptocurrency analyst and reporter at CCN, specializing in technical analysis with a focus on Elliott Wave theory, on-chain metrics, and fundamental research. He brings over seven years of experience in the crypto space as both a trader and writer.
He discovered cryptocurrencies in 2017 while earning his MSc in Financial Markets at the Barcelona School of Economics, which sparked a deep interest in blockchain and market dynamics. Since then, he’s contributed to top crypto outlets like BeInCrypto and CoinGape.
Valdrin also served as Community Manager of BeInCrypto’s Telegram group for three years, helping grow it into one of the largest crypto communities worldwide. His expertise in market structure and price patterns allows him to break down complex trends into clear, actionable insights.
He’s published thousands of articles covering altcoins, Bitcoin cycles, and macro trends.
Andrew Kamsky is a chart analyst and writer with a background in economics and ACCA certification. He has held roles at a Big Four firm, a fintech bank, and a listed bank specializing in currency hedging. His work explores Bitcoin, macro trends, and market structure. Outside finance, he's passionate about music, travel, and neon design.