XRP price often breaks out without warning. Here are the 3 chart signals traders watch to spot moves early. | Credit: CCN.com
Share
Key Takeaways
Key support and resistance zones, such as Fibonacci levels, operate as order magnets, triggering cascades when decisive breaks occur.
Technical signals become more appealing when paired with volume surges, on-chain data, and fundamental drivers such as news.
Common chart patterns that generate tension and often indicate rapid breakouts or crashes in XRP include bull flags and falling wedges.
Momentum indicators like MACD and RSI alert traders to potential reversals or accelerations, as well as weakening trends.
Ripple (XRP) price movements are often sharp, fast, and difficult to anticipate without understanding how crypto markets react to technical signals. Unlike assets that trend gradually, XRP has a long history of trading within tight ranges and then breaking out abruptly. These moves can occur within hours or days, catching both new and experienced market participants off guard.
This article explains why those sudden moves happen and which chart signals tend to appear before the XRP price accelerates.
What Causes Sudden Price Moves in XRP Price?
In the context of XRP, a “sudden” move typically refers to a high-velocity price shift of 10% to 20%, occurring within a window of just a few hours, often after days or weeks of stagnant trading. Cryptocurrencies like XRP trade 24/7 with high leverage available on exchanges. While high leverage and constant trading are staples of the crypto market, these dynamics are especially pronounced for XRP due to its high concentration among long-term holders and its massive derivatives volume. This liquidity profile means that when a price level finally breaks, the resulting “liquidation squeeze” is often more violent than that of more gradually trending assets like Bitcoin. Sudden moves happen when clusters of orders execute at once, often around technical levels where many participants place stops, take profits, or enter positions. For XRP, factors include:
Breaks of support or resistance that trigger stop-loss orders
Momentum shifts shown by indicators
Patterns that signal reversals or continuations
Volume spikes that confirm or accelerate direction
These elements create feedback loops. Buyers feel drawn to a breakout over resistance, while sellers are pulled to a break below support. They are amplified by external events, but the timing and intensity are frequently determined by technical signals.
Key Support and Resistance Levels for XRP
Support and resistance form horizontal zones where price has reversed multiple times. Traders identify them by looking at previous highs/lows, round numbers, or Fibonacci retracements, mathematical ratios like 38.2% and 61.8% that pinpoint where a price pullback is likely to stall.
For instance, in early 2026, XRP traders monitored the 61.8% “Golden Ratio” level near $1.74; when the price bounced precisely off this level, it provided a real-time “buy” signal by confirming that the broader bullish trend remained intact despite a temporary dip.
When price approaches these levels:
Support acts as a floor where buyers step in
Resistance acts as a ceiling where sellers dominate
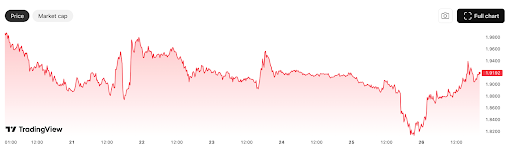
A bounce from support or rejection at resistance causes moderate moves. A decisive break sparks sudden volatility as orders cluster. XRP is defending zones around $1.90–$1.95 and $2.00, as of January 20, 2026. This stabilization occurred from holding between $1.90 and $1.95, while breaks below $2.00 reveal lower levels such as $1.64 (Fibonacci 0.382). Rallies are frequently capped by resistance around $2.20–$2.42 until volume clears it.
Breaks create cascades since traders and algorithms respond at the same time, transforming slow pressure into sudden shifts.
XRP/USD Daily Chart | Credit: TradingView
Common Chart Patterns That Trigger Sharp XRP Price Changes
Patterns emerge from price action and often precede breakouts or breakdowns.
Falling wedge: Converging downward trendlines show decreasing selling pressure. A breakout upward signals buyer control, as seen in recent two-day charts where XRP broke out, targeting higher levels.
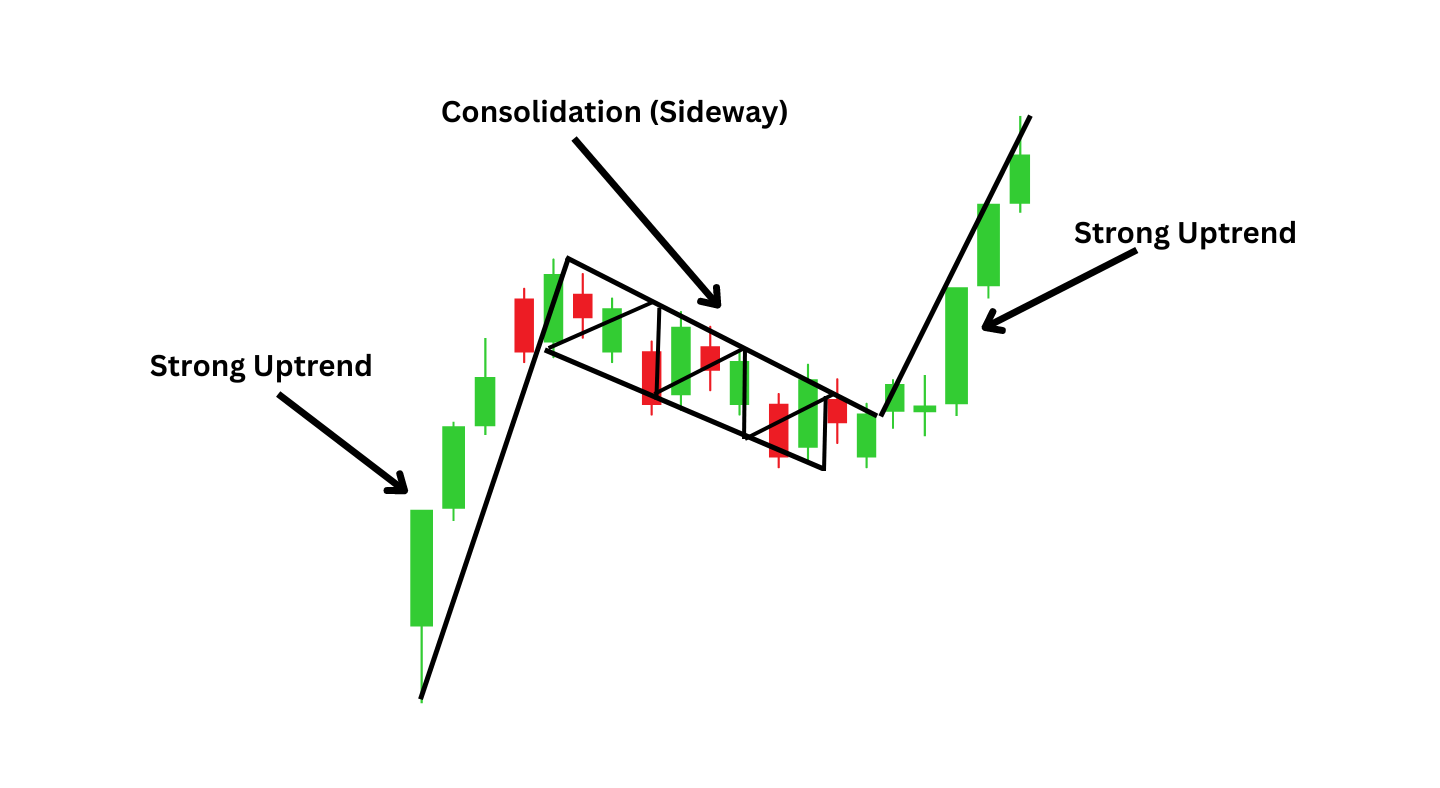
Bull flag: A consolidation after an upmove with parallel lines. Breakout projects the prior move’s length, often leading to quick gains.
Descending channel: Price oscillates lower with trendlines. Breaks above the upper line reverse bias; failures at lower lines accelerate declines.
Rising wedge: Upper trendline rejections with converging lines indicate bearish exhaustion but often break down.
These patterns build tension by funneling price action into a narrow range, but they are not infallible. Because XRP is prone to “fakeouts”, where the price briefly pierces a boundary only to reverse sharply, experienced traders look for a high-volume spike or a decisive candle close outside the pattern on a longer timeframe, like the 4-hour or Daily chart, to confirm that the move is genuine and not a temporary liquidity trap.
Bull flag chart pattern | Caption: Alchemy Markets
Momentum Indicators and Divergences for XRP Price
By evaluating the strength and speed of price changes, indicators help traders determine when momentum is increasing, decreasing, or reversing.
Relative Strength Index (RSI)
The range of the RSI is 0 to 100. Typically, an asset is “overbought” (likely prepared for a correction) if the reading is above 70, and “oversold” (likely ready for a bounce) if the reading is below 30.
In sudden XRP moves, look for Divergence. If the price makes a new low but the RSI makes a higher low, it suggests the downward pressure is losing steam. This “hidden” strength often precedes a sudden upward reversal.
MACD (Moving Average Convergence Divergence)
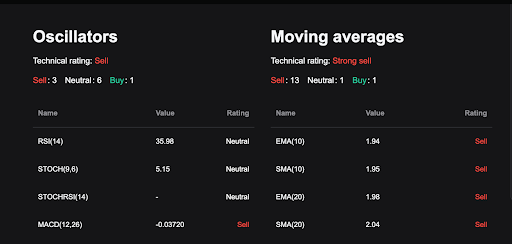
The MACD is useful for spotting shifts in a trend’s strength and direction. It makes use of a histogram and two lines: a MACD line and a Signal line. For XRP, these crossovers are especially important because the asset frequently experiences extended periods of “sideways” trading where the MACD lines hug the zero level. A sudden, wide gap between these lines frequently serves as the first technical confirmation that a multi-week consolidation phase is ending and a high-velocity move is beginning. The MACD line crosses above the Signal line to create a “Bullish Crossover.”
XRP/USD technical analysis with RSI and MACD metrics | Credit: Bitget
How These Signals Interact in Real Scenarios
Signals combine to create conviction. A falling wedge breakout paired with bullish RSI divergence and rising volume often leads to accelerated upside. Downside scenarios emerge when bearish MACD crossovers align with support breaks and volume spikes on liquidations. For example, in early January 2026, XRP’s brief push higher stalled as MACD showed bearish momentum and volume failed to sustain, contributing to a 12%+ correction from peaks near $2.35 toward $1.81–$1.93 by late January. Around January 23–25, bullish divergences on RSI near $1.85–$1.90 demand zones suggested potential stabilization, though weak open interest and Exchange Traded Fund (ETF) outflows limited immediate follow-through.
External Catalysts: Why XRP Fundamentals Still Matter
While charts show us the “how,” news often provides the “why.” Due to its history with the SEC, XRP’s price is particularly sensitive to changes in laws and regulations.
Significant price changes can frequently correspond with:
Court rulings: Significant developments in the Ripple vs. SEC case.
Announcements of partnerships: New financial institutions or banks are joining the Ripple Payments network.
Exchange re-listings: When major platforms add or remove the token.
When technical signals and fundamental developments, caused by news, align, traders call it “confluence.” For XRP, which often trades sideways during uncertainty, this overlap helps explain sudden price moves and makes sharp breakouts easier to interpret rather than surprising. While news often provides the spark for a breakout, XRP’s technical structure frequently dictates the exact timing of the move. Historical data suggests that even when a catalyst, like a court ruling, is anticipated, the price often remains stagnant until the chart reaches a point of maximum compression, such as the apex of a multi-month triangle.
In these cases, the technical “coiling” ensures the market is liquid and ready to react, meaning the breakout happens because the chart was structurally prepared, not just because the news occurred.
Why does the XRP price move so suddenly compared to other cryptocurrencies?
XRP often trades in tight ranges before breaking key technical levels. When support or resistance breaks, clustered stop-losses, leverage, and algorithmic trading can trigger rapid price moves within minutes or hours.
Which indicators best predict sudden XRP breakouts or crashes?
Momentum indicators like RSI and MACD, when combined with volume spikes and key support or resistance levels, are among the most reliable signals for anticipating high-velocity XRP moves.
Do chart patterns really matter for XRP price action?
Yes. Patterns such as bull flags, falling wedges, and descending channels often build price tension. Once these patterns break, XRP frequently experiences sharp and accelerated moves.
Can news events override XRP technical signals?
News doesn’t replace technicals, but it can amplify them. When regulatory updates, court rulings, or exchange listings align with bullish or bearish chart signals, XRP price reactions tend to be faster and more extreme.
Disclaimer:
The information provided in this article is for informational purposes only. It is not intended to be, nor should it be construed as, financial advice. We do not make any warranties regarding the completeness, reliability, or accuracy of this information. All investments involve risk, and past performance does not guarantee future results. We recommend consulting a financial advisor before making any investment decisions.
Curious about how technology and crypto reshape global finance, Elizaveta Savenko explores blockchain, AI, decentralized systems, their applications, and regulatory requirements. She contributes to research, educational initiatives, and industry collaborations, examining trends in digital assets and fintech innovation, increasing awareness of the crypto space and its impact on financial systems.


 Easy
Easy