How High Can Bitcoin Price Go in 2026? BTC Holds $68K as Jane Street’s 10 AM Manipulation Pattern Allegedly Stops
Share
Key Takeaways
Bitcoin’s recurring 10 A.M. volatility appears primarily driven by institutional flows, ETF hedging, and high-frequency trading activity rather than verified manipulation by any single firm.
There is currently no regulatory or trading evidence proving that Jane Street is deliberately suppressing Bitcoin’s price, despite persistent social media speculation.
With BTC holding near the critical $68K–$70K zone, the market looks like a mid-to-late cycle consolidation phase where further upside remains possible but less explosive than early cycles.
Based on historical patterns and macro drivers, the most realistic 2026 targets cluster between $95K and $180K, with $200K+ requiring significantly stronger liquidity and institutional tailwinds.
Bitcoin is once again sitting at a technically critical level. With BTC holding above $68,000 and chatter growing around the alleged “10 AM dump” pattern, traders are debating whether a key source of intraday pressure is fading and what that could mean for the 2026 cycle.
Below is a clear breakdown of what the Jane Street theory actually claims, what evidence exists (and doesn’t), and realistic Bitcoin price targets for 2026 based on macro cycle dynamics.
What the Jane Street Theory Actually Says
Across crypto X and analyst chatter, a persistent theory has taken hold:
Some market watchers also claim Jane Street has the speed, balance sheet, and ETF exposure to influence short-term flows, at least temporarily.
Despite the popularity of the narrative, hard proof is lacking.
There is no regulatory finding that Jane Street manipulates Bitcoin
No public trading data conclusively links one firm to the pattern
Intraday volatility around major market opens is common across many assets
Jeff Park Says the Jane Street Question Is More Structural Than Conspiratorial
The viral question circulating across crypto markets, “Is Jane Street why Bitcoin isn’t at $150K?,” has drawn a measured response from Jeff Park, CIO at ProCap and advisor to Bitwise Invest. His view: the situation is more complicated than the conspiracy framing suggests, and the real issue may lie in how the Bitcoin ETF ecosystem is designed.
Everyone is asking: "Is Jane Street why Bitcoin isn't at $150k?"
As expected, the answer is trickier than the question. But it's also more structurally unsettling than the conspiracy theory itself—and once you understand the actual mechanics, you won't be able to unsee them👇 pic.twitter.com/iLEeJpDeo4
Park argues that focusing narrowly on Jane Street misses the bigger structural picture. The mechanics being debated are not unique to one trading firm but apply broadly to all Authorized Participants (APs) operating within the Bitcoin ETF framework. In his telling, if distortions exist, they are largely a function of market structure and regulatory plumbing rather than coordinated suppression by a single player.
A key point Park highlights is what he describes as a regulatory “gray window” embedded in ETF market making. Under Regulation SHO, traditional short sellers must typically locate shares before shorting. However, ETF Authorized Participants receive certain exemptions tied to the creation and redemption process.
Procedurally this is legitimate, but practically it allows APs to short ETF shares and then manufacture shares through creation without the same borrow constraints that apply in normal equity shorting. Park notes this dynamic can resemble regulatory arbitrage, though it is fundamentally built into the system rather than being evidence of misconduct.
He also emphasizes that how APs hedge their exposure matters greatly for Bitcoin’s spot demand. In a textbook arbitrage, if an ETF trades above NAV, the arbitrageur would short the ETF and buy the underlying asset – spot Bitcoin. But in practice, Park notes, many desks hedge using BTC futures instead of spot. When that happens, the mechanical spot buy that many market participants assume will occur may never materialize. This can subtly dampen the direct transmission of ETF flows into spot market demand, even though the arbitrage trade itself is functioning as designed.
Another evolution Park points to is the shift toward in-kind creation and redemption. Under earlier cash-heavy workflows, ETF creations often forced custodians to purchase spot Bitcoin, creating clear mechanical demand. In-kind processes give Authorized Participants more flexibility in how they source and deliver Bitcoin, potentially improving efficiency but also making flow impacts less straightforward to interpret from the outside.
Importantly, Park stops short of alleging any explicit suppression. His bottom line is careful: there is no clear evidence that any single Authorized Participant is deliberately holding Bitcoin down. However, he suggests the structure of the ETF ecosystem can influence how price discovery propagates through the market. That distinction is critical. The beginning and end of the ETF arbitrage loop may look like normal market making, but the position construction and hedging choices in the middle layer can introduce frictions that traders may misinterpret as intentional pressure.
For investors watching Bitcoin’s path into 2026, Park’s framework implies that even if intraday patterns exist, they are unlikely to override the dominant macro drivers that have historically powered BTC cycles, such as global liquidity, ETF net flows, and the post-halving supply dynamic. The plumbing matters, but it does not automatically translate into a ceiling on Bitcoin’s long-term price trajectory.
‘10 Am Suppression’ Fades — What Changes in the Crypto Market?
Assume the bullish thesis many traders are increasingly watching. Bitcoin continues to hold firm above the $67,000–$68,000 support zone, spot ETF demand remains intact, overall market liquidity improves, and the frequency of forced liquidations declines. Under this combination of conditions, the structural backdrop for BTC would remain consistent with a post-halving expansion phase extending through the 2025–2026 window.
Supporters of the “suppression fading” narrative argue recent price action may already be hinting at a shift. According to Bull Theory (@BullTheoryio), the crypto market added more than $200 billion in market value within roughly 48 hours following legal headlines involving Jane Street. The account highlighted strong short-term moves across major assets, including:
BTC: +9%
ETH: +14%
DOT: +35%
BNB: +9%
LINK: +15%
SOL: +15%
Crypto market has added over $200 BILLION in just 48 hours. | Source: @BullTheoryio on X
The same commentary noted that, for the first time in roughly two months, the market did not experience the persistent early-session selling pressure that many traders had been watching.
While this observation has fueled bullish sentiment, it is important to distinguish correlation from causation. Short-term market rallies can be driven by a wide range of factors, including positioning squeezes, macro liquidity shifts, derivatives resets, and simple momentum effects. At present, there is no confirmed evidence that any single firm’s activity, or lack thereof, directly caused the move.
Even so, if recurring intraday sell pressure were to structurally diminish, the most likely impact would be smoother trend continuation rather than a sudden step-change in Bitcoin’s long-term trajectory. The primary drivers of the 2025–2026 cycle would still be ETF flows, global liquidity conditions, and post-halving supply dynamics.
ChatGPT’s Bitcoin Price Targets for 2026
Looking across prior market cycles shows a clear pattern of diminishing but still meaningful returns:
2013 cycle: approximately 10× from the prior all-time high
2017 cycle: approximately 3×
2021 cycle: approximately 2×
The trajectory is unmistakable. Each cycle delivers smaller multiples than the last, yet the expansion phases have still produced substantial upside when liquidity, adoption, and supply dynamics align.
Based on historical behavior, institutional flow patterns, and macro liquidity conditions, three realistic bull regimes emerge for the 2026 timeframe.
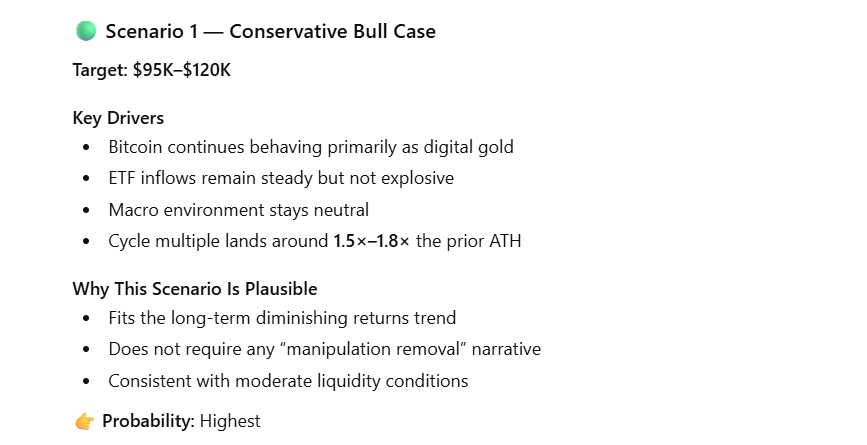
Scenario 1 — Conservative Bull Case
Target: $95,000–$120,000 (Probability: highest)
In the base case, Bitcoin continues to mature into a macro asset that behaves primarily as digital gold. ETF inflows remain steady but do not accelerate dramatically, and the broader macro environment stays relatively neutral.
Key drivers include:
Bitcoin maintaining its role as a store-of-value asset
Consistent but unspectacular ETF demand
No major global liquidity surge
A cycle multiple landing around 1.5×–1.8× the prior all-time high
This outcome fits neatly within the long-term pattern of diminishing returns. Importantly, it does not require any change in the alleged intraday dynamics and is consistent with moderate financial conditions.
Conservative bull case. | Source: ChatGPT
Scenario 2 — Strong Cycle Expansion
Target: $140,000–$180,000
A stronger bull phase would require a more supportive macro backdrop and renewed institutional momentum. In this scenario, spot ETF flows re-accelerate, interest rate cuts expand global liquidity, and the sovereign or corporate adoption narrative gains credibility. At the same time, long-term holders continue to restrict available supply.
Key drivers include:
Accelerating spot ETF inflows
Easier monetary policy and improving liquidity
Growing institutional or sovereign participation
Persistent supply tightness from long-term holders
From a simple cycle math perspective, if Bitcoin roughly doubles the prior all-time high near $69,000, the base projection lands around $138,000. Historical overshoot behavior in bull markets would naturally place the upper range in the $150,000–$180,000 zone.
For this scenario to play out, several conditions likely need to hold:
Bitcoin dominance remains relatively firm
No major adverse regulatory shock emerges
Broader risk assets remain supported
This zone represents the most realistic “strong bull” outcome if macro tailwinds cooperate.
Scenario 3 — Supercycle or Reflexive Melt-Up
Target: $220,000–$300,000 (Probability: low but non-zero)
The most aggressive upside case requires multiple powerful tailwinds to align simultaneously. This is the scenario often associated with supercycle narratives.
Key requirements would include:
Massive ETF inflows, potentially including pension-scale allocation waves
A meaningful global liquidity surge resembling QE-style conditions
Widespread corporate balance sheet adoption
A late-cycle return of retail speculation and momentum chasing
Some traders link this outcome to the idea that if intraday suppression truly disappears, volatility could compress upward, liquidation cascades could flip bullish, and reflexive price dynamics could accelerate.
However, even in this optimistic framework, the dominant drivers would still be liquidity and demand expansion rather than the behavior of any single market-making firm.
Key Reality Most Bitcoin Traders Miss
Even if the 10 AM pattern is real, its likely impact is limited in scope. Intraday flows can and do influence:
Short-term volatility
Liquidation clusters
Tactical entry and exit timing
But historically, Bitcoin’s multi-year trajectory has been governed primarily by much larger forces:
Global liquidity conditions
Net spot ETF flows
The halving-driven supply shock
Broad risk appetite across financial markets
Short-term algorithms can move the market in bursts, but they have rarely dictated the full cycle outcome.
Where Bitcoin Sits in the 2026 Price Cycle (Late February 2026 Snapshot)
Bitcoin is trading around $68K (at the time of writing) and has briefly probed $70K but failed to hold it, which is more consistent with retesting a major prior-cycle level than cleanly reclaiming it.
So where does that place BTC in the cycle?
The most defensible framing is: a mature-cycle consolidation/retake attempt inside the post-halving window, where upside is still possible but no longer “early-cycle explosive.” This is the phase where the market often alternates between sharp squeezes and frustrating pullbacks as leverage resets and institutional flows dominate.
The key arguments for this “mid-to-late cycle, not blow-off” positioning are:
Price structure: BTC is hovering around the psychologically and technically important $69K region, but the market is still showing “touch-and-fade” behavior near $70K rather than a decisive breakout and acceptance above it.
Flow drivers are institutional and mechanical: ETF-related flows and hedging decisions can move the tape without necessarily creating persistent spot-buy pressure every time. This is central to Jeff Park’s point: ETF plumbing can weaken the simple “ETF inflows = spot rocket” assumption, especially if hedging is implemented through futures and other instruments.
Volatility regime: The market is still experiencing sharp multi-day swings (both up and down), which is typical of a cycle that hasn’t transitioned into a stable late-stage euphoria yet, but also isn’t in quiet accumulation.
In short: late February 2026 looks like a contested inflection zone – still within the post-halving era, but not behaving like a clean breakout trend yet.
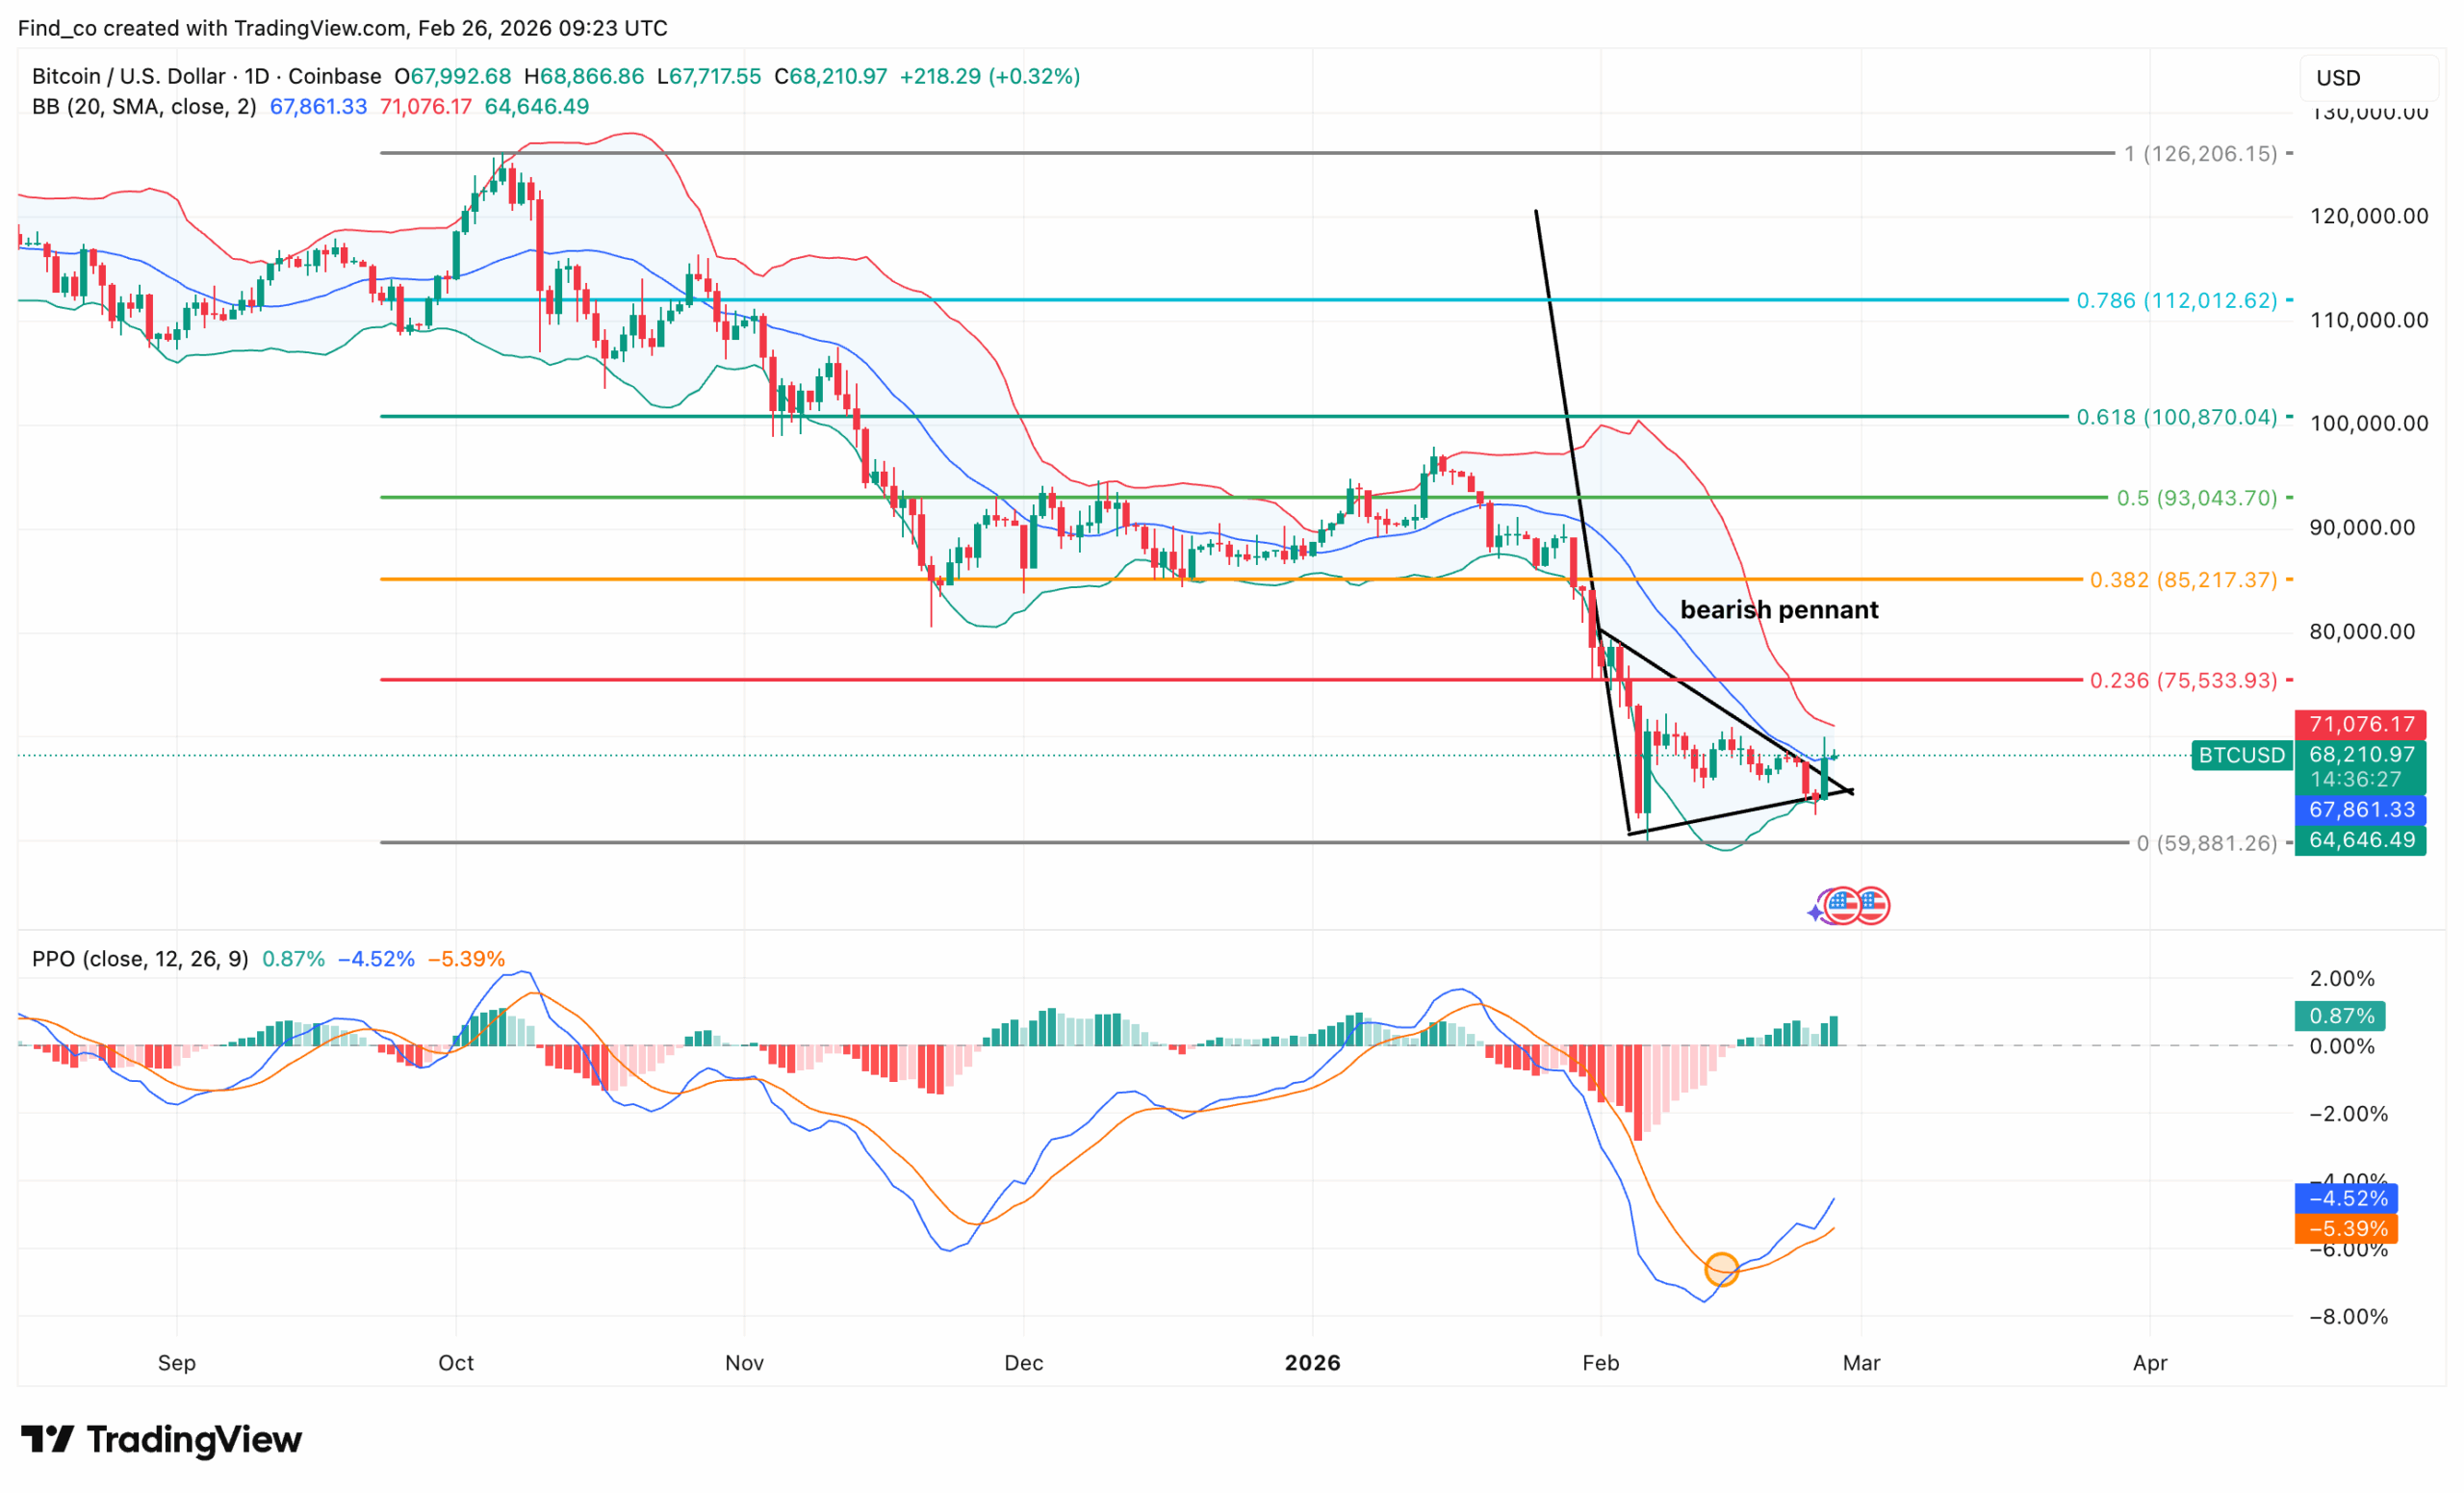
What Bitcoin Technical Indicators Suggest About the Next Major Move
From a technical standpoint, BTC/USD is currently fighting to maintain its footing amid a bearish pennant pattern on the daily chart.
Despite a brief 24-hour rebound from local lows near $64,700, the flagship cryptocurrency remains significantly below its 2025 peak of $126,200.
Looking closely at the attached chart, it highlights a sharp vertical drop followed by a tightening consolidation range.
This structure, known as a bearish pennant, typically signals a temporary pause before a continuation of the primary downtrend.
Here is what the entire outlook suggests could be next for Bitcoin’s price:
Resistance: The upper boundary of the pennant and the 0.236 Fibonacci level ($75,533) act as immediate resistance for bulls.
Support: The psychological floor sits at $60,000. A breakdown below the pennant’s lower trendline could trigger a slide toward the $58,000 support zone.
Indicators: The Bollinger Bands are narrowing, which suggests a volatility explosion is imminent. Meanwhile, the PPO (Percentage Price Oscillator) remains stuck below the zero line, confirming that bearish momentum still controls the medium-term trend.
For BTC to approach seven figures within this cycle, several extraordinary developments would likely need to occur simultaneously:
Sovereign or central bank accumulation at scale
Pension-level ETF allocations far exceeding current flows
A major global liquidity expansion comparable to 2020–2021
Accelerating corporate treasury adoption
A broad loss of confidence in major fiat systems
From a market-cap perspective, $1 million Bitcoin would require tens of trillions in incremental value, a step change far beyond the clear historical pattern of diminishing cycle returns.
Nothing in current ETF flows, liquidity conditions, or adoption curves suggests that kind of exponential phase transition is underway in 2026. While not impossible over the very long term, it remains a low-probability outcome for this cycle.
So…How High Can Bitcoin Price Go in 2026?
Based on where BTC actually sits in late February 2026, around $68K with repeated tests near $70K, the most grounded answer is that Bitcoin’s 2026 ceiling is less about a single “suppression switch” turning off and more about whether the market can transition from retest/rejection into acceptance/trend.
If that transition happens and liquidity cooperates, the plausible 2026 zones are:
$95K–$120K (most likely bull continuation)
$140K–$180K (strong bull if breakout + flows sustain)
$220K–$300K (melt-up, lower probability)
However, the ultimate ceiling for 2026 will be determined far more by liquidity, adoption, and supply dynamics than by any intraday trading pattern.
Is there proof that Jane Street is behind Bitcoin’s 10 A.M. crash?
No. Despite widespread speculation on crypto social media, there is currently no regulatory finding or verified trading data proving that Jane Street is deliberately manipulating Bitcoin at the U.S. market open. Most analysts, including Jeff Park, argue the observed volatility is more likely tied to ETF mechanics, institutional hedging
Why does Bitcoin often drop around the US market open?
The 9:30–10:30 a.m. ET window is when U.S. equity trading, ETF flows, macro data releases, and high-frequency trading activity all converge. This surge in institutional and algorithmic activity can strain crypto liquidity and trigger leveraged liquidations, producing the sharp “wipe then recover” pattern frequently seen in Bitcoin’s morning price action.
Could Bitcoin still reach six figures in 2026?
Yes, under reasonable bull-market conditions. Based on historical cycle behavior and current macro trends, the most likely 2026 range is roughly $95,000–$120,000 in a conservative continuation scenario. Stronger liquidity and ETF inflows could push BTC toward $140,000–$180,000, while a full melt-up environment could stretch prices toward the $220,000–$300,000 zone, though with lower probability.
Is a $1 million Bitcoin realistic for 2026?
A $1 million Bitcoin in this cycle is widely considered a low-probability outcome. Reaching that level by 2026 would likely require extraordinary developments such as sovereign-scale adoption, massive global liquidity expansion, and a major shift in the global monetary system. While not impossible over the very long term, current data suggests six-figure BTC is far more plausible for this cycle.
Disclaimer:
The information provided in this article is for informational purposes only. It is not intended to be, nor should it be construed as, financial advice. We do not make any warranties regarding the completeness, reliability, or accuracy of this information. All investments involve risk, and past performance does not guarantee future results. We recommend consulting a financial advisor before making any investment decisions.
Onkar Singh has three years of experience as a digital finance content creator. Throughout his career, he has collaborated with various DeFi projects and crypto media outlets. In his leisure time, he enjoys fitness activities at the gym and watching movies across different genres. Balancing his professional and personal interests, Onkar continues to contribute to the digital finance landscape while pursuing his hobbies.
Victor Olanrewaju is a crypto analyst and reporter at CCN with deep roots in on-chain research and technical analysis. His crypto journey began in 2017, but it was the 2020 Uniswap airdrop that sparked a full-time pivot into the space.
With a foundation in copywriting, Victor honed his craft creating high-converting content for leading crypto brokers — most notably an XRP price prediction that ranked #1 on Google during the 2021 bull run.
He later joined AMBCrypto in 2022, where he combined storytelling with technical and on-chain analysis to cover key market narratives.
In 2024, he expanded his expertise at BeInCrypto, collaborating with analysts and using tools like Glassnode, Santiment, and IntoTheBlock to break down Bitcoin and altcoin trends.
At CCN, Victor covers the top cryptocurrencies, memecoins, macro shifts, blending real-time insights with deep-dive metrics.
He holds a Bachelor’s degree in Physics from the University of Ibadan, equipping him to simplify complex data for a wide audience. Follow his work or connect on LinkedIn or X.


 Easy
Easy