How High Can Bitcoin Price Go in 2026? BTC Holds $68K as Jane Street’s 10 AM Manipulation Pattern Allegedly Stops
Share
Key Takeaways
Bitcoin’s value has dropped by 52%, now approaching the psychological support level of $60,000.
Large outflows from spot Bitcoin ETFs and high-risk tech stock liquidations accelerated the price drop.
Optimistic traders interpret “extreme fear” sentiment and oversold RSI levels as indications that a market bottom is finally appearing.
A deeper technical decline toward the $37,000-$40,000 region could occur if $60,000 isn’t retained, analysts warn.
As of February 11, 2026, the price of Bitcoin (BTC) has fallen 52% from its peak of $126,000 in late 2025, and it is currently trading close to $60,000 in the midst of intense market volatility. This strong fall has divided investors: optimistic bulls claim that the dip indicates a buying opportunity at the key support level, while cautious bears point to technical patterns that indicate further losses ahead.
So, what might happen with BTC next, and why has it fallen? Based on past statistics and present indicators, this article examines the factors that led to the Bitcoin drop, considering both sides of the argument, and analysing potential future trends.
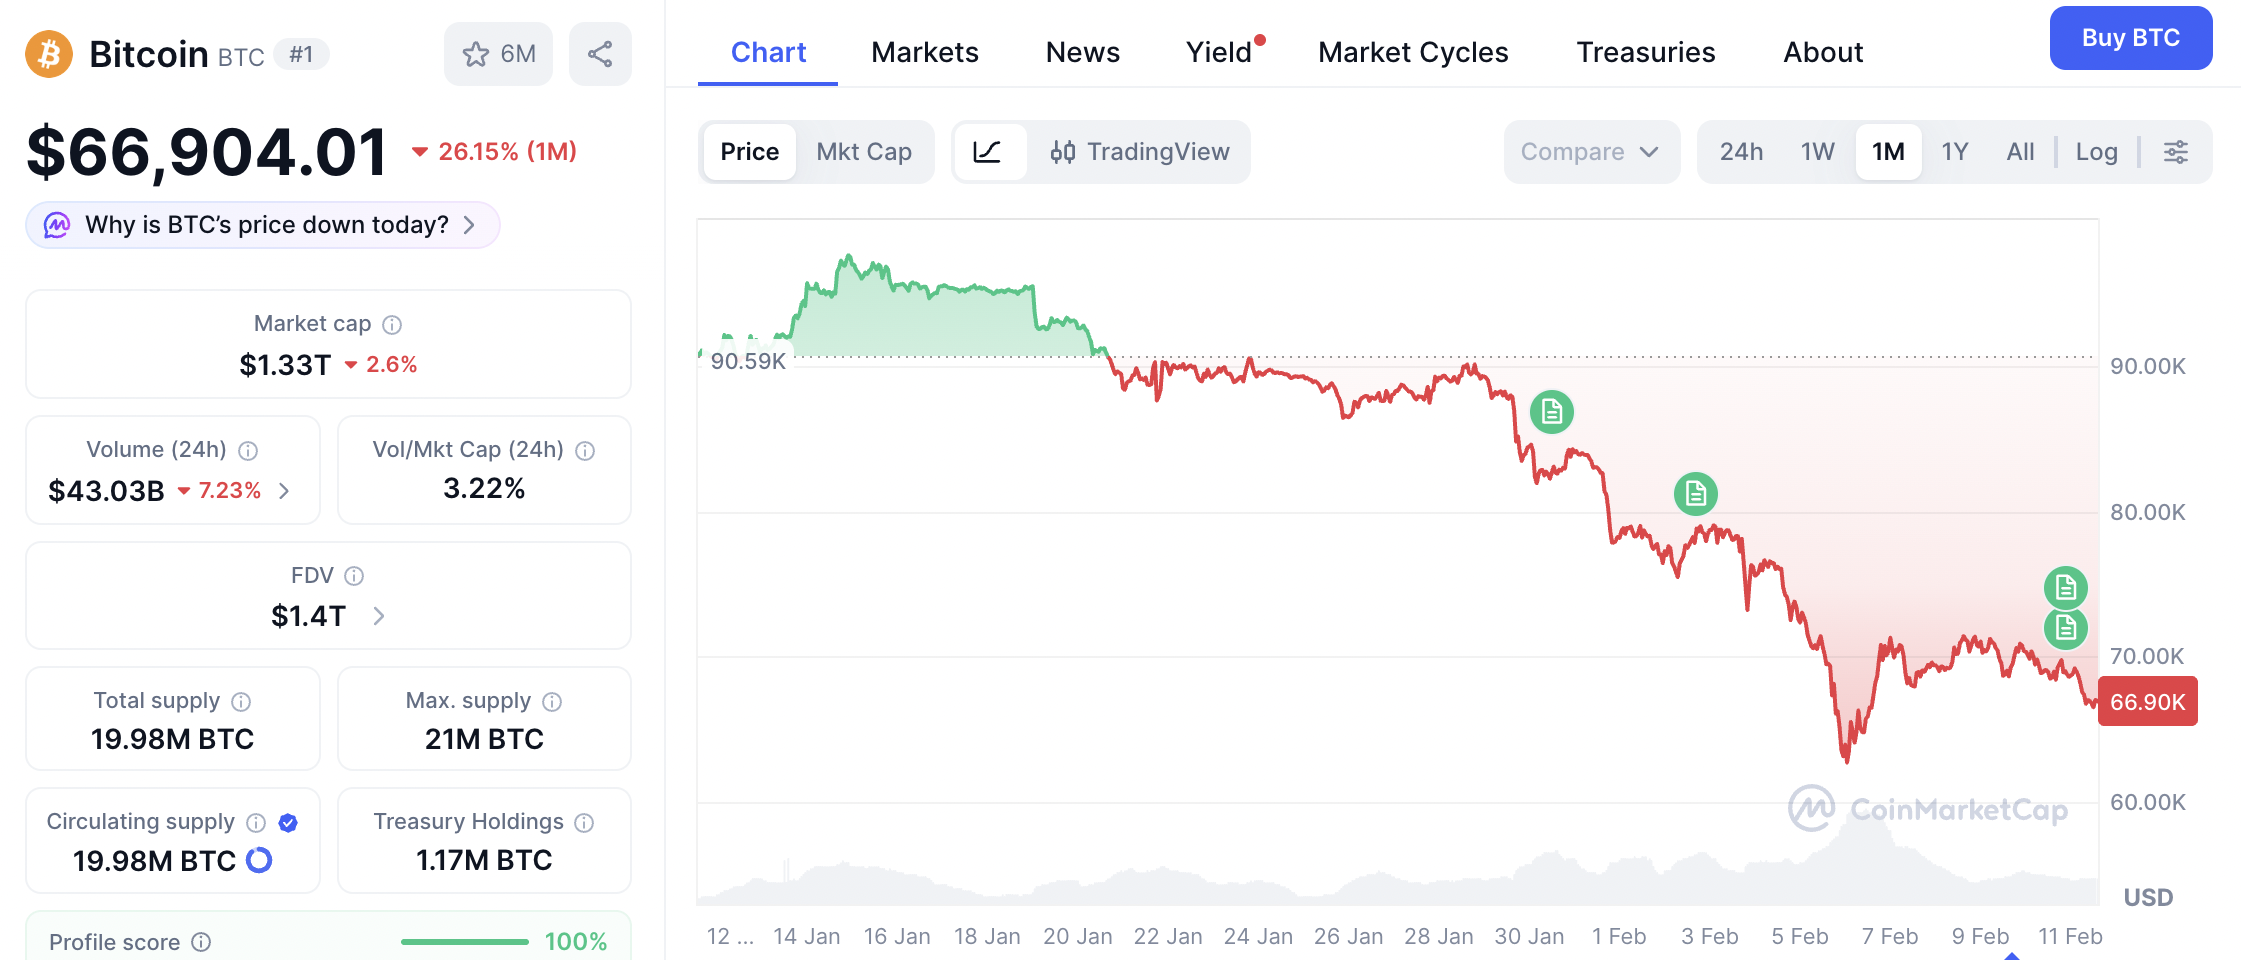
BTC price as of February 11, 2026 | Credit: CoinMarketCap.com
What Has Led to Bitcoin’s Fall?
Bitcoin’s slide began after peaking at $126,000 in October 2025, fueled by post-halving optimism and institutional inflows.
The fall accelerated in early 2026, falling to $59,930 on February 5 before briefly recovering to roughly $66,800. As liquidity started to dry up in early 2026, the digital gold narrative frayed, and Bitcoin began to trade like a high-risk tech stock rather than a reliable store of wealth. Several interrelated factors influenced this.
Firstly, macroeconomic pressures, coming from the Federal Reserve, paused rate cuts amid persistent inflation and a strengthening dollar, putting risk assets under strain. This can be compared to the bear market of 2022, when a 77% drawdown was caused by tightened policy. Bond yields climbed, and the prospect of a US government shutdown added to uncertainty, pushing investors to leave speculative assets such as Bitcoin.
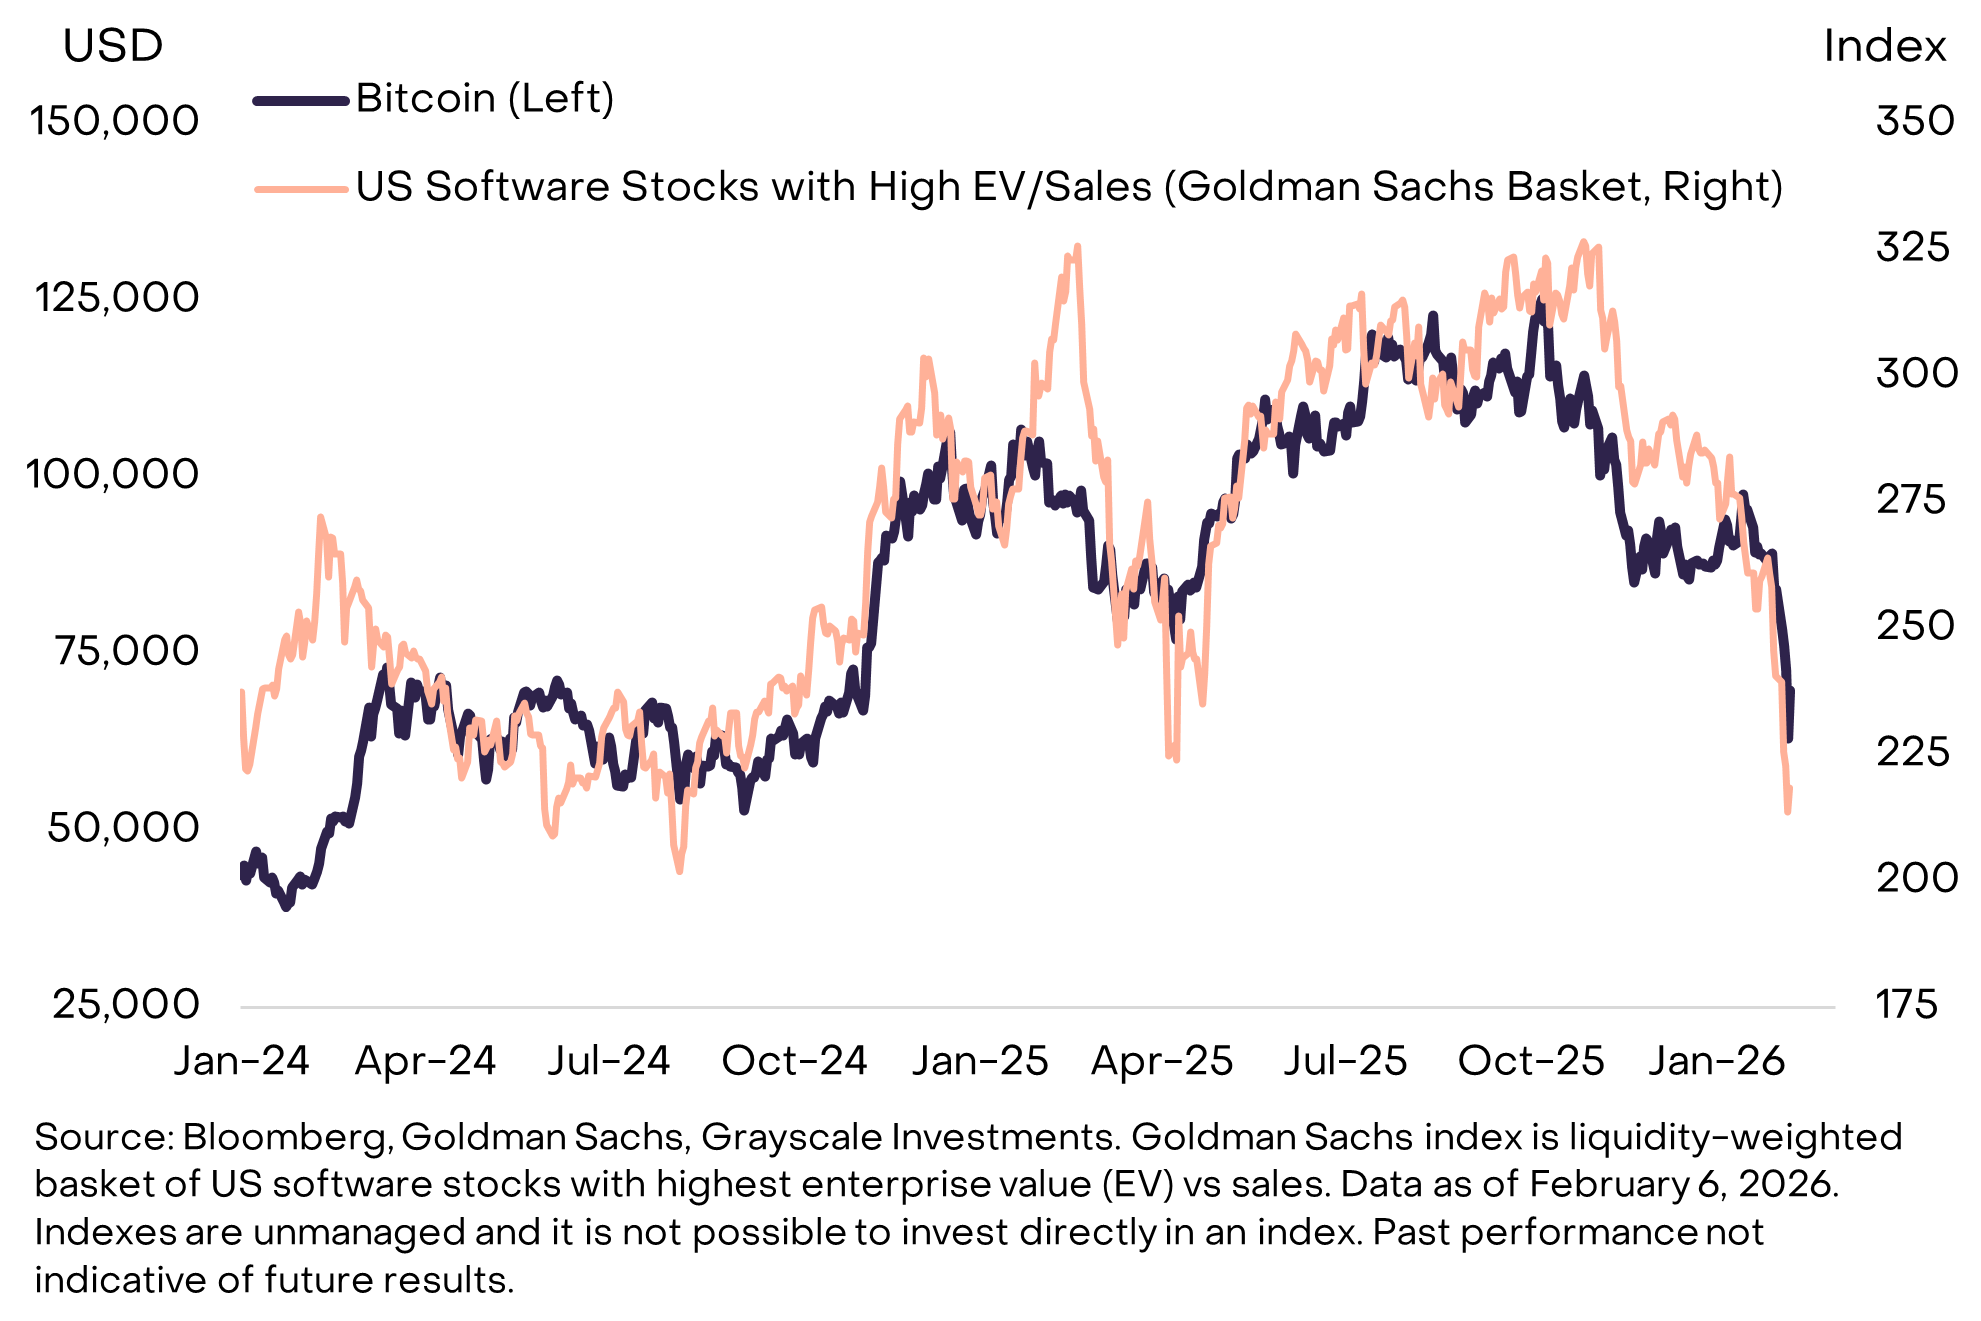
Institutional flight amplified the pain. Spot Bitcoin ETFs saw high net outflows, leaving holders with unrealized losses on an average cost base of almost $90,000. In line with equities sell-offs in the software and AI sectors, Grayscale experts observed that BTC was trading more like a tech stock than digital gold. Over $5.4B in liquidations struck leveraged holdings, causing a chain reaction in which declining prices drove forced sales.
Bitcoin price moving closely with software stocks | Credit: Grayscale.com
On-chain metrics revealed deeper issues. Major exchanges saw a 30% decline in aggregate spot trading volume to $700B, while open interest in Bitcoin and Ether futures plummeted 14% to $25B. Rising USDT dominance to 7.89% signaled capital outflows from crypto, a classic bearish sign. Negative net taker volume of -$272M on derivatives platforms showed sellers dominating.
Precious metals’ meltdown added fuel. Gold dropped 11% and silver 31%, leading to deleveraging where investors sold Bitcoin to cover margin calls in other assets.
Bulls’ Perspective: Signs of a $60K Bottom
Despite the carnage, many analysts argue that the worst is over. The bulls point to several technical and sentiment-based indicators suggesting a bottom is near.
Extreme fear as a contrarian signal: The Crypto Fear & Greed Index hits a record low of 7. Historically, such levels marked the final stages of a sell-off.
The 200-week moving average: This technical line is hovering around $58,000-$60,000. Long-term holders have started to re-accumulate at this level, which has been the “ultimate floor” in nearly every prior cycle.
Oversold conditions: The Relative Strength Index (RSI), which measures the pace and change of price moves, is below 30 on daily charts, the levels that haven’t been seen since the 2022 bear market, indicating that selling pressure has peaked.
Bulls believe that after the forced liquidations of over-leveraged traders are completed, the scarcity of Bitcoin will yet again push the price up.
Bears’ Outlook: Why a Drop to $37K Remains Possible
According to the bears, structural flaws still exist. Michael Burry identified a trend that resembled the 2021-22 market crash, indicating a decline to the $50,000s.Kaiko Research sees $60,000 as the midway point of a bear market, with a 60-68% retracement to $40,000-$50,000.
Bitcoin is now perfectly mirroring the pattern from 2017 and 2021.
According to this chart, $BTC will dump to $35,000 in 10 days.
Technicals reinforce this. As the 50-day EMA crosses below the 200-day, a death cross forms, Bitcoin trades below all of the key moving averages. MACD suggests negative momentum, and RSI at 29.94 approaches oversold but suggests a fall. A descending channel on daily charts points to $55,000 if $60,000 fails.
Bear risks include:
Failure to hold $65,800 support.
Continued ETF outflows and deleveraging.
No major catalysts amid macro uncertainty.
Bears warn that this could extend the bear market for 12 months.
Will BTC Price Rebound or Further Decline?
Key thresholds will determine the near future. Bitcoin’s rebound might begin if it breaks the $69,500-$72,000 resistance level, with a target of $76,000-$79,000. Historical oversold RSI and sentiment lows support this, with a possible 170% upside to $150,000 or more post-consolidation.
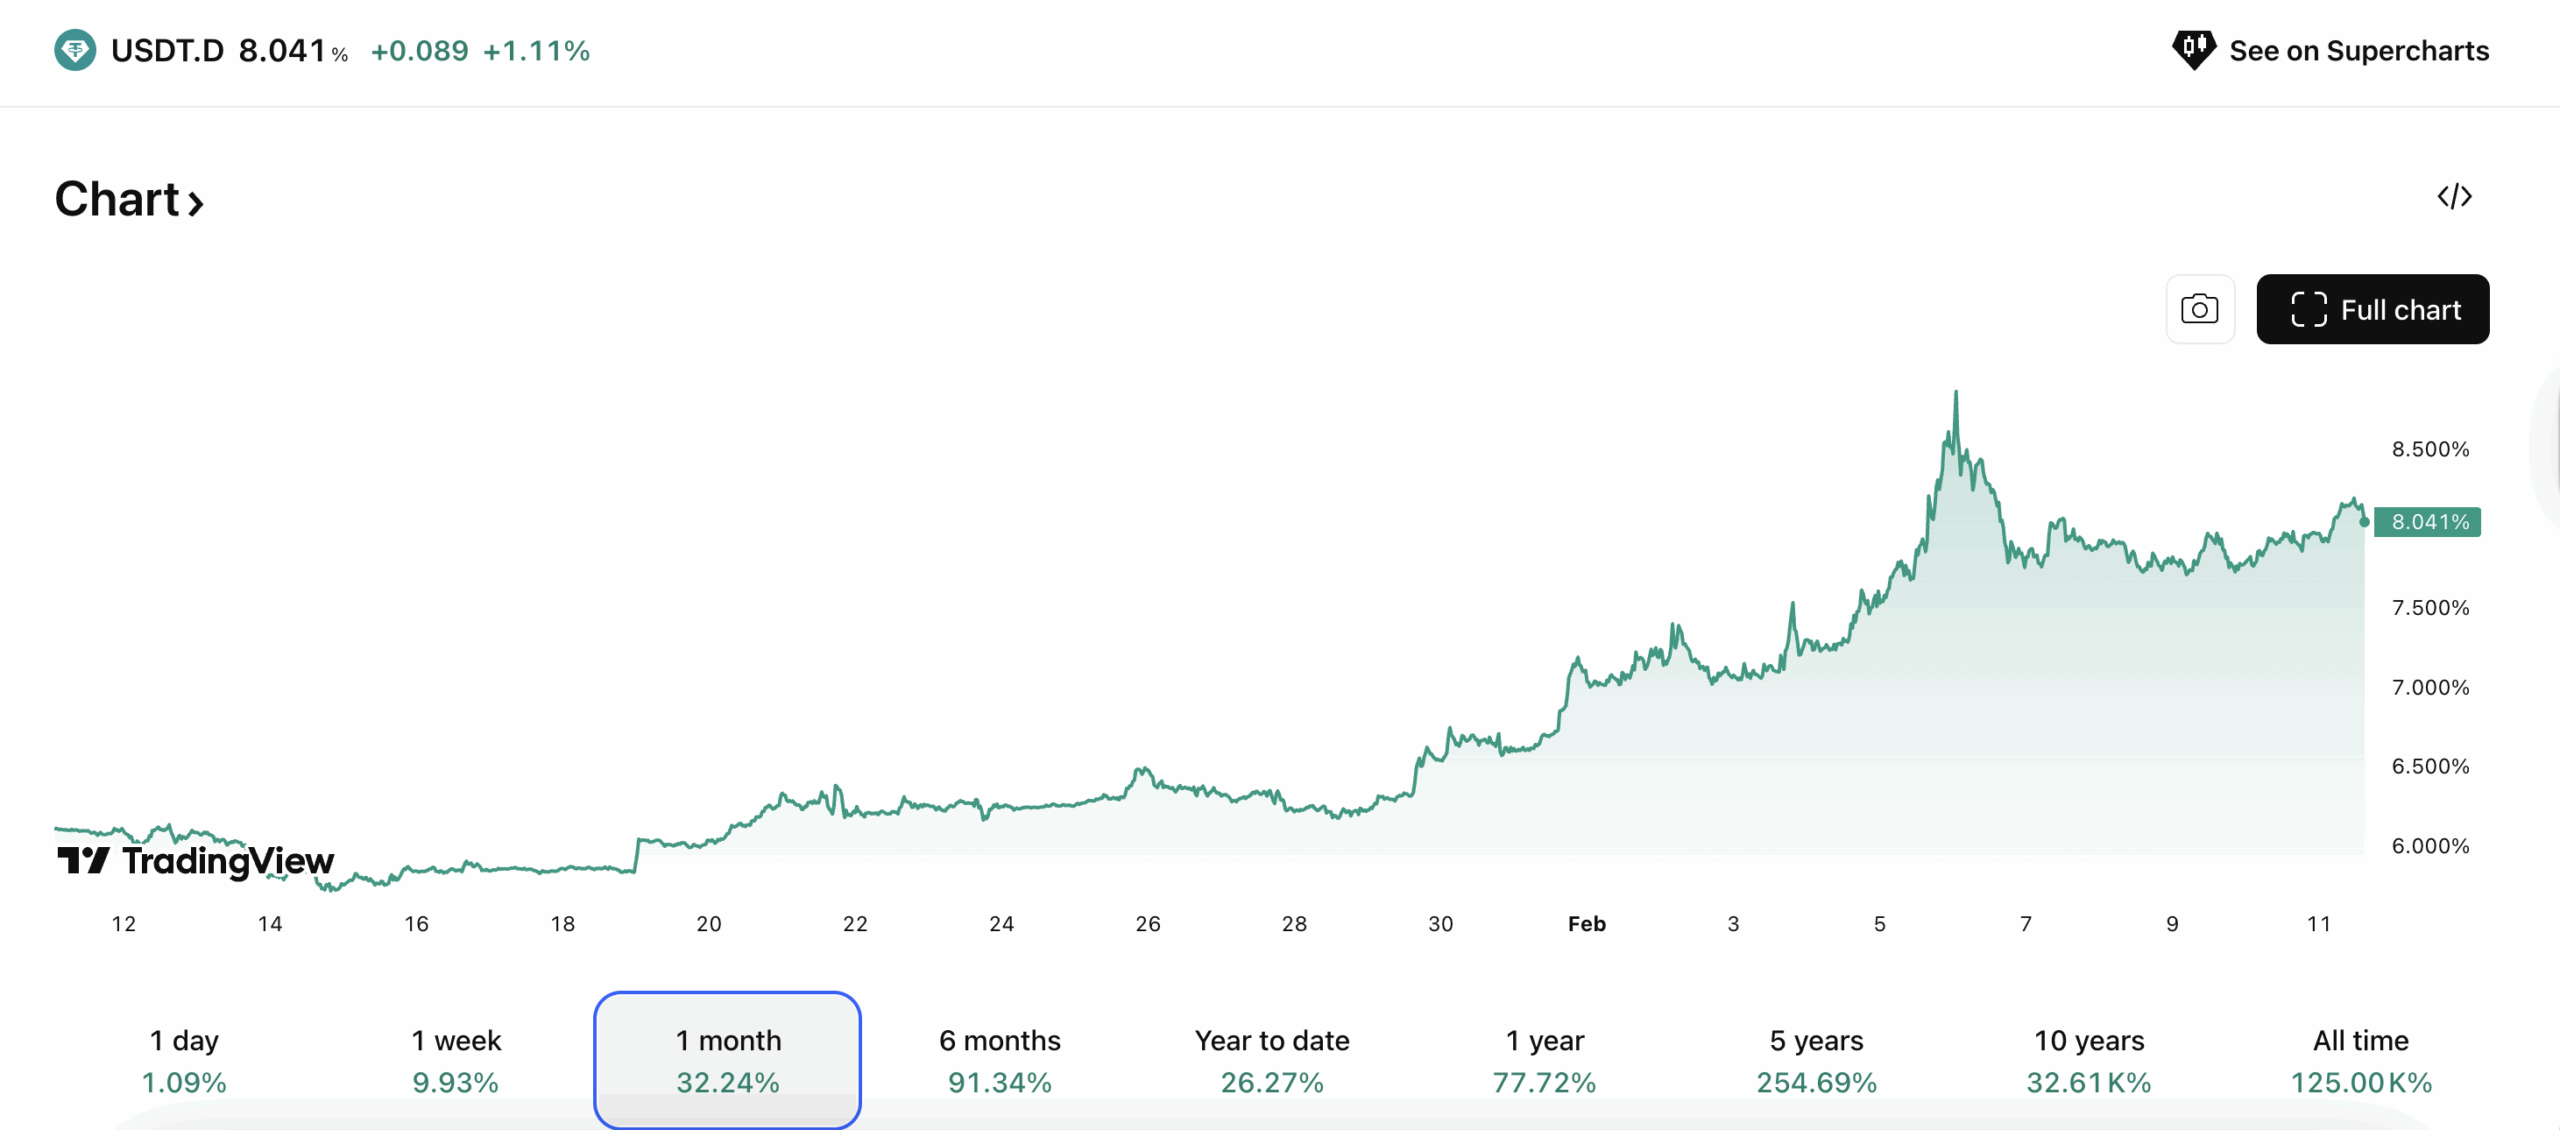
Alternatively, failure at $67,000 could retest $60,000, with bears eyeing $52,000 or $37,000-$40,000 if patterns repeat. USDT’s dominance drop below 7.7% can signal bullish breakout.
USDT dominance chart | Credit: Tradingview.com
Past experience shows cycles evolve. The 2018-2020 bottom resulted in a 1,500% rebound, whereas 2022’s was 300%. Fed policies, ETF flows, and on-chain statistics such as RSI can serve as indicators for a future BTC move.
It aligns with historical support and oversold metrics, but only if demand absorbs selling pressure.
What triggered Bitcoin's 52% drop?
Macro tightening, ETF outflows, and liquidations caused the BTC drop, worsened by links to risky assets.
Could Bitcoin fall to $37,000?
Yes, if technical breakdowns occur, mirroring past cycles’ deeper retracements.
Is there any new legislation affecting Bitcoin in 2026?
The UK’s Cryptoassets Regulations 2026, announced on February 4, 2026, require all crypto platforms to receive a legal licence by 2027.
Disclaimer:
The information provided in this article is for informational purposes only. It is not intended to be, nor should it be construed as, financial advice. We do not make any warranties regarding the completeness, reliability, or accuracy of this information. All investments involve risk, and past performance does not guarantee future results. We recommend consulting a financial advisor before making any investment decisions.
Curious about how technology and crypto reshape global finance, Elizaveta Savenko explores blockchain, AI, decentralized systems, their applications, and regulatory requirements. She contributes to research, educational initiatives, and industry collaborations, examining trends in digital assets and fintech innovation, increasing awareness of the crypto space and its impact on financial systems.


 Easy
Easy