The Dow Is Not Imploding and Could Have More Runway for Gains


The Dow could rally much higher from current levels. Japan's boom-bust cycle and current sentiment levels suggest prices could rise. | Source: AP Photo/Richard Drew
By CCN.com: Unpopular opinion – the Dow could rally higher from here and possibly much further than anyone expects. Just about every expert and their cohort are calling for the market to implode. Maybe it’s time to consider the alternative scenario?
As the longest bull market in U.S. history continues its relentless run, that old cliché seems more relevant than ever: “The market can stay irrational a lot longer than you can stay solvent.”
A Blast From the Past: Boom and Bust in Japan
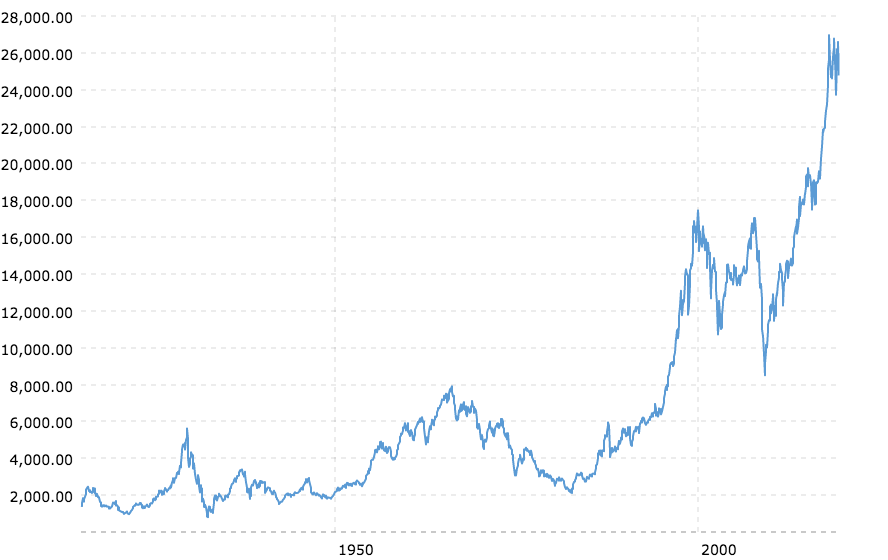
There is a poster child for all this stock market madness, and it comes in the form of the Japanese asset bubble of the late 1980s. In only three years, the Nikkei 225, Japan’s benchmark financial index, tripled to 39,000. By 1989, the Nikkei accounted for a staggering one-third of the world’s stock market capitalization.
At the time, Japanese corporates created their own form of financial engineering known as “zaitech,” which allowed them to record speculative gains as income on their balance sheets. Asset prices quickly doubled and then doubled again.
At the height of the mania, the Japanese Imperial Palace was supposedly worth more than all the real estate in California. Today, U.S. corporates are heading down that same slippery slope, primarily with record share buybacks to juice their own stocks.
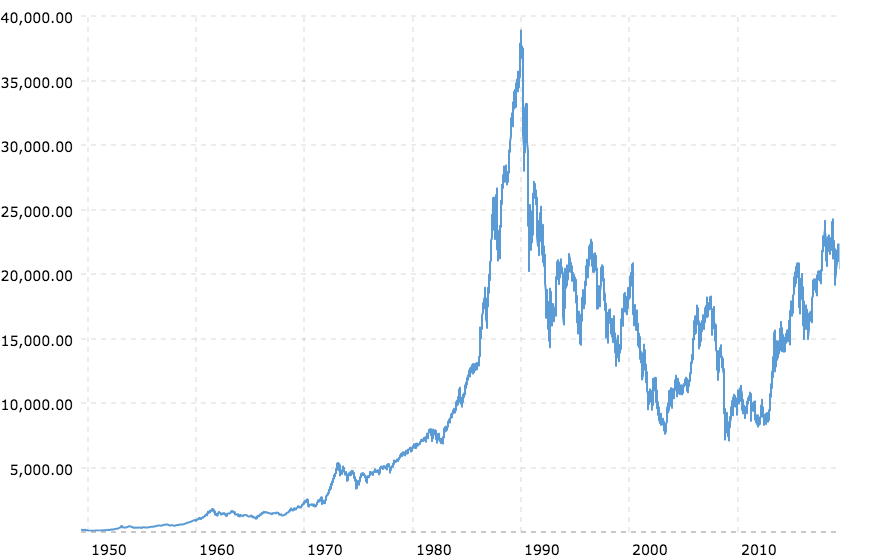
One could argue: “True story but aren’t you just further making the bear case?” Well, not quite. If the charts have anything to say about it, then we may be in for a few more years of insane price action. Compare the above chart with that of the long-term Dow Jones Industrial Average below:
Direct comparisons are difficult to make; however, there are several areas in that Nikkei chart that could easily have been labeled as a top. How confident do you feel that the top is in for the Dow or any other major U.S. index? It’s not inconceivable there are still one or two major legs to run before a parabolic top is in place.
Market Sentiment Remains Overwhelmingly Bearish
The other factor to consider is the largely negative sentiment on the web and among the so-called experts in the mainstream media. The contrarian view is often where the smart money is. Redditors have a name for this and it’s called the CNBC Reverse Indicator . Basically, just do the exact opposite of what the talking heads are saying and you’re golden.
To further highlight this, at the height of Japan’s bubble a majority of investors who were surveyed thought that the party would actually continue:
“Survey evidence indicates that at the peak of the bubble in the second half of 1989, the majority of Japanese institutional investors thought that the Nikkei was not overvalued relative to fundamentals.”
Odds are that – just like then or the dot-com crash – we’ll first need to hear talk of ‘paradigm shifts’ and grandmas speculating on the latest tips. The bulls will need to come out in full force and punt that gravy train before investors see the summit.
The Dow Could Rally Higher, So What’s the Play?
There is no play – this isn’t trading advice. Riding the bull in a stock market bubble is a dangerous strategy. Equally perilous is listening to the experts who claim they know when the top is in. Choosing a direction is akin to putting your money on red or black at the nearest casino.
Cash is an option, of course, in this low-growth environment that’ll most likely whittle away your wealth. The inflated costs of living like housing and healthcare aren’t coming down though. If I was a betting man, I’d put my money on bitcoin and let it run. But that’s just me.
Click here for a real-time Dow Jones Industrial Average price chart.
