Buffett Indicator: Stock Market Death Spiral Isn’t Over Yet


Wall Street's painful February correction could be the tip of the iceberg for what's coming - at least, if the famed Buffett indicator is anything to go by. | Image: AP Photo/Richard Drew
- The Buffett indicator gives investors an early warning. It did before the Great Recession and Dot Com Bubble crashed the stock market.
- Then it flashed red again in the months leading up to this February’s unprecedented collapse in valuations.
- As investors watch for the stock market to hit bottom, the Buffett indicator shows there’s a long way left for stocks to fall.
Last month’s brutal stock market correction wiped $3.6 trillion from equities in one week . Further, within the space of nine days the S&P 500 Index crashed 10% from an all time high in the shortest ever amount of time.
After such a mighty rout, investors are wondering if the stock market is near the bottom yet. A financial analyst at Barron’s is watching the technical indicators for a bottom .
One hedge fund manager connected some dots this week from the Volatility Index (VIX) to the possibility of a market bottom soon.
But don’t hold your breath waiting for it. For anyone wondering how much longer the selloff might last, the Buffett indicator has a calamitous answer.
Buffett Indicator: More Pain Ahead for Stocks
The Buffett indicator is named after Mr. Warren Buffett, the CEO of Berkshire Hathaway. They don’t call him “The Oracle of Omaha” for nothing.
In 1999, Buffett predicted a correction ahead for stock valuations . The Dot Com bubble burst the following year.
His famous Buffett indicator flashed red before the Dot Com bubble. Then again before the 2008 financial crisis that caused the Great Recession.
The Buffett indicator is simply the entire stock market capitalization of the United States divided by U.S. gross domestic product (GDP). Warren Buffett argues if that number is too high, it means U.S. companies aren’t producing enough to be worth their valuations on the stock market. Therefore a downward price correction is inevitable.
Before February’s stunning rebuke to traders who rallied stock prices to pretentious record highs since October, the Buffett indicator warned them. On the first day of trading in 2020, the indicator charted an ominous record high of 153%. This perilous situation for stock prices did not go unnoticed on CCN.com Market News.
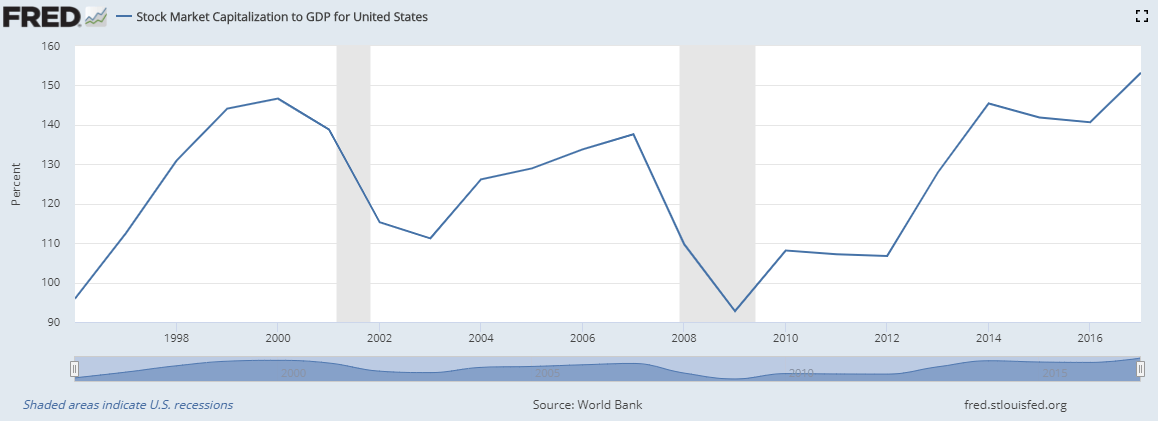
Just before the Dot Com bubble burst, U.S. market cap was 146% of GDP . Then before the 2008 Financial Crisis, it was 137% of GDP. After the correction started in February, the indicator has declined some, but as of Mar. 4, it was still a sky high 146% .
So valuations relative to production are now back down to what they were just before the last two big stock market crashes. According to Warren Buffett’s theory, that means the market correction to stock prices has hardly even begun.
When Will The Stock Market Reach Bottom?
On CNBC’s “Mad Money” Thursday, Jim Cramer said :
Buffett always says that you should be fearful when others are greedy and be greedy when others are fearful. I’m going with Warren Buffett.
It should be noted that Cramer is only keeping the second part of Mr. Buffett’s admonition. During the rally up to this market crash, Cramer was advising his audience to be greedy when others were greedy.
In both of the two most recent major market crashes, the valuations hit bottom and began to recover at the same time as the Buffett indicator bottomed out. For the Dot Com bubble and Early 2000s recession, that was with U.S. market cap at 111% of GDP. For the 2008 Financial Crisis and Great Recession, it was at 92.76% of GDP.
It’s anybody’s guess exactly when and where the market will hit bottom. Throughout his career, Warren Buffett has been loathe to make such exact predictions himself. But using the past two market corrections as references, there is a staggering amount of room left for the stock market to fall.
At the market peak on Oct. 9, 2007, the S&P 500 Index reached an all-time high of 1,565 . On Mar 6, 2009 the benchmark hit bottom at 666 and began to recover, “delivering a 10-year annualized total return of 17.8 percent” by Mar. 2019. That was a more than 50% decline in valuations to bring stock prices in line with GDP.
It’s no wonder then, why Berkshire Hathaway has been sitting on $128 billion in excess cash, rather than risking it in the stock market. The Buffett indicator has been hovering high in the danger zone. And it still is today by historical measures.
