Yesterday we analyzed the bitcoin market from a weekly perspective and saw that we are, in all likelihood, very close to the beginning of a bull market. However, the weekly chart is unclear about whether or not there may be another week of selling. My analysis and the charts you see herein are based upon bitcoin price as reflected on Bitstamp.
Daily Chart – Bearish Setup
Today we will look at the daily chart of the bitcoin market to get a closer look at what the charts are telling us. Here I have elected to use an eight candle bearish setup from the June 2014 high.

Note first of all that every arc pair without exception has acted as temporary support. Up until yesterday I believed the most likely meaning of this setup was that the market was going to turn down and hit the 5th arc pair. This scenario is undoubtedly a distinct possibility. If it does this, then it is probable that a significant rally will then commence as the 5th arc typically provides exceptional support.
I thought this scenario most probable because as you can see, the market has penetrated the 4th arc pair to the downside. It has been following the arc upwards, but when it hits the top of the current square, if not sooner, it seemed most likely to reverse course, and head down to the 5th arc.
However, there is another possibility, more distinctly bullish.
It is possible that the bear market ended with the spike bottom at 275. That spike touched the top of the square, and (almost) touched the 4th arc. Touching the top of the square fulfilled the Gann Square requirements for a change in trend. There are Elliot Wave implications to a close just above the April 2013 high as well. We will discuss Elliot Wave in a future article. For now, touching the top of the square as price did, at 275, may have been the bear market low.
Daily Chart – Bullish Setup
Knowing that 275 may have been the low, we need to take a look at a bullish setup from the October low. It could be that the bull market has already begun, and we do not want to be looking the wrong way!
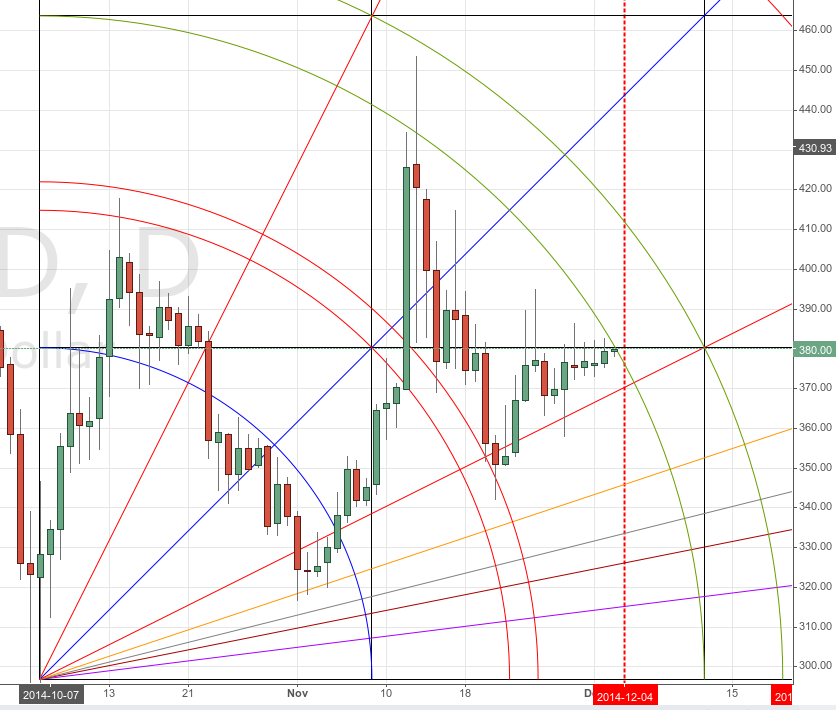
This chart features a five candle setup. Note that as of this writing, price has already penetrated the 1st arc pair and is now touching the 2nd pair. It has been supported by the lower Gann fans along the way. But the top of the square has been overhead resistance. This chart is not overly bullish. However, all it will take is a green candle penetrating the 2nd arc to make this a distinctly bullish chart.
The 2nd arc is significant resistance, as is the top of the square. If today’s candle closes above the square, that will be a buy signal. Another buy signal will be generated if and when we get a close above the 2nd arc.
The weekly chart now has a candle above the 3rd arc. That is a buy signal from the weekly chart. Coupled with what appears to be an imminent buy signal from the daily chart, my feeling is that a significant trading opportunity on the long side is rapidly approaching. A breakdown here (if the price can not penetrate the 2nd arc nor the top of the square) will cause my opinion to change swiftly. In any case, we will get an answer to this question very soon, so stay on your toes!
The red dotted vertical line you see on 12/4/2014 (tomorrow) is a Fibonacci time zone. This time zone has indicated for quite some time that something exciting might happen/begin on that day. Based on the charts you see on this page, coupled with the weekly chart we looked at yesterday, I would not be at all surprised if fireworks start very soon.
Happy Trading All!
Disclaimer: The author actively trades the bitcoin market and has an interest in the path it takes.


