The Zcash (ZEC) price is down 40% from its all-time high price.
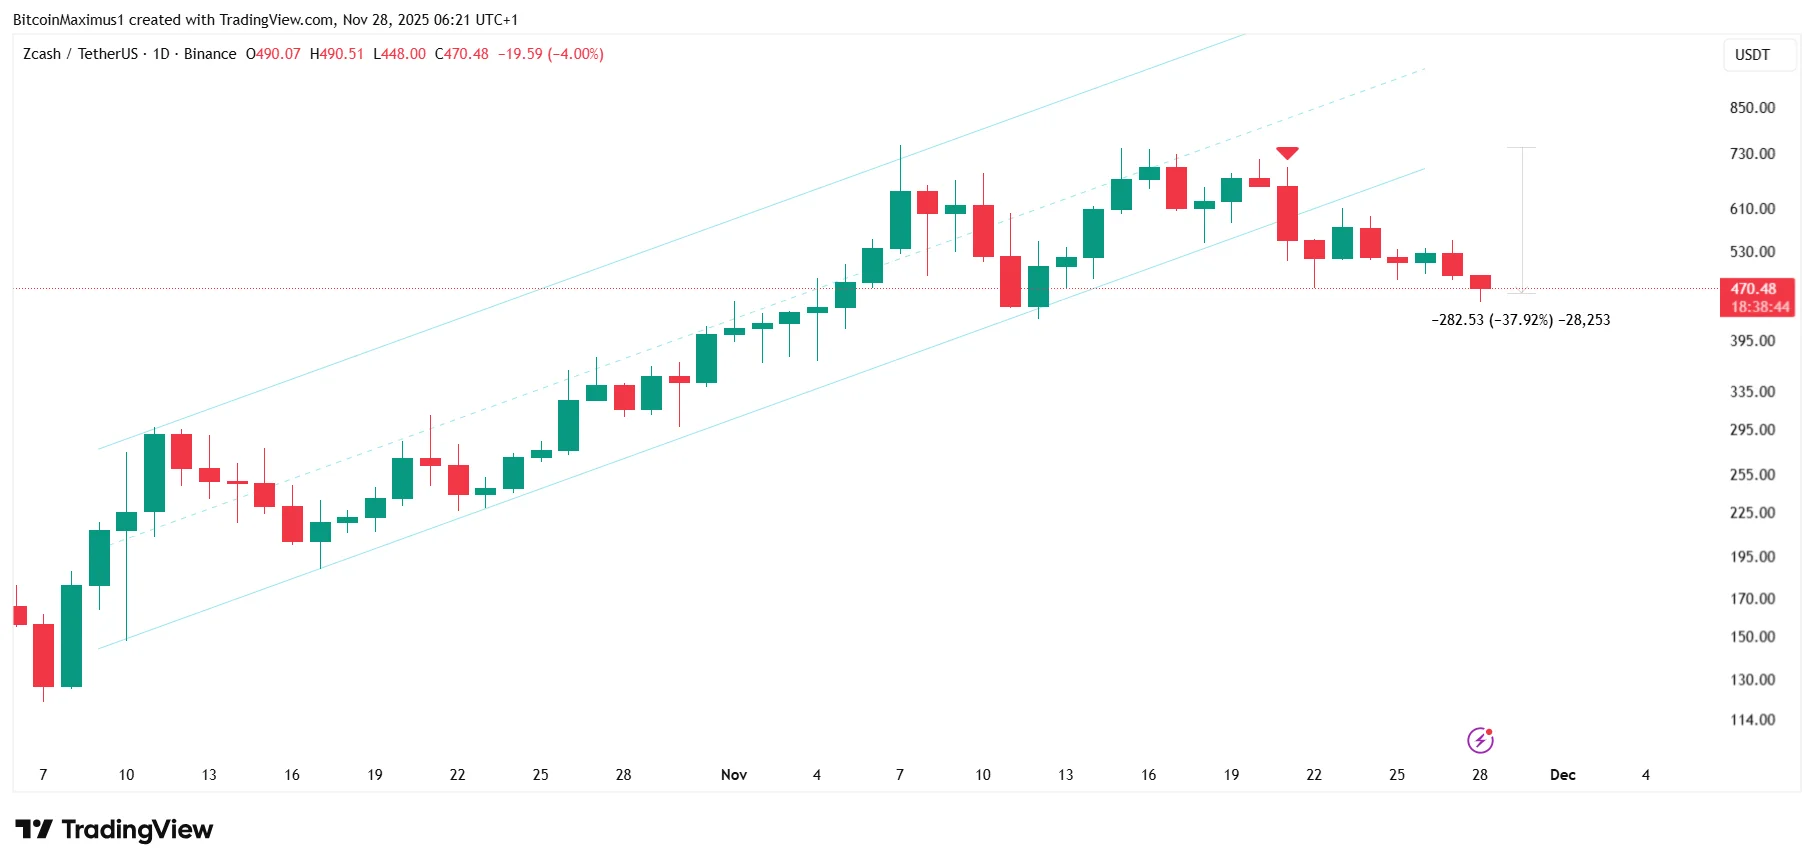
Zcash broke down from an ascending parallel channel pattern.
Has the massive Zcash price surge finally come to an end?
The question “why is Zcash going down?” is spreading fast as the ZEC price collapses 40% from its November all-time high.
What looked like one of the year’s strongest rallies has now flipped into a full trend reversal, with Zcash breaking down from a long-term ascending channel.
Even with positive ETF news from Grayscale, the charts now warn that the decline may not be over and another 40% correction could be ahead.
Zcash created a lower high on Nov. 15 (red icon) before accelerating the move to the downside.
Get These Top Crypto Casino Offers Now!
Sponsored
Disclosure
We sometimes use affiliate links in our content, when clicking on those we might receive a commission at no extra cost to you. By using this website you agree to our terms and conditions and privacy policy.
Even though the Zcash price has plummeted from its highs, the privacy coin narrative is not dead yet.
On the contrary, Grayscale has filed to convert its trust into an Exchange-Traded Fund (ETF).
🚨 #Grayscale Files #Zcash ETF — ChatGPT Says $ZEC Could Hit $1,000 Within 18 Months
Grayscale’s filing marks a major step for privacy coins entering Wall Street.
Zcash rallies 1,000% in 2025 with VanEck backing, relistings & rising demand.
ChatGPT predicts $ZEC’s next move: a… pic.twitter.com/YdUWviZUBi
If successful, it could attract a substantial influx of institutional investment interest in privacy coins.
Nevertheless, the community’s sentiment has soured in tandem with the price decline.
Notorious leverage trader James Wynn has opened massive shorts on Zcash, calling its entire price increase a pump-and-dump scheme.
The main positive news regarding Zcash is that it is considered quantum-resistant, making it the only privacy coin in this category.
Nevertheless, the ZEC price action shows no bullish signs whatsoever despite the ETF and quantum-resistant narratives.
Where ZEC Heads Next
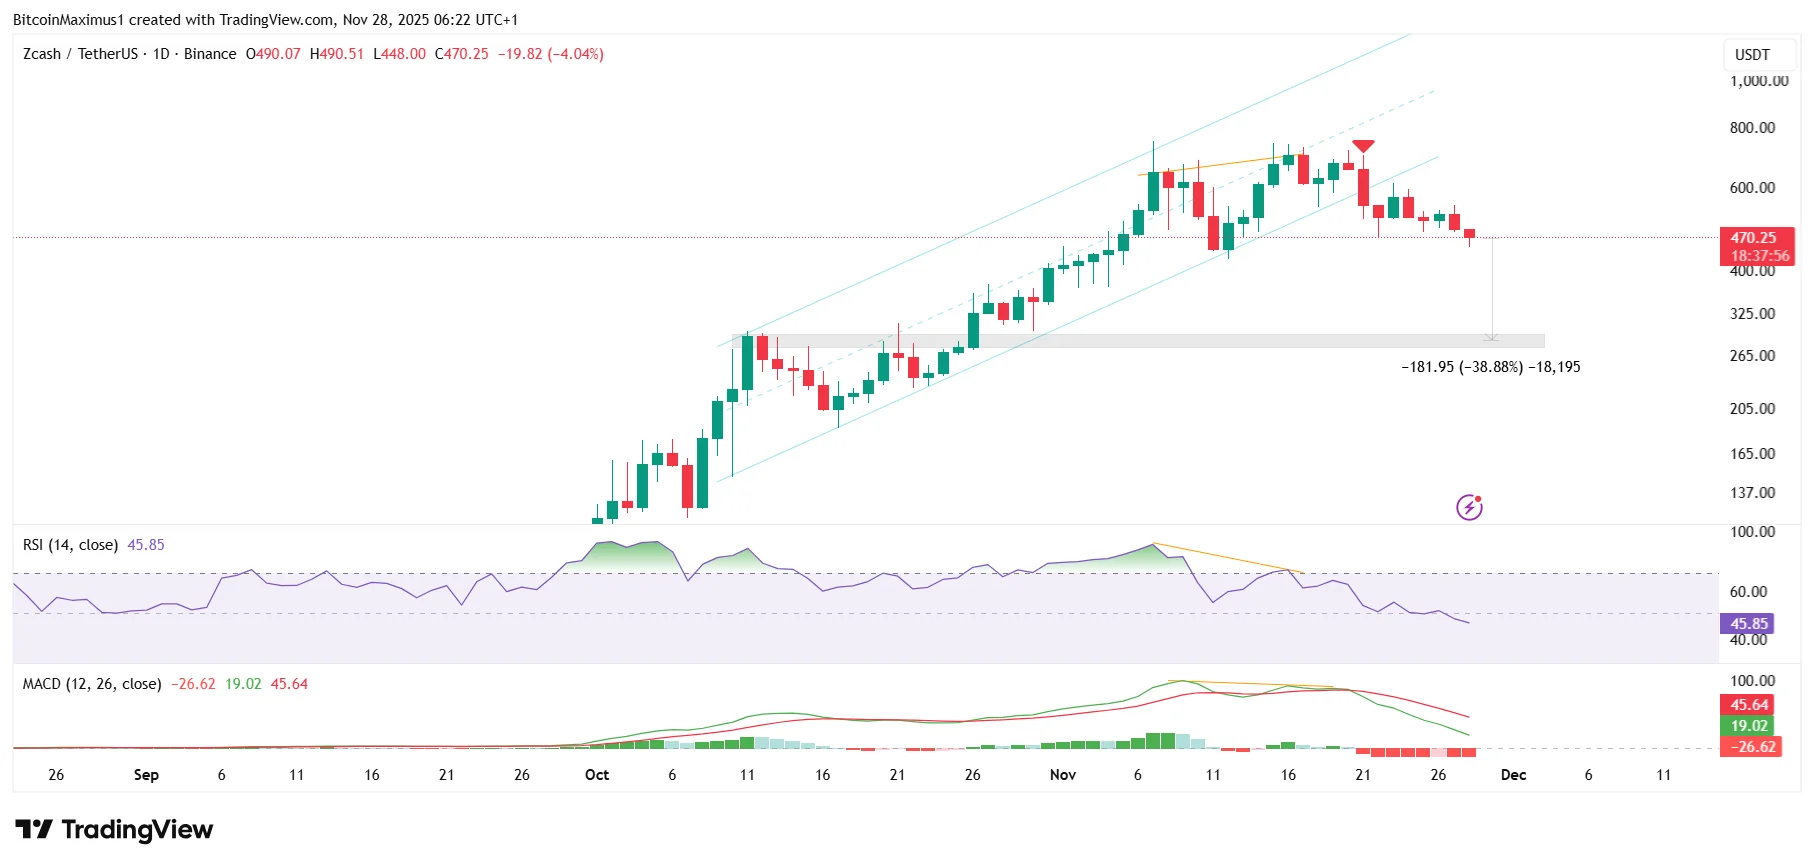
The ZEC charts paint a worrying picture.
With bearish divergences, a confirmed channel breakdown, and a failure to recover key levels, momentum is firmly to the downside.
Unless ZEC can reclaim its lost structure, the most likely scenario remains a continuation toward the $285 support zone.
Even with ETF hopes and quantum-resistant hype, the market is clearly signaling weakness.
For now, this is the clearest explanation for why Zcash is experiencing a decline and why traders should remain cautious until the charts turn bullish again.
Disclaimer:
The information provided in this article is for informational purposes only. It is not intended to be, nor should it be construed as, financial advice. We do not make any warranties regarding the completeness, reliability, or accuracy of this information. All investments involve risk, and past performance does not guarantee future results. We recommend consulting a financial advisor before making any investment decisions.
Valdrin Tahiri is a cryptocurrency analyst and reporter at CCN, specializing in technical analysis with a focus on Elliott Wave theory, on-chain metrics, and fundamental research. He brings over seven years of experience in the crypto space as both a trader and writer.
He discovered cryptocurrencies in 2017 while earning his MSc in Financial Markets at the Barcelona School of Economics, which sparked a deep interest in blockchain and market dynamics. Since then, he’s contributed to top crypto outlets like BeInCrypto and CoinGape.
Valdrin also served as Community Manager of BeInCrypto’s Telegram group for three years, helping grow it into one of the largest crypto communities worldwide. His expertise in market structure and price patterns allows him to break down complex trends into clear, actionable insights.
He’s published thousands of articles covering altcoins, Bitcoin cycles, and macro trends.