Meet the Top 101 in Crypto

SUI Breaks 55-Day Resistance — Are Bulls Targeting a 30% Price Rally?

Published 12 December 2025
Valdrin Tahiri
Authors
Edited by Ryan James

Key Takeaways

  • SUI broke out from a diagonal resistance trend line.
  • The long-term SUI trend remains weak.
  • Can SUI maintain its breakout and reach new highs?

SUI is back in focus after finally breaking above a stubborn 55-day resistance trend line.

The move follows weeks of weakness and a confirmed double bottom, giving bulls a technical reason to expect follow-through.

However, while short-term momentum is improving, the longer-term picture remains more cautious.

The big question now is whether this breakout can stick.

SUI Price Analysis

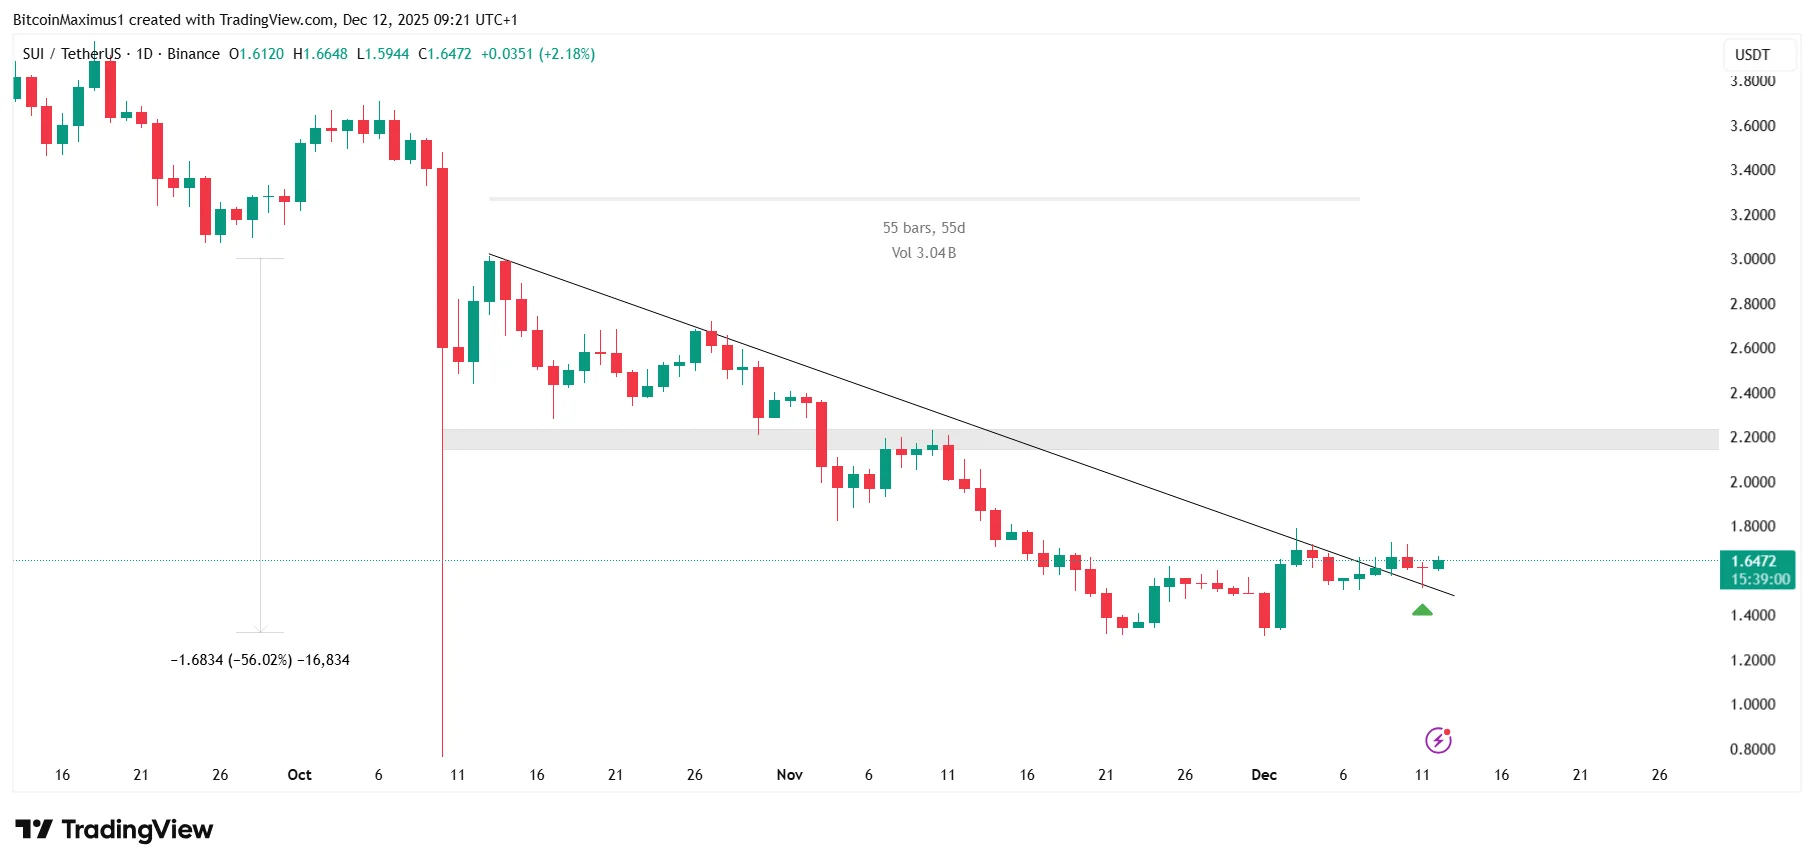
The daily time frame chart shows that SUI has fallen under a diagonal resistance trendline since October 13.

After a 56% price decrease, the SUI price bottomed and started an upward movement.

In November and December, SUI created a double bottom, considered a bullish pattern.

SUI Daily
SUI/USDT Daily Chart | Credit: Valdrin Tahiri/TradingView

SUI has increased since, breaking out from the diagonal resistance trendline on December 9.

At the time, the trend line existed for 55 days, and SUI is validating it as support today (green icon).

If successful, it will validate the breakout and trigger another upward movement.

Is an Upward Movement Likely?

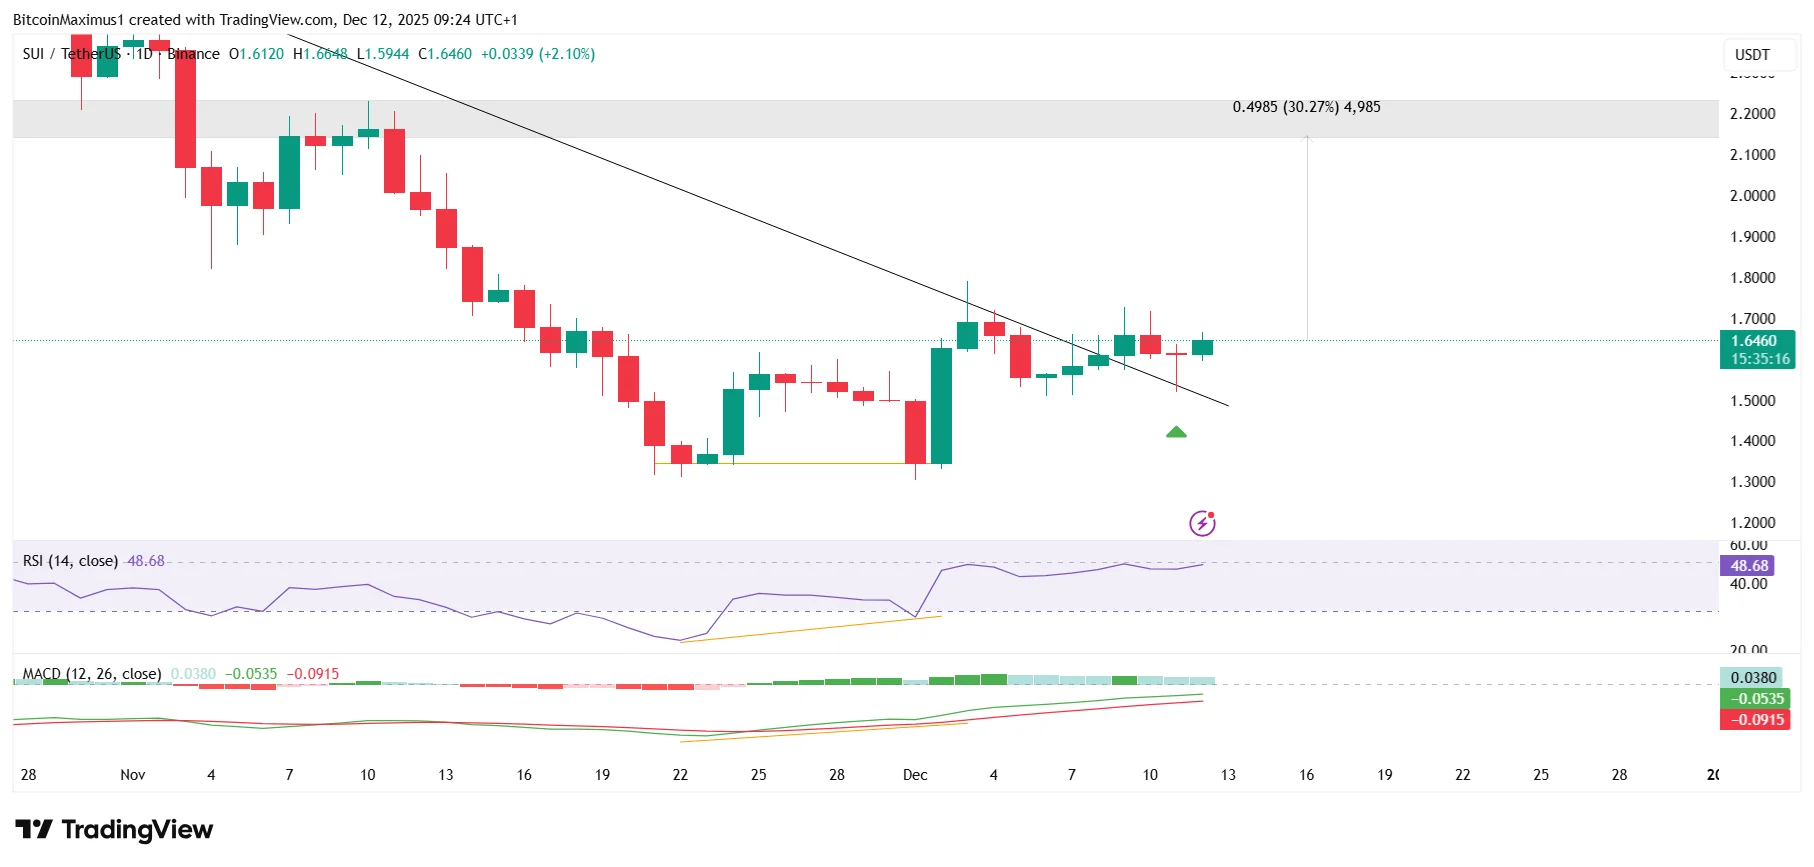
Momentum indicators support the breakout.

The Relative Strength Index (RSI) has generated a bullish divergence.

The Moving Average Convergence/Divergence (MACD) has done the same.

Both are trending upward and in positive territory.

SUI Daily
SUI/USDT Daily Chart | Credit: Valdrin Tahiri/TradingView

The indicator readings validate the breakout and retest, suggesting that the SUI price will head higher.

Bulls are targeting another 30% price increase, which would take SUI to the $2.20 horizontal resistance area.

Long-Term SUI Prediction

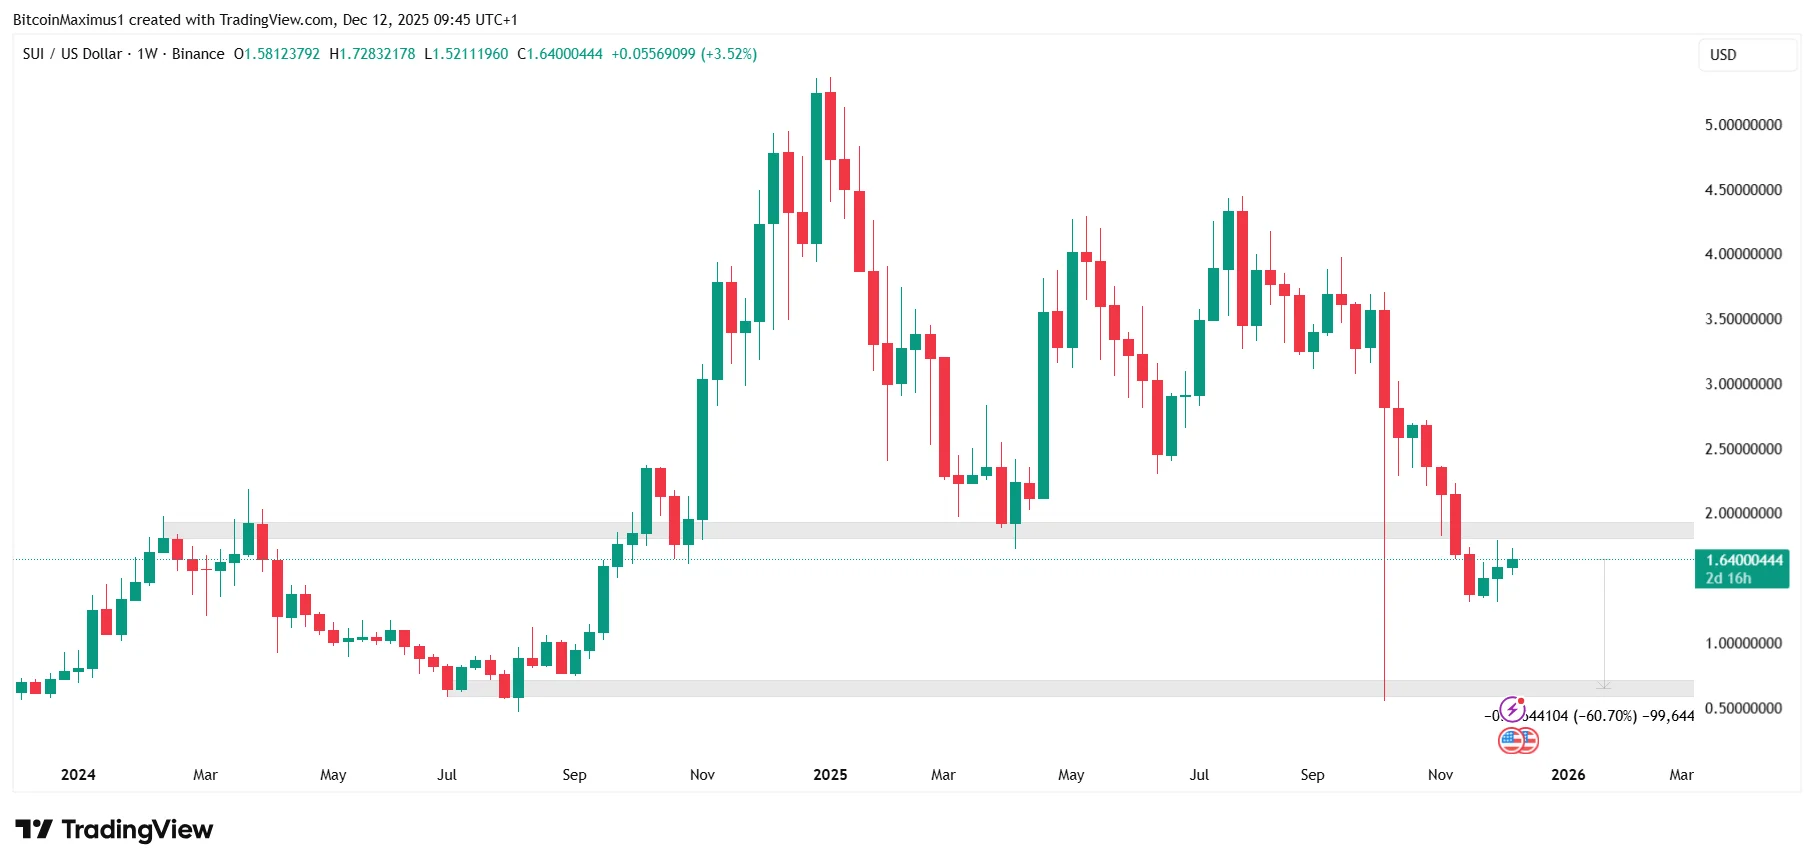
While the daily chart offers hope for the bulls, the weekly one is decisively bearish.

The weekly price action gives a precise bearish SUI prediction.

The primary resistance area is at $1.85, a horizontal level that has occasionally served as both resistance and support.

SUI broke down below this critical resistance level in November and has not since recovered to reclaim it.

SUI Price Prediction
SUI/USDT Weekly Chart | Credit: Valdrin Tahiri/TradingView

Examining the weekly time frame, the ongoing bounce is merely a retest of that area as resistance.

After it’s done, the SUI price is likely to resume its downward trend.

As a result, despite the bullishness in the daily time frame, the long-term SUI price prediction is still bearish.

Unless SUI reclaims this level, it could plummet to the next closest support at $0.65.

Trend Remains Bearish

SUI’s breakout above its 55-day resistance has shifted short-term momentum back in favor of the bulls, with technical indicators pointing toward a potential 30 percent rally.

However, the bigger picture remains fragile.

Unless SUI can reclaim key weekly resistance, the move higher may prove to be a temporary relief rally rather than an actual trend reversal.

Disclaimer: The information provided in this article is for informational purposes only. It is not intended to be, nor should it be construed as, financial advice. We do not make any warranties regarding the completeness, reliability, or accuracy of this information. All investments involve risk, and past performance does not guarantee future results. We recommend consulting a financial advisor before making any investment decisions.
Valdrin Tahiri

Valdrin Tahiri is a cryptocurrency analyst and reporter at CCN, specializing in technical analysis with a focus on Elliott Wave theory, on-chain metrics, and fundamental research. He brings over seven years of experience in the crypto space as both a trader and writer.

He discovered cryptocurrencies in 2017 while earning his MSc in Financial Markets at the Barcelona School of Economics, which sparked a deep interest in blockchain and market dynamics. Since then, he’s contributed to top crypto outlets like BeInCrypto and CoinGape.

Valdrin also served as Community Manager of BeInCrypto’s Telegram group for three years, helping grow it into one of the largest crypto communities worldwide. His expertise in market structure and price patterns allows him to break down complex trends into clear, actionable insights.

He’s published thousands of articles covering altcoins, Bitcoin cycles, and macro trends.

Related

Survey Icon
Help us improve
1 of 4
Is this your first time here?
What brought you here today?
What are you most interested in?
Would you be interested in:
Thank you icon
Thank you for your feedback!
DMCA.com Protection Status