XRP Ledger Powers $800M Energy Tokenization in Argentina — What It Means for XRP’s Bridge Asset Case
Share
Key Takeaways
XRP’s price wobbles below both the 20- and 50-period EMAs, indicating a fading bullish strength.
Heavy liquidity concentration near $2.70, but weak buying pressure makes reclaiming this zone difficult.
A breakdown could send XRP toward $1.77; however, a bounce above $2.70 may drive it to $2.94.
XRP is walking a tightrope. Following a 25% correction over the past month, the price now hangs by a thread above its key moving averages.
This same level defined every significant bounce this cycle.
But with indicators turning south, here is why a breakdown could expose XRP’s price to lower liquidity zones.
XRP Flirts With Breakdown
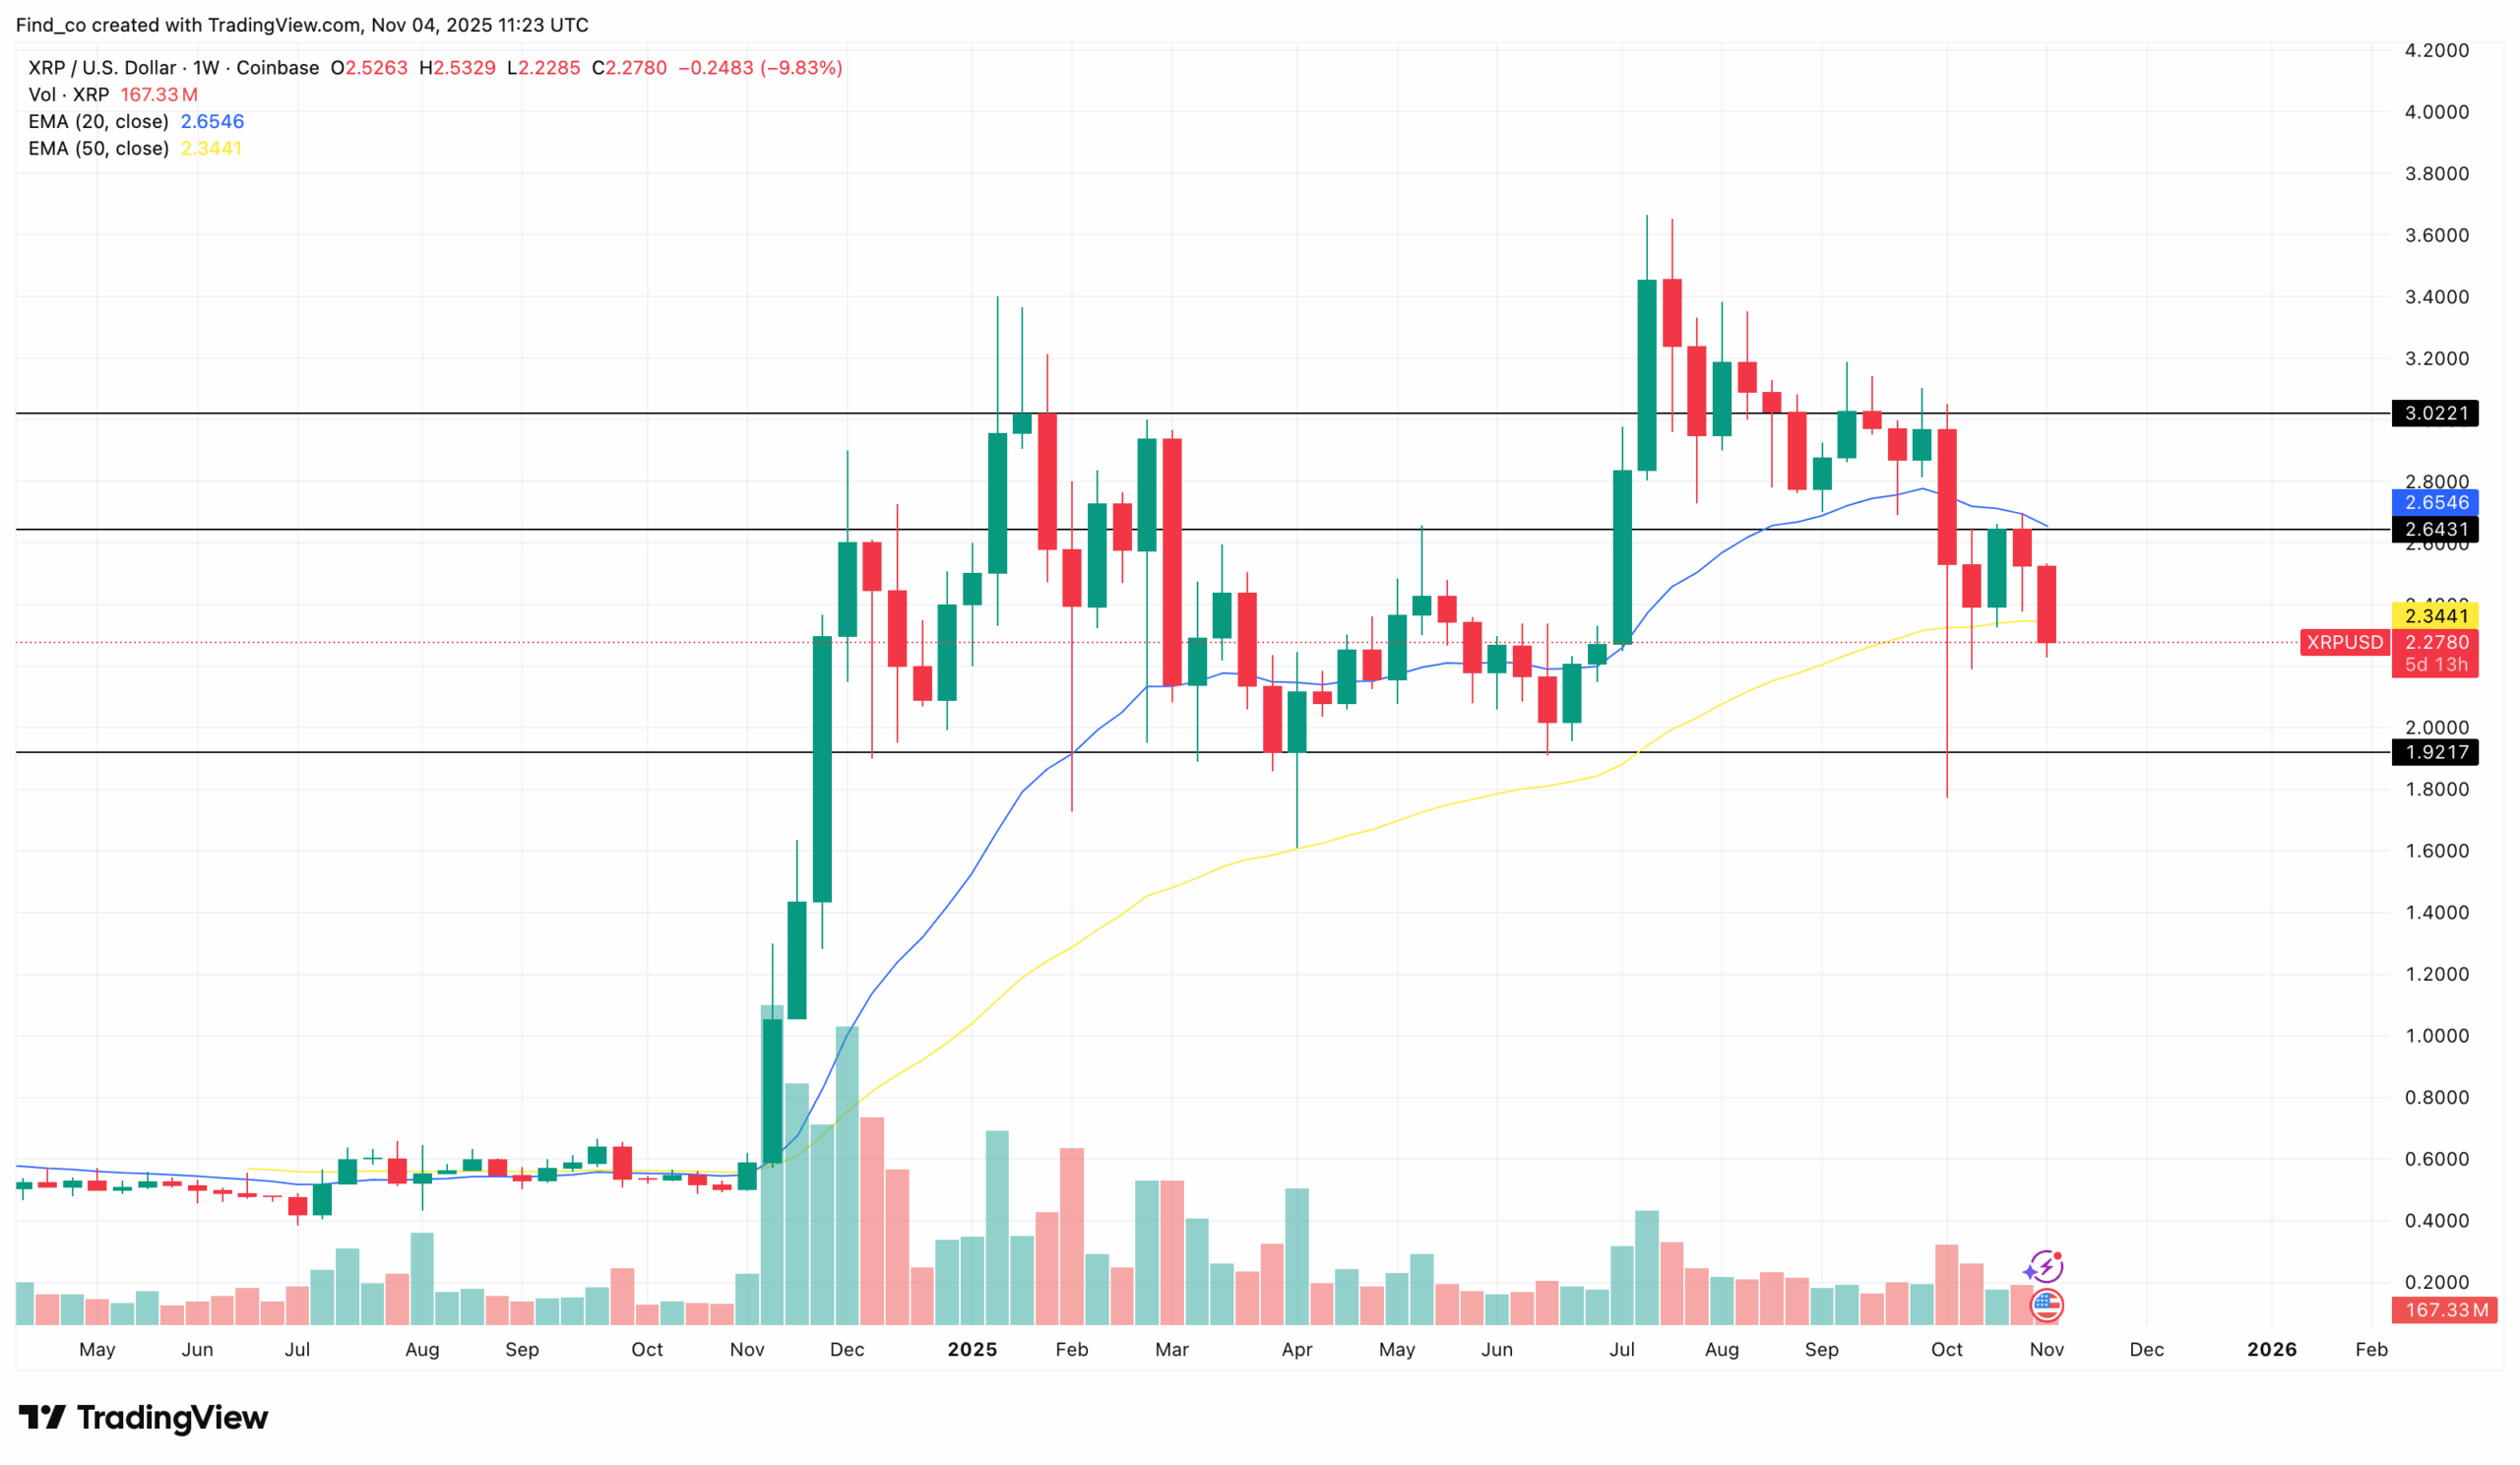
Unlike the steady uptrend seen up until July, XRP’s price is now confined within a descending channel on the weekly chart.
During this decline, the token has dropped below key Exponential Moving Averages (EMAs). This drop is a sign that short- and mid-term momentum has shifted bearish.
Although the 20 EMA (blue) remains above the 50 EMA (yellow), the fact that XRP’s price has fallen beneath both indicates weakening buyer conviction.
Besides that, it indicates a loss of crucial support from short-term moving averages.
This setup suggests that sellers are dominating, and unless XRP’s price reclaims these EMAs, further downside movement could follow.
In technical terms, trading below both the 20- and 50-day EMAs turns these levels into resistance areas, making recovery more challenging.
Therefore, as it stands, XRP risks declining to the $1.92 support if it fails to close above these averages.
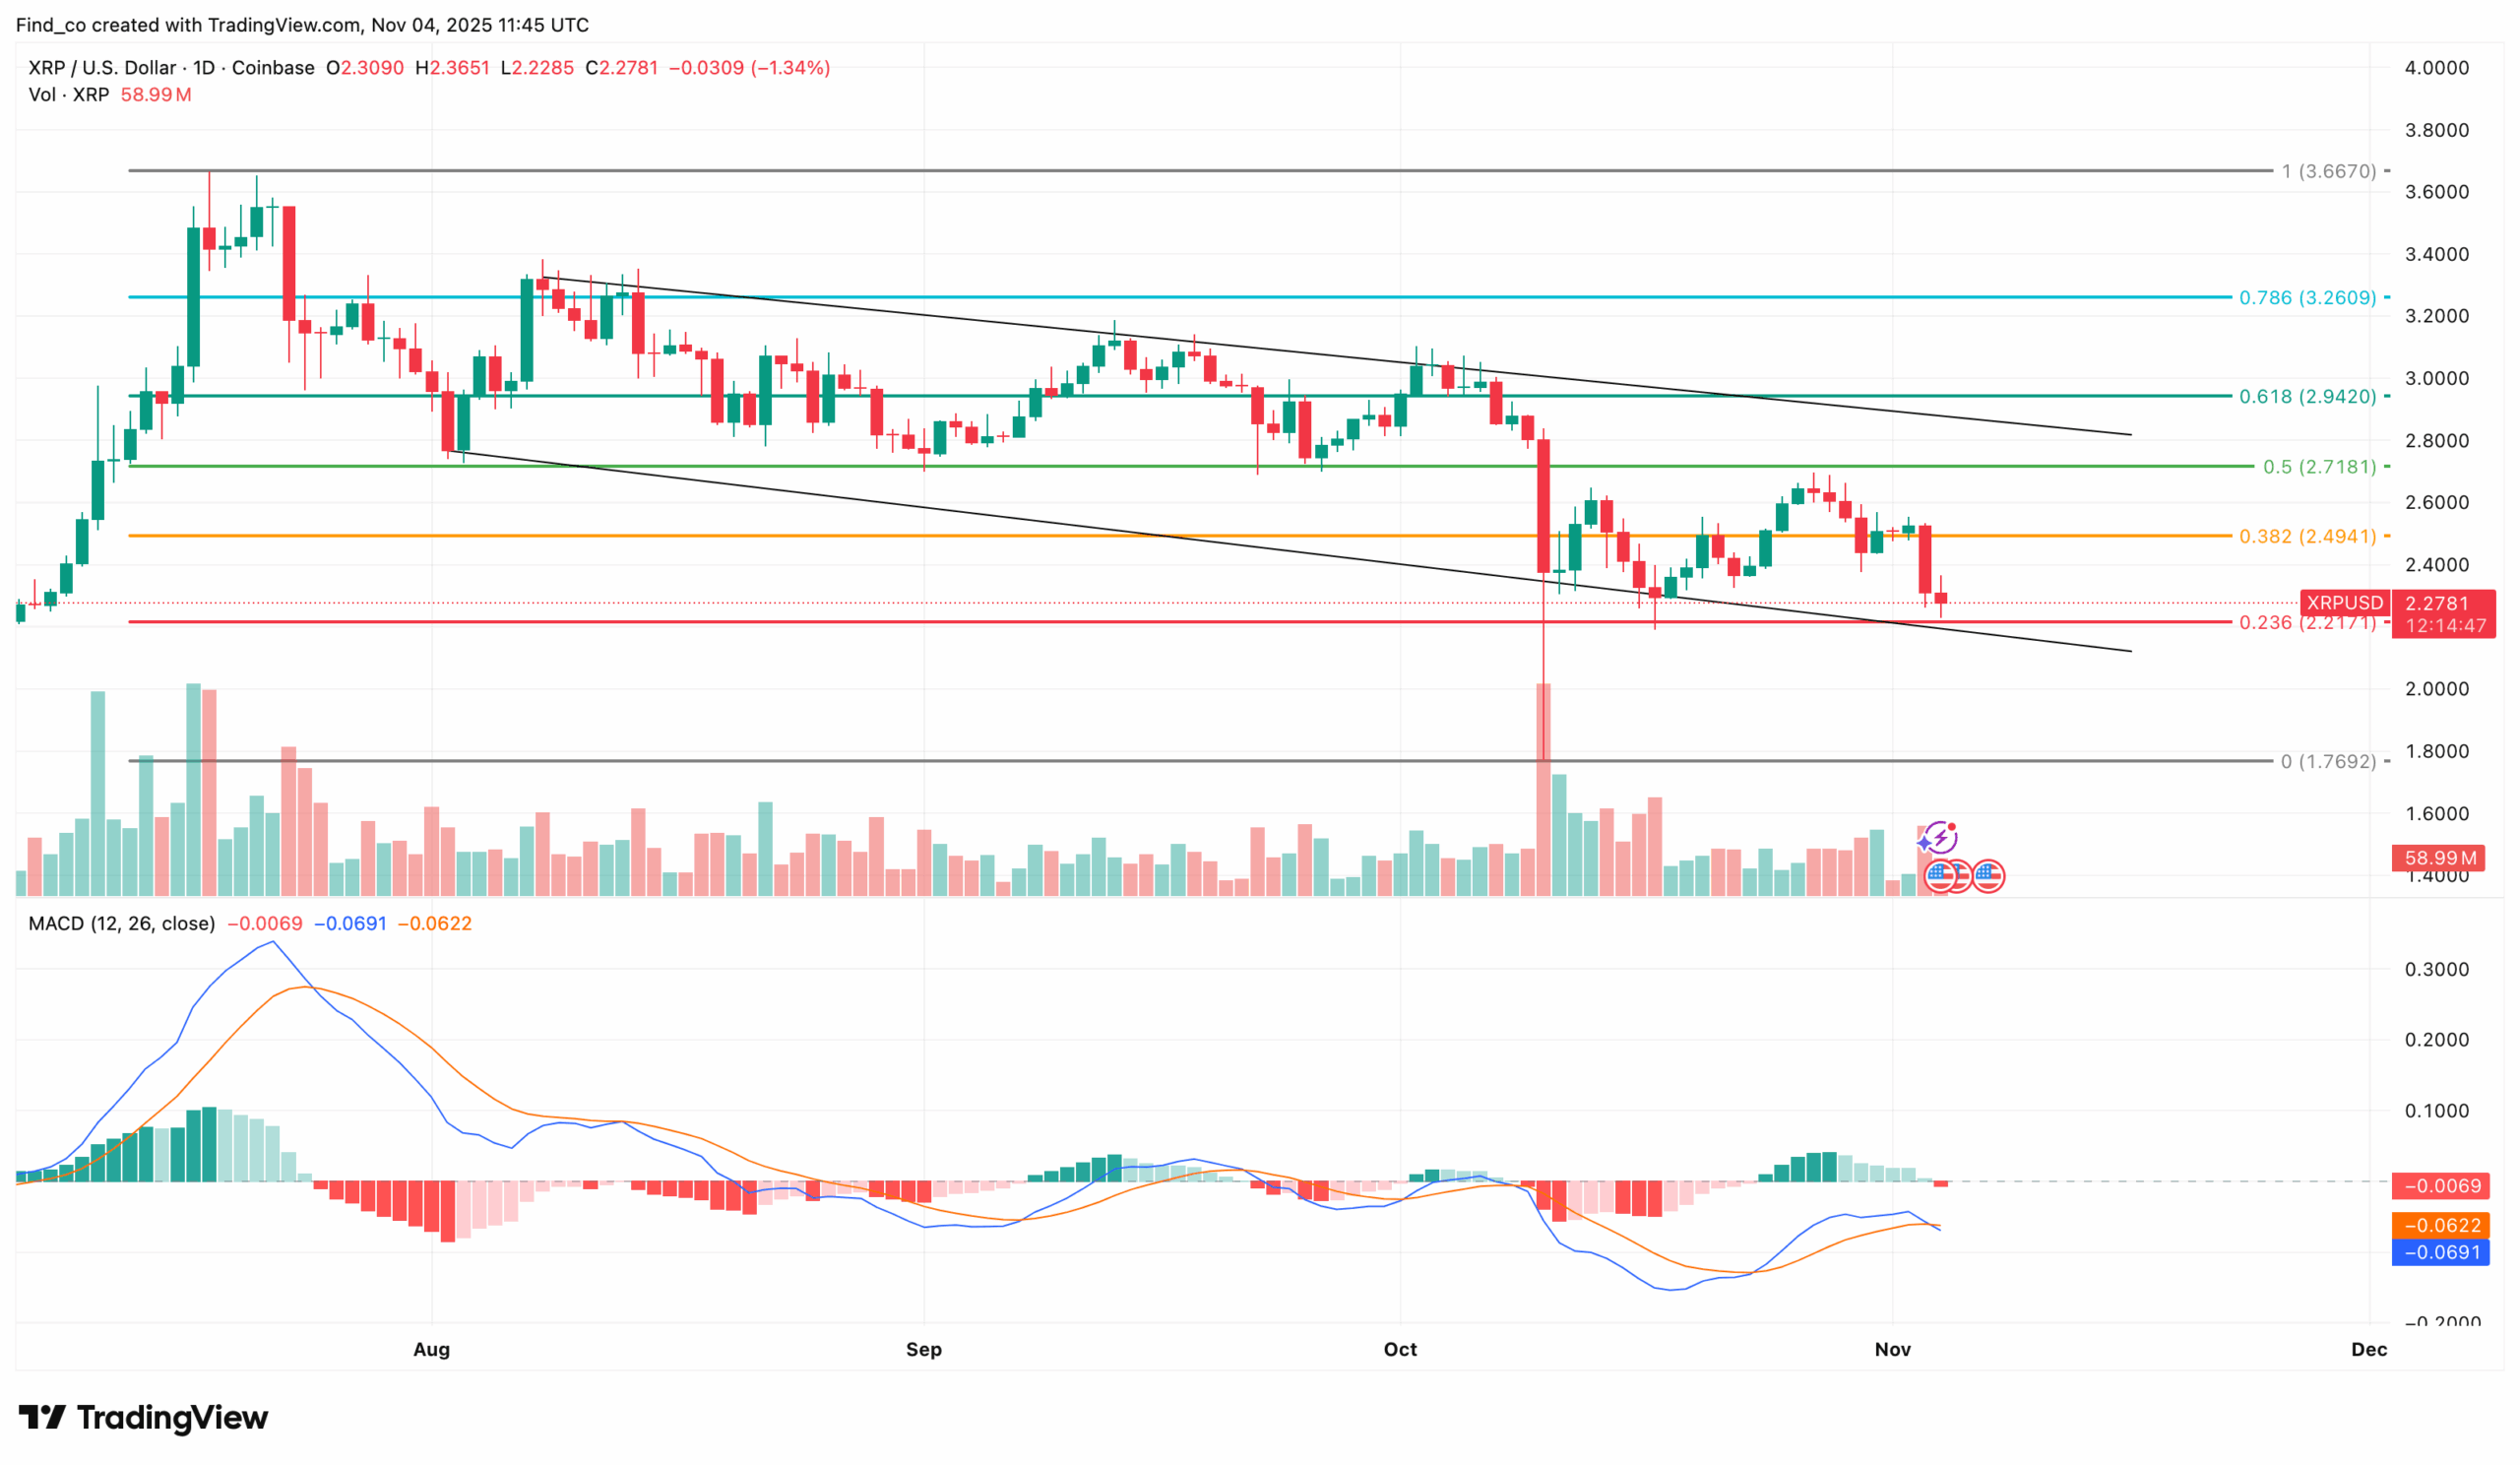
On the daily chart, XRP’s price remains trapped within a descending channel. By the look of things, it appears ready to dip below the lower trendline of this formation.
The Moving Average Convergence Divergence (MACD) has also confirmed a bearish crossover, with the 12 EMA (blue) crossing below the 26 EMA (orange), a sign of shifting momentum toward sellers.
If this trend persists, XRP could decline below $2.22. Should selling pressure intensify, the move may deepen into a liquidity trap, triggering a correction toward $1.77 as traders exit positions.
However, if buying pressure increases, this bearish outlook could be invalidated. In that scenario, XRP’s price may rebound toward the $2.70 liquidity concentration, which currently serves as a key resistance zone.
In a highly bullish scenario, sustained momentum could propel XRP to as high as $2.94, indicating a full recovery from its ongoing consolidation phase.
Disclaimer:
The information provided in this article is for informational purposes only. It is not intended to be, nor should it be construed as, financial advice. We do not make any warranties regarding the completeness, reliability, or accuracy of this information. All investments involve risk, and past performance does not guarantee future results. We recommend consulting a financial advisor before making any investment decisions.
Victor Olanrewaju is a crypto analyst and reporter at CCN with deep roots in on-chain research and technical analysis. His crypto journey began in 2017, but it was the 2020 Uniswap airdrop that sparked a full-time pivot into the space.
With a foundation in copywriting, Victor honed his craft creating high-converting content for leading crypto brokers — most notably an XRP price prediction that ranked #1 on Google during the 2021 bull run.
He later joined AMBCrypto in 2022, where he combined storytelling with technical and on-chain analysis to cover key market narratives.
In 2024, he expanded his expertise at BeInCrypto, collaborating with analysts and using tools like Glassnode, Santiment, and IntoTheBlock to break down Bitcoin and altcoin trends.
At CCN, Victor covers the top cryptocurrencies, memecoins, macro shifts, blending real-time insights with deep-dive metrics.
He holds a Bachelor’s degree in Physics from the University of Ibadan, equipping him to simplify complex data for a wide audience. Follow his work or connect on LinkedIn or X.