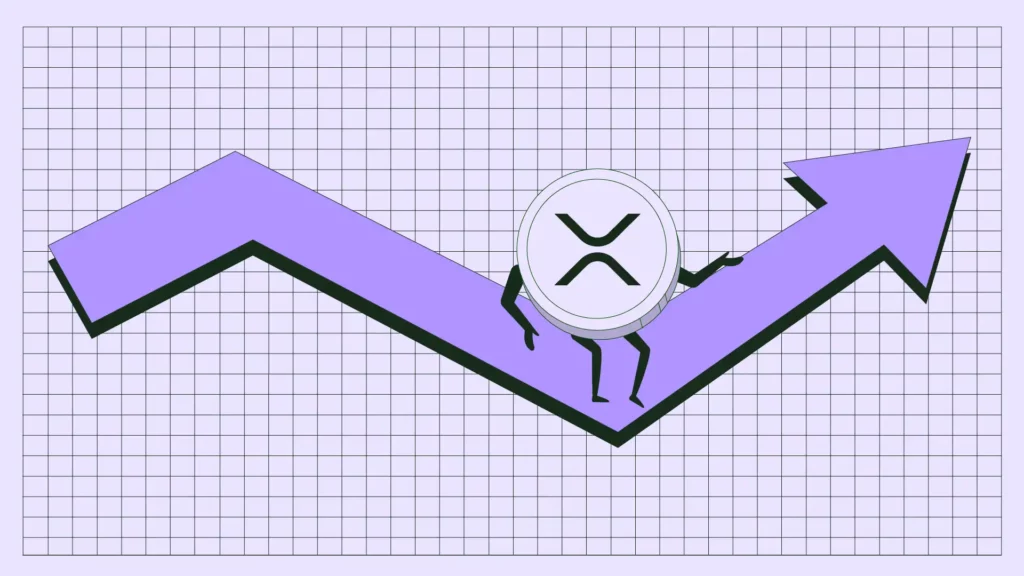
At the beginning of the month, XRP’s price was above $3. Today, as February continues, the value has plummeted by 35% and looks set to close below $2 — the lowest it has reached this year.
This pullback has shaken XRP holders’ confidence amid extreme market fear. With bearish momentum dominant, XRP faces a tough battle to regain the uptrend it experienced earlier.
One key factor contributing to XRP’s challenging recovery is a significant decline in trading volume. On Feb. 3, XRP saw a surge in volume, surpassing $40 billion.
However, as of this writing, that figure has fallen below $8 billion, raising red flags for potential price action. Typically, rising volume alongside a price increase signals strength and potential for further gains.
But with dwindling volume, it becomes increasingly difficult for XRP to maintain upward momentum.
Therefore, if this downward trend in volume continues, XRP’s price action could weaken further, making a notable recovery less likely.
Furthermore, one other metric that aligns with the XRP’s bearish position is the Open Interest (OI). OI represents the total number of open positions in a contract, which changes based on net positioning—either long or short.
When the OI increases, buyers are likely more aggressive than sellers, and market participants are increasing their net positioning.
From a technical perspective, the Moving Average Convergence Divergence (MACD) has consistently flashed red histogram bars. Until Sunday, Feb. 23, the MACD reading was positive, indicating bullish momentum around XRP.
The indicator’s rating indicates bearish momentum, especially as the 12-day Exponential Moving Average (EMA) has crossed below the 26 EMA. Typically, when the shorter EMA flips above the longer EMA on the MACD, it means that the trend is bullish.
However, in this scenario, the 12 EMA (blue) crossed below the 26 EMA (orange), indicating a bearish trend. Considering this position, XRP’s price might fall below the 0.50 Fibonacci retracement level.
If this happens, then the token might decline to $1.60. Should selling pressure intensify, the cryptocurrency’s value might drop to $1.17.
Alternatively, this correction might not extend further if XRP fails to slide under the 0.50 Fib level.
Instead, XRP’s value might rally to $2.78. When the bull market resumes full-time, the value could rise to $3.40.
Disclaimer:
The information provided in this article is for informational purposes only. It is not intended to be, nor should it be construed as, financial advice. We do not make any warranties regarding the completeness, reliability, or accuracy of this information. All investments involve risk, and past performance does not guarantee future results. We recommend consulting a financial advisor before making any investment decisions.
Victor Olanrewaju is a crypto analyst and reporter at CCN with deep roots in on-chain research and technical analysis. His crypto journey began in 2017, but it was the 2020 Uniswap airdrop that sparked a full-time pivot into the space.
With a foundation in copywriting, Victor honed his craft creating high-converting content for leading crypto brokers — most notably an XRP price prediction that ranked #1 on Google during the 2021 bull run.
He later joined AMBCrypto in 2022, where he combined storytelling with technical and on-chain analysis to cover key market narratives.
In 2024, he expanded his expertise at BeInCrypto, collaborating with analysts and using tools like Glassnode, Santiment, and IntoTheBlock to break down Bitcoin and altcoin trends.
At CCN, Victor covers the top cryptocurrencies, memecoins, macro shifts, blending real-time insights with deep-dive metrics.
He holds a Bachelor’s degree in Physics from the University of Ibadan, equipping him to simplify complex data for a wide audience. Follow his work or connect on LinkedIn or X.