CZ's Comments Cause GIGGLE Price Crash | Credit: Hameem Sarwar
Share
Key Takeaways
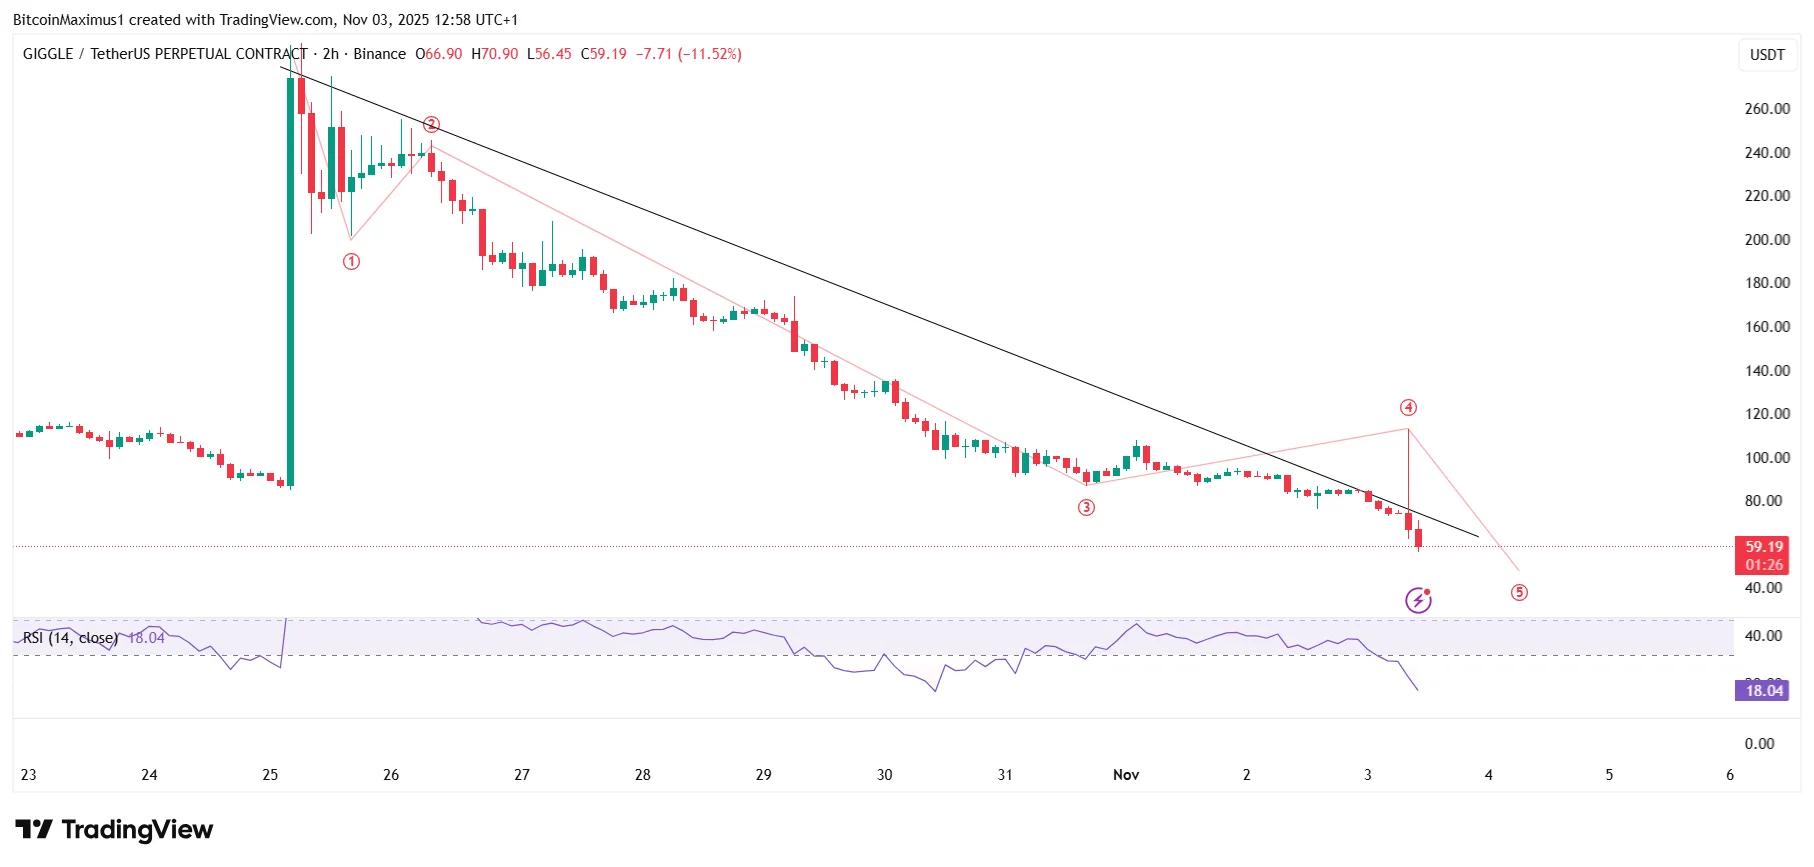
Giggle Fund (GIGGLE) has fallen by 80% since its all-time high price on Oct. 25.
The GIGGLE memecoin crashed after Changpeng Zhao (CZ) denied involvement.
Can GIGGLE recover after the negative news, or is the memecoin doomed for new lows?
The GIGGLE memecoin has declined since its all-time high.
However, it fell even more sharply today after Binance founder Changpeng Zhao (CZ) tweeted that it is not an official coin of the Giggle Academy and denied any knowledge of who launched it.
The GIGGLE price crashed after the negative news, and the downward movement continues.
Let’s examine the charts and figure out what lies ahead.
After bouncing at the trend line in October, the GIGGLE price hit a new all-time high of $285.50 on Oct. 25.
However, that proved to be the highest of the current cycle since the price of the GIGGLE memecoin fell by 80% after it.
Get These Top Crypto Casino Offers Now!
Sponsored
Disclosure
We sometimes use affiliate links in our content, when clicking on those we might receive a commission at no extra cost to you. By using this website you agree to our terms and conditions and privacy policy.
Disclaimer:
The information provided in this article is for informational purposes only. It is not intended to be, nor should it be construed as, financial advice. We do not make any warranties regarding the completeness, reliability, or accuracy of this information. All investments involve risk, and past performance does not guarantee future results. We recommend consulting a financial advisor before making any investment decisions.
Valdrin Tahiri is a cryptocurrency analyst and reporter at CCN, specializing in technical analysis with a focus on Elliott Wave theory, on-chain metrics, and fundamental research. He brings over seven years of experience in the crypto space as both a trader and writer.
He discovered cryptocurrencies in 2017 while earning his MSc in Financial Markets at the Barcelona School of Economics, which sparked a deep interest in blockchain and market dynamics. Since then, he’s contributed to top crypto outlets like BeInCrypto and CoinGape.
Valdrin also served as Community Manager of BeInCrypto’s Telegram group for three years, helping grow it into one of the largest crypto communities worldwide. His expertise in market structure and price patterns allows him to break down complex trends into clear, actionable insights.
He’s published thousands of articles covering altcoins, Bitcoin cycles, and macro trends.