XRP flashes reversal signals after correction | Credit: Hameem Sarwar
Share
Key Takeaways
After recent consolidation, XRP is showing early signs of a bullish reversal.
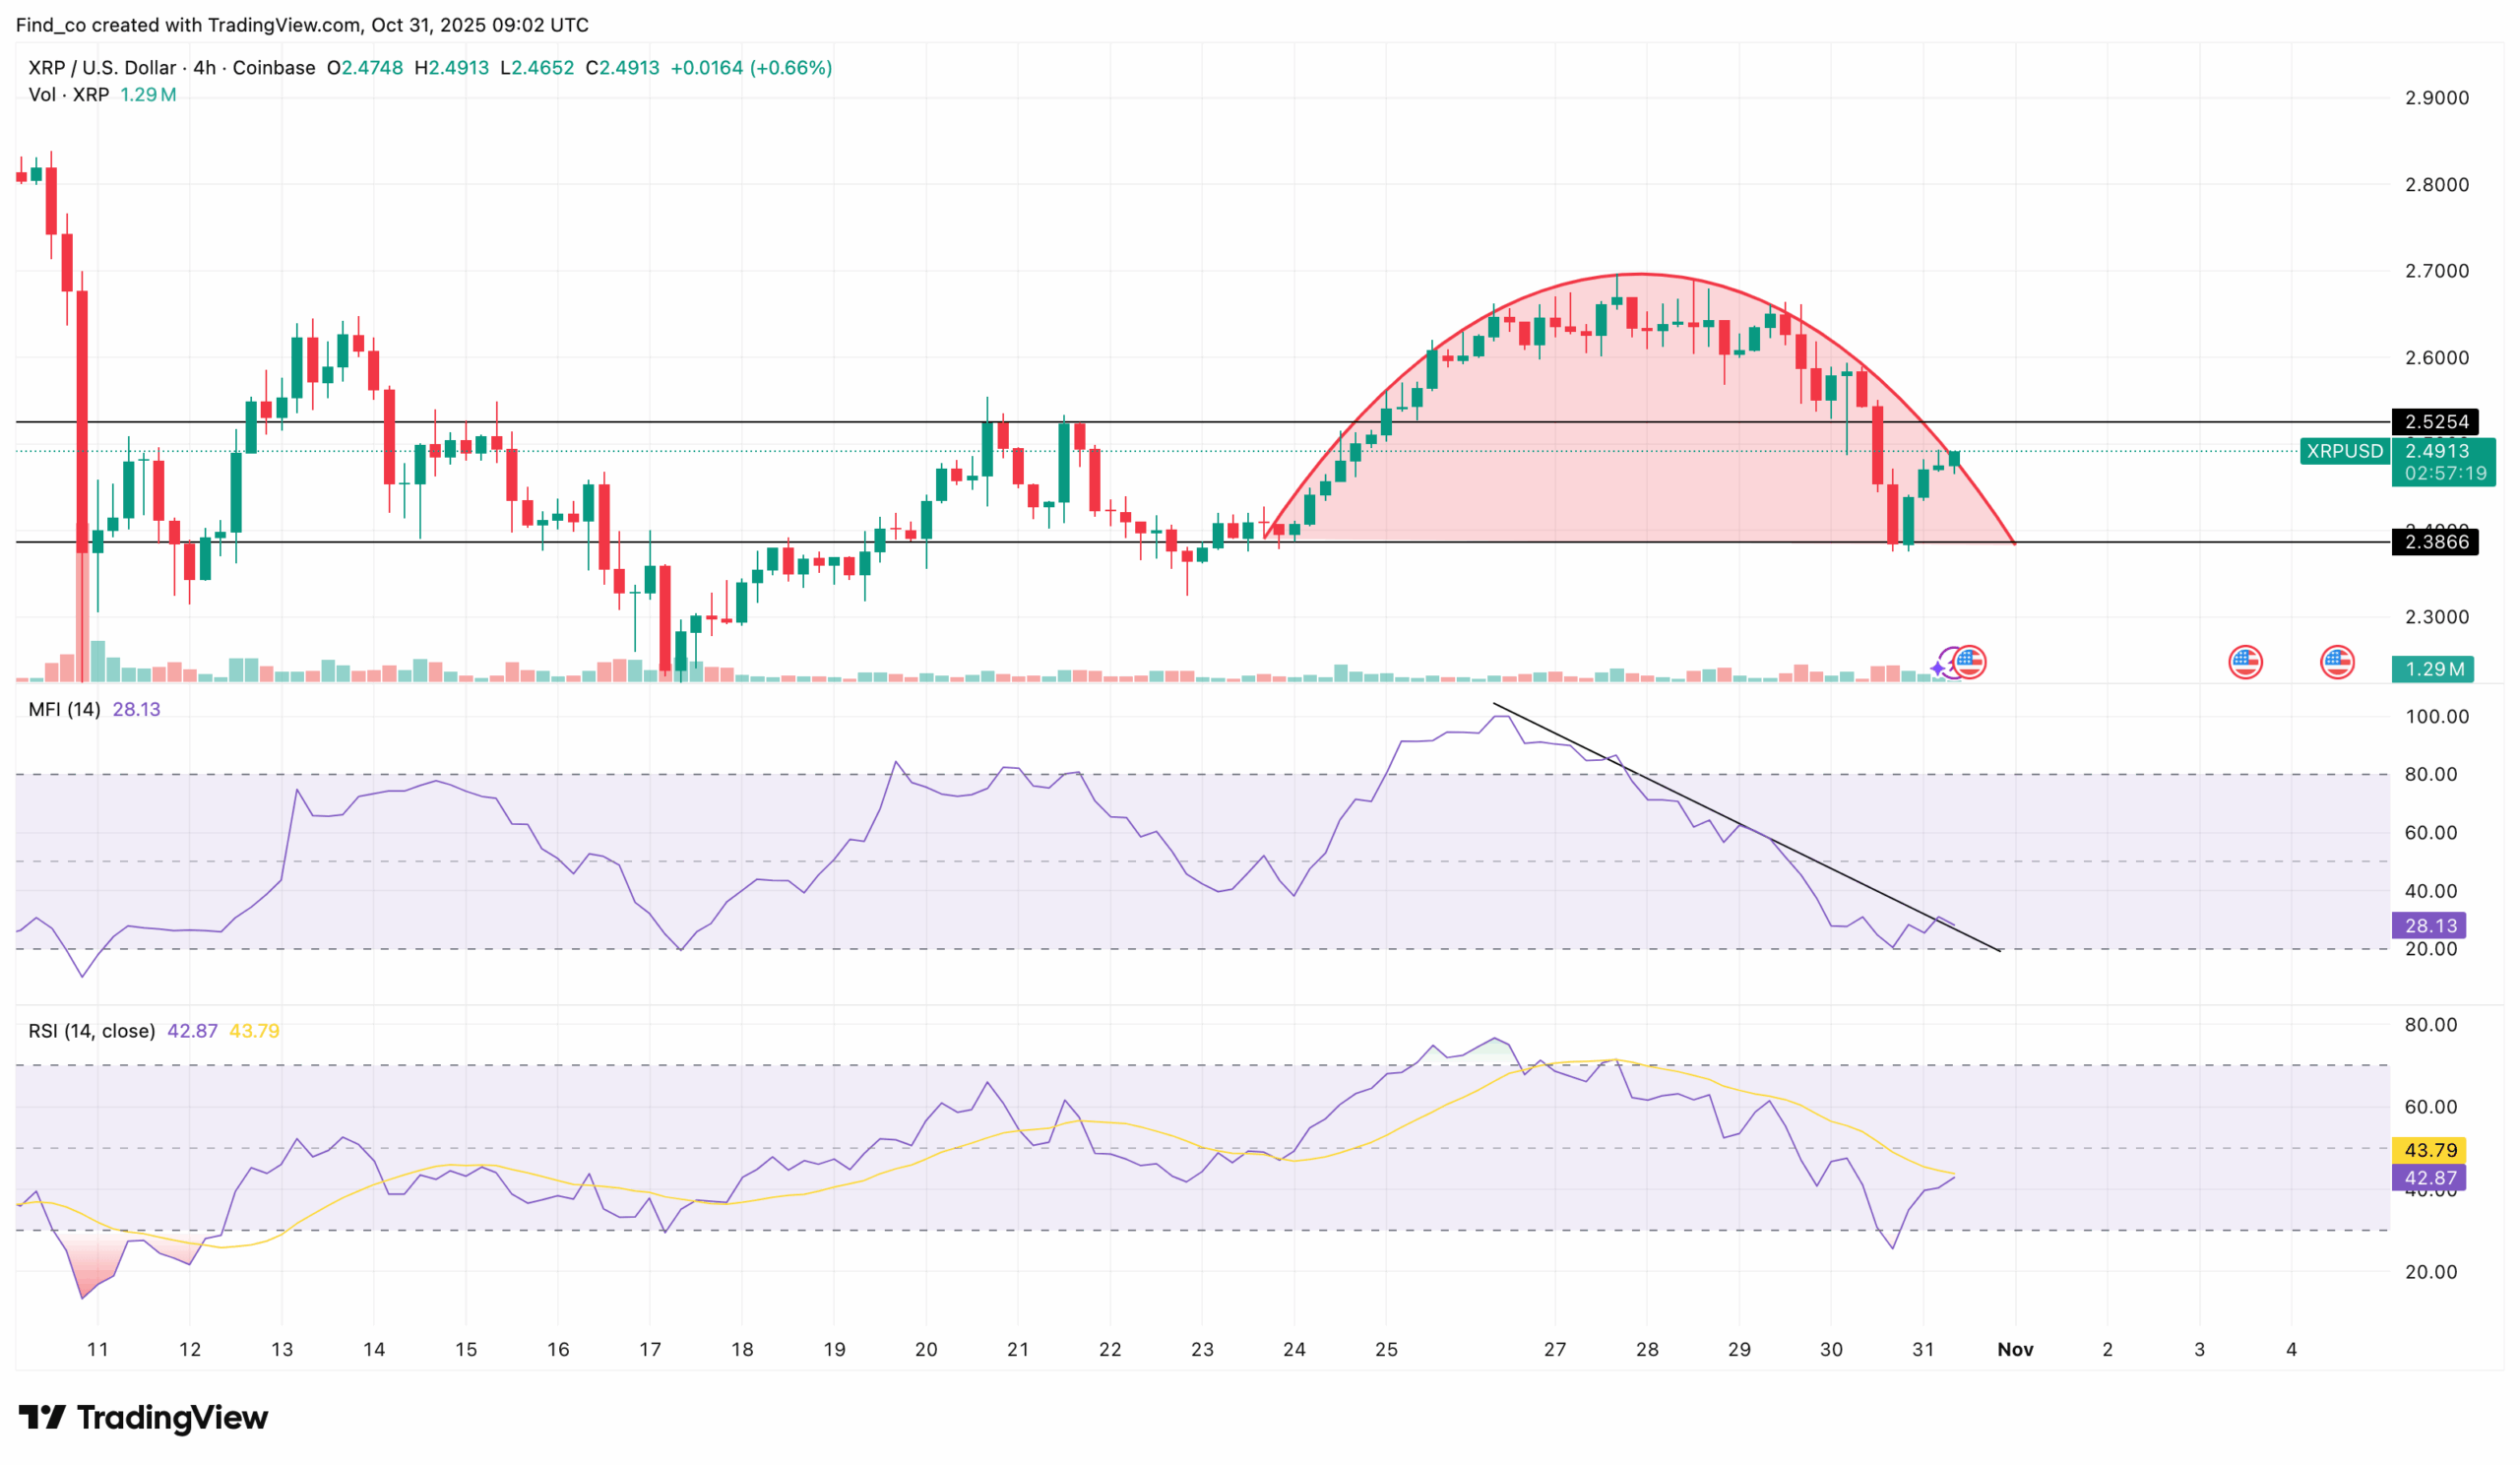
The MFI and RSI on the 4-hour chart signal fading bearish pressure
The CanaryFunds XRP spot ETF launch could drive the price higher.
After a pullback in recent days, XRP’s price is showing early signs of recovery.
The token, which had been consolidating within a narrow range and dipping into oversold territory, is now flashing bullish signals as key indicators suggest a reversal is underway.
With rising buying pressure emerging, traders are closely watching for a rebound that could push XRP back toward $3 in the short term.
As seen below, the altcoin has previously formed a rounding top pattern, indicating that the price could crash further.
However, at press time, XRP has bounced above the $2.39 support and is looking to trade higher above the $2.53 resistance.
Get These Top Crypto Casino Offers Now!
Sponsored
Disclosure
We sometimes use affiliate links in our content, when clicking on those we might receive a commission at no extra cost to you. By using this website you agree to our terms and conditions and privacy policy.
If this momentum continues, supported by rising MFI and RSI levels, XRP’s price could test the upper boundary of its current trading range.
ETF Launch Date Fuels Optimism
Further price strength could come from growing anticipation surrounding the upcoming XRP ETF.
The recent removal of the delay amendment, which previously gave the U.S. Securities and Exchange Commission (SEC) control over the approval timeline, has accelerated market optimism.
According to CCN’s findings, the ETF is scheduled to launch on Nov. 13.
“CanaryFunds has filed an updated S-1 for its XRP spot ETF, removing the ‘delaying amendment’ that stops a registration from going auto-effective and gives the SEC control over timing.” Journalist Eleanor Terrett reported.
XRP Price Outlook: Reversal Confirmed
On the daily chart, the Moving Average Convergence Divergence (MACD) continues to print green histogram bars, with the 12 EMA (blue) crossing above the 20 EMA (orange).
This bullish crossover signals building upward momentum. In addition, the setup suggests growing buying interest as traders position for another potential leg up.
Amid that, XRP’s price has bounced above the lower trendline of a symmetrical triangle. As seen below, altcoin is attempting to breach the upper trendline and resistance.
Meanwhile, the Chaikin Money Flow (CMF) also supports this positive sentiment.
Although still near the neutral zone, the indicator is trending upward, reflecting strengthening capital inflows.
If this trend continues, it could signal a transition from cautious accumulation to active buying.
Fibonacci retracement levels reveal what could happen to XRP’s possible short-term performance.
At press time, XRP trades at $2.46, approaching the 0.382 Fib level.
A clear breakout above this point could pave the way toward resistance at $2.72, followed by a potential rally to $3.26 near the 0.786 Fib level.
However, if XRP’s price loses momentum, it could slip toward the next support zone at the 0.236 Fib level, near $2.22. A deeper correction might extend the decline to $1.77.
Disclaimer:
The information provided in this article is for informational purposes only. It is not intended to be, nor should it be construed as, financial advice. We do not make any warranties regarding the completeness, reliability, or accuracy of this information. All investments involve risk, and past performance does not guarantee future results. We recommend consulting a financial advisor before making any investment decisions.
Victor Olanrewaju is a crypto analyst and reporter at CCN with deep roots in on-chain research and technical analysis. His crypto journey began in 2017, but it was the 2020 Uniswap airdrop that sparked a full-time pivot into the space.
With a foundation in copywriting, Victor honed his craft creating high-converting content for leading crypto brokers — most notably an XRP price prediction that ranked #1 on Google during the 2021 bull run.
He later joined AMBCrypto in 2022, where he combined storytelling with technical and on-chain analysis to cover key market narratives.
In 2024, he expanded his expertise at BeInCrypto, collaborating with analysts and using tools like Glassnode, Santiment, and IntoTheBlock to break down Bitcoin and altcoin trends.
At CCN, Victor covers the top cryptocurrencies, memecoins, macro shifts, blending real-time insights with deep-dive metrics.
He holds a Bachelor’s degree in Physics from the University of Ibadan, equipping him to simplify complex data for a wide audience. Follow his work or connect on LinkedIn or X.