XRP short liquidations outpace long liquidations by 8:1 as the token rallies nearly 5% amid a broader market recovery.
Derivatives data on Binance has turned decisively bullish, hinting at further price gains.
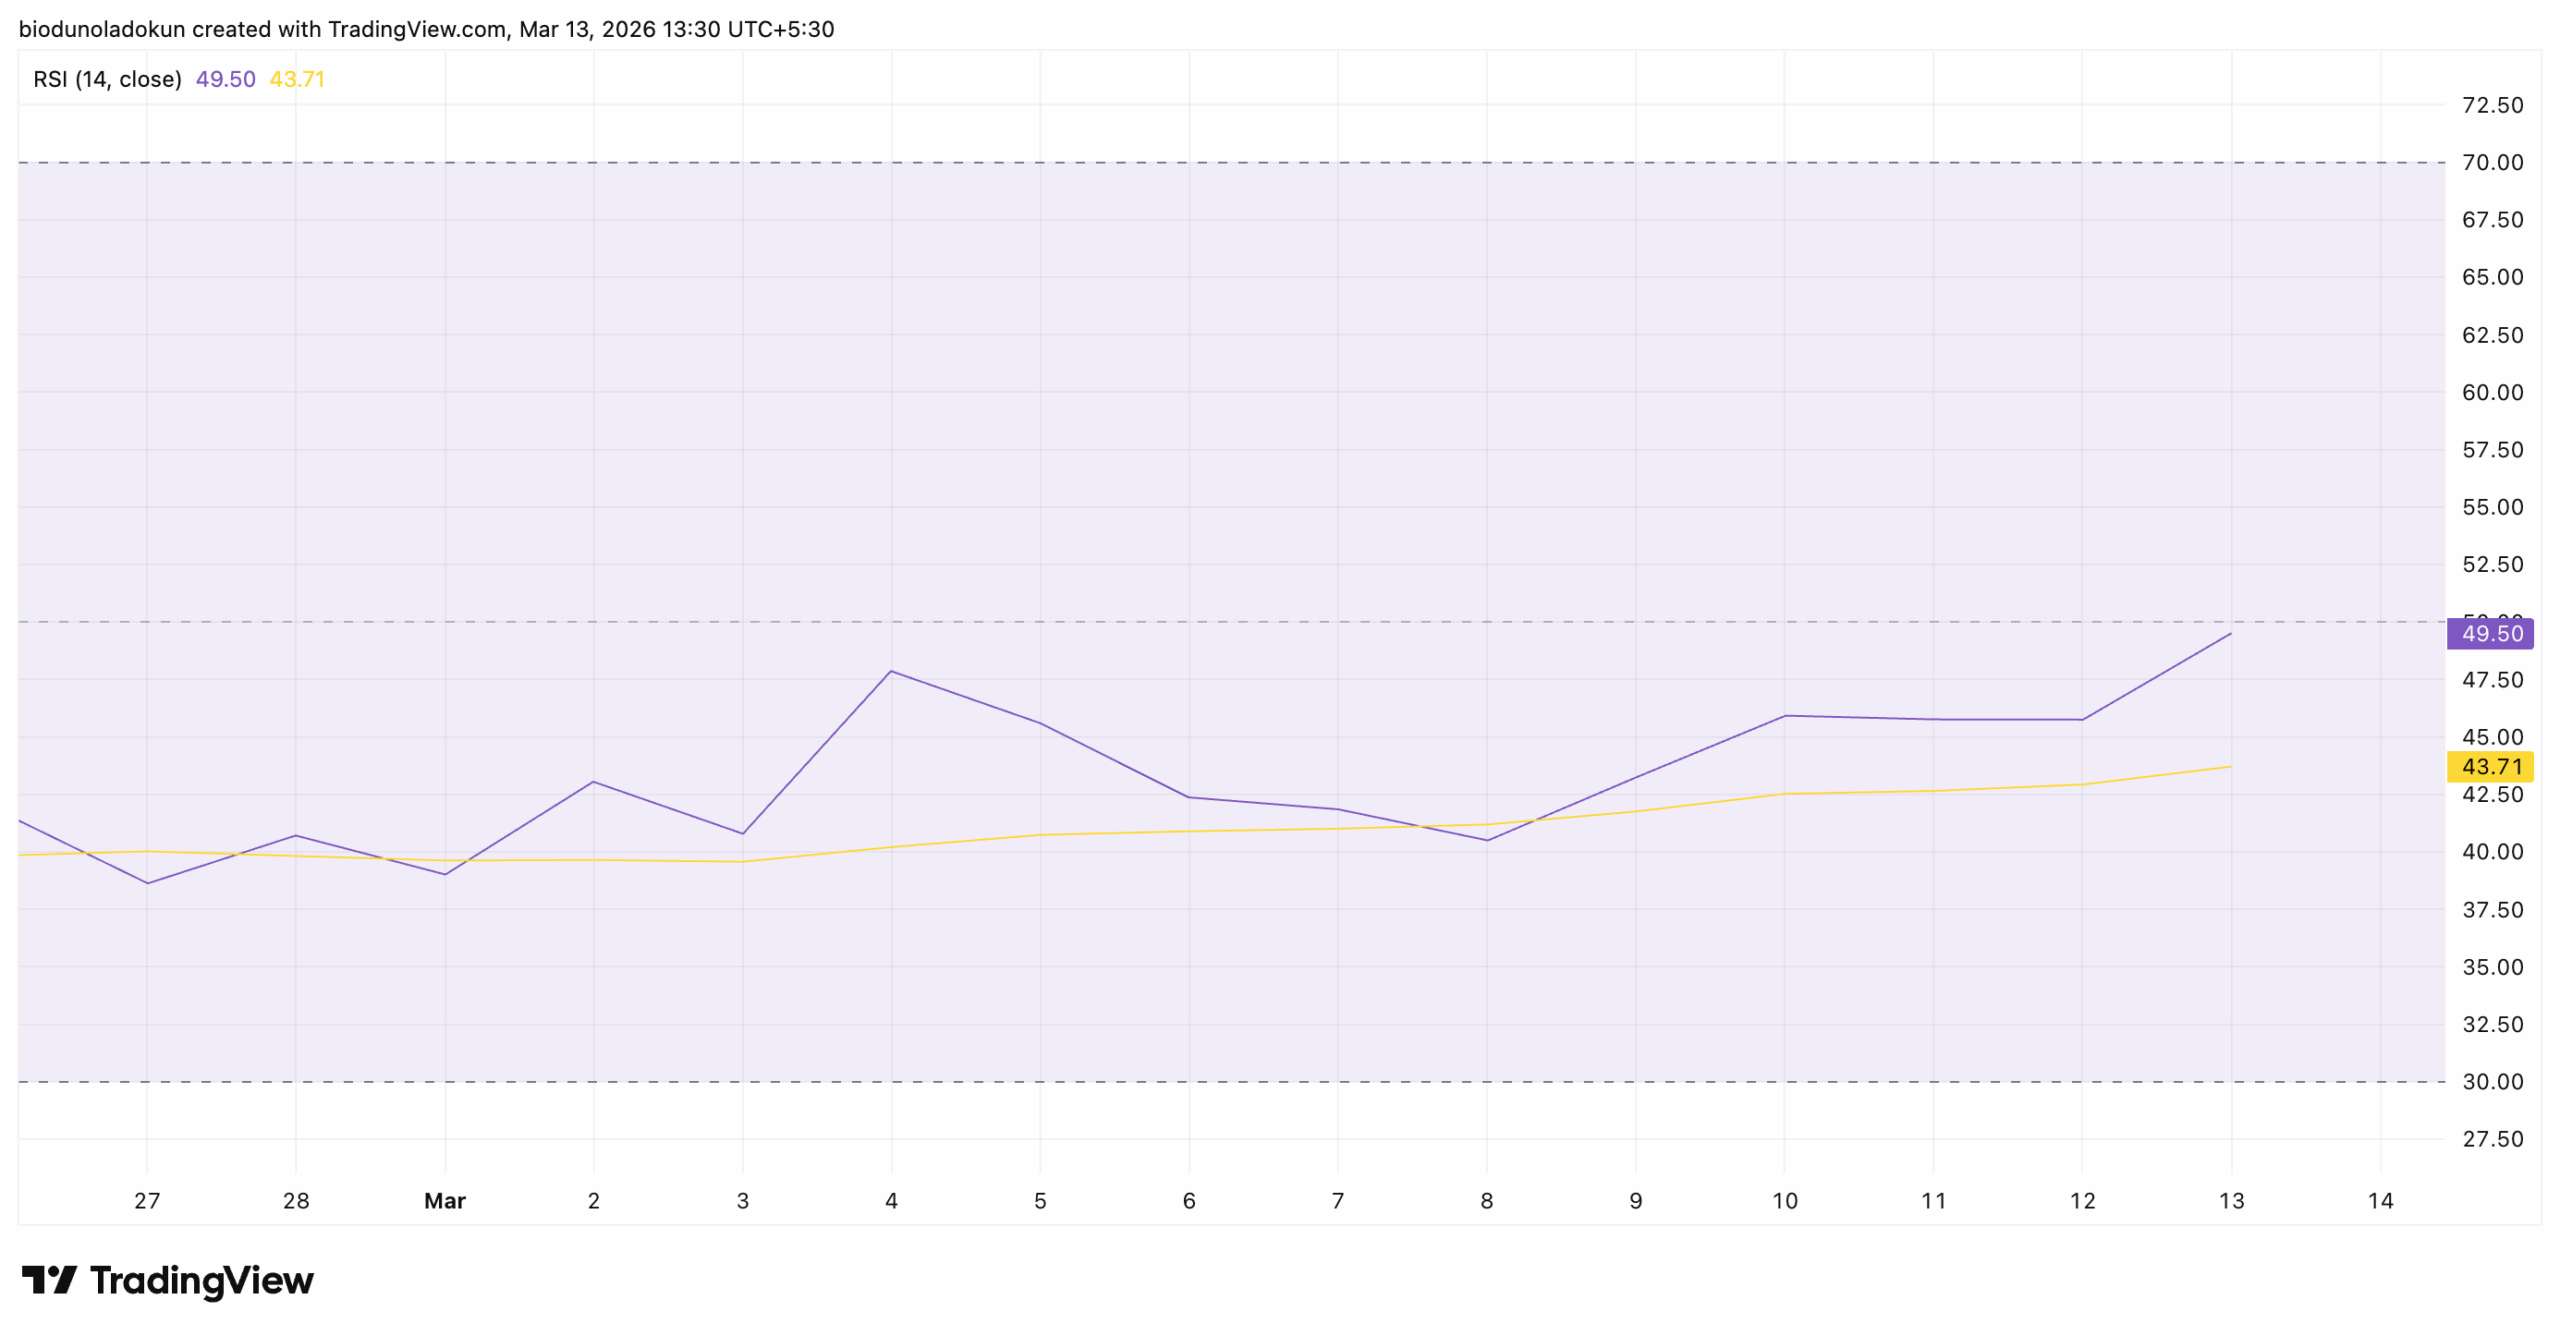
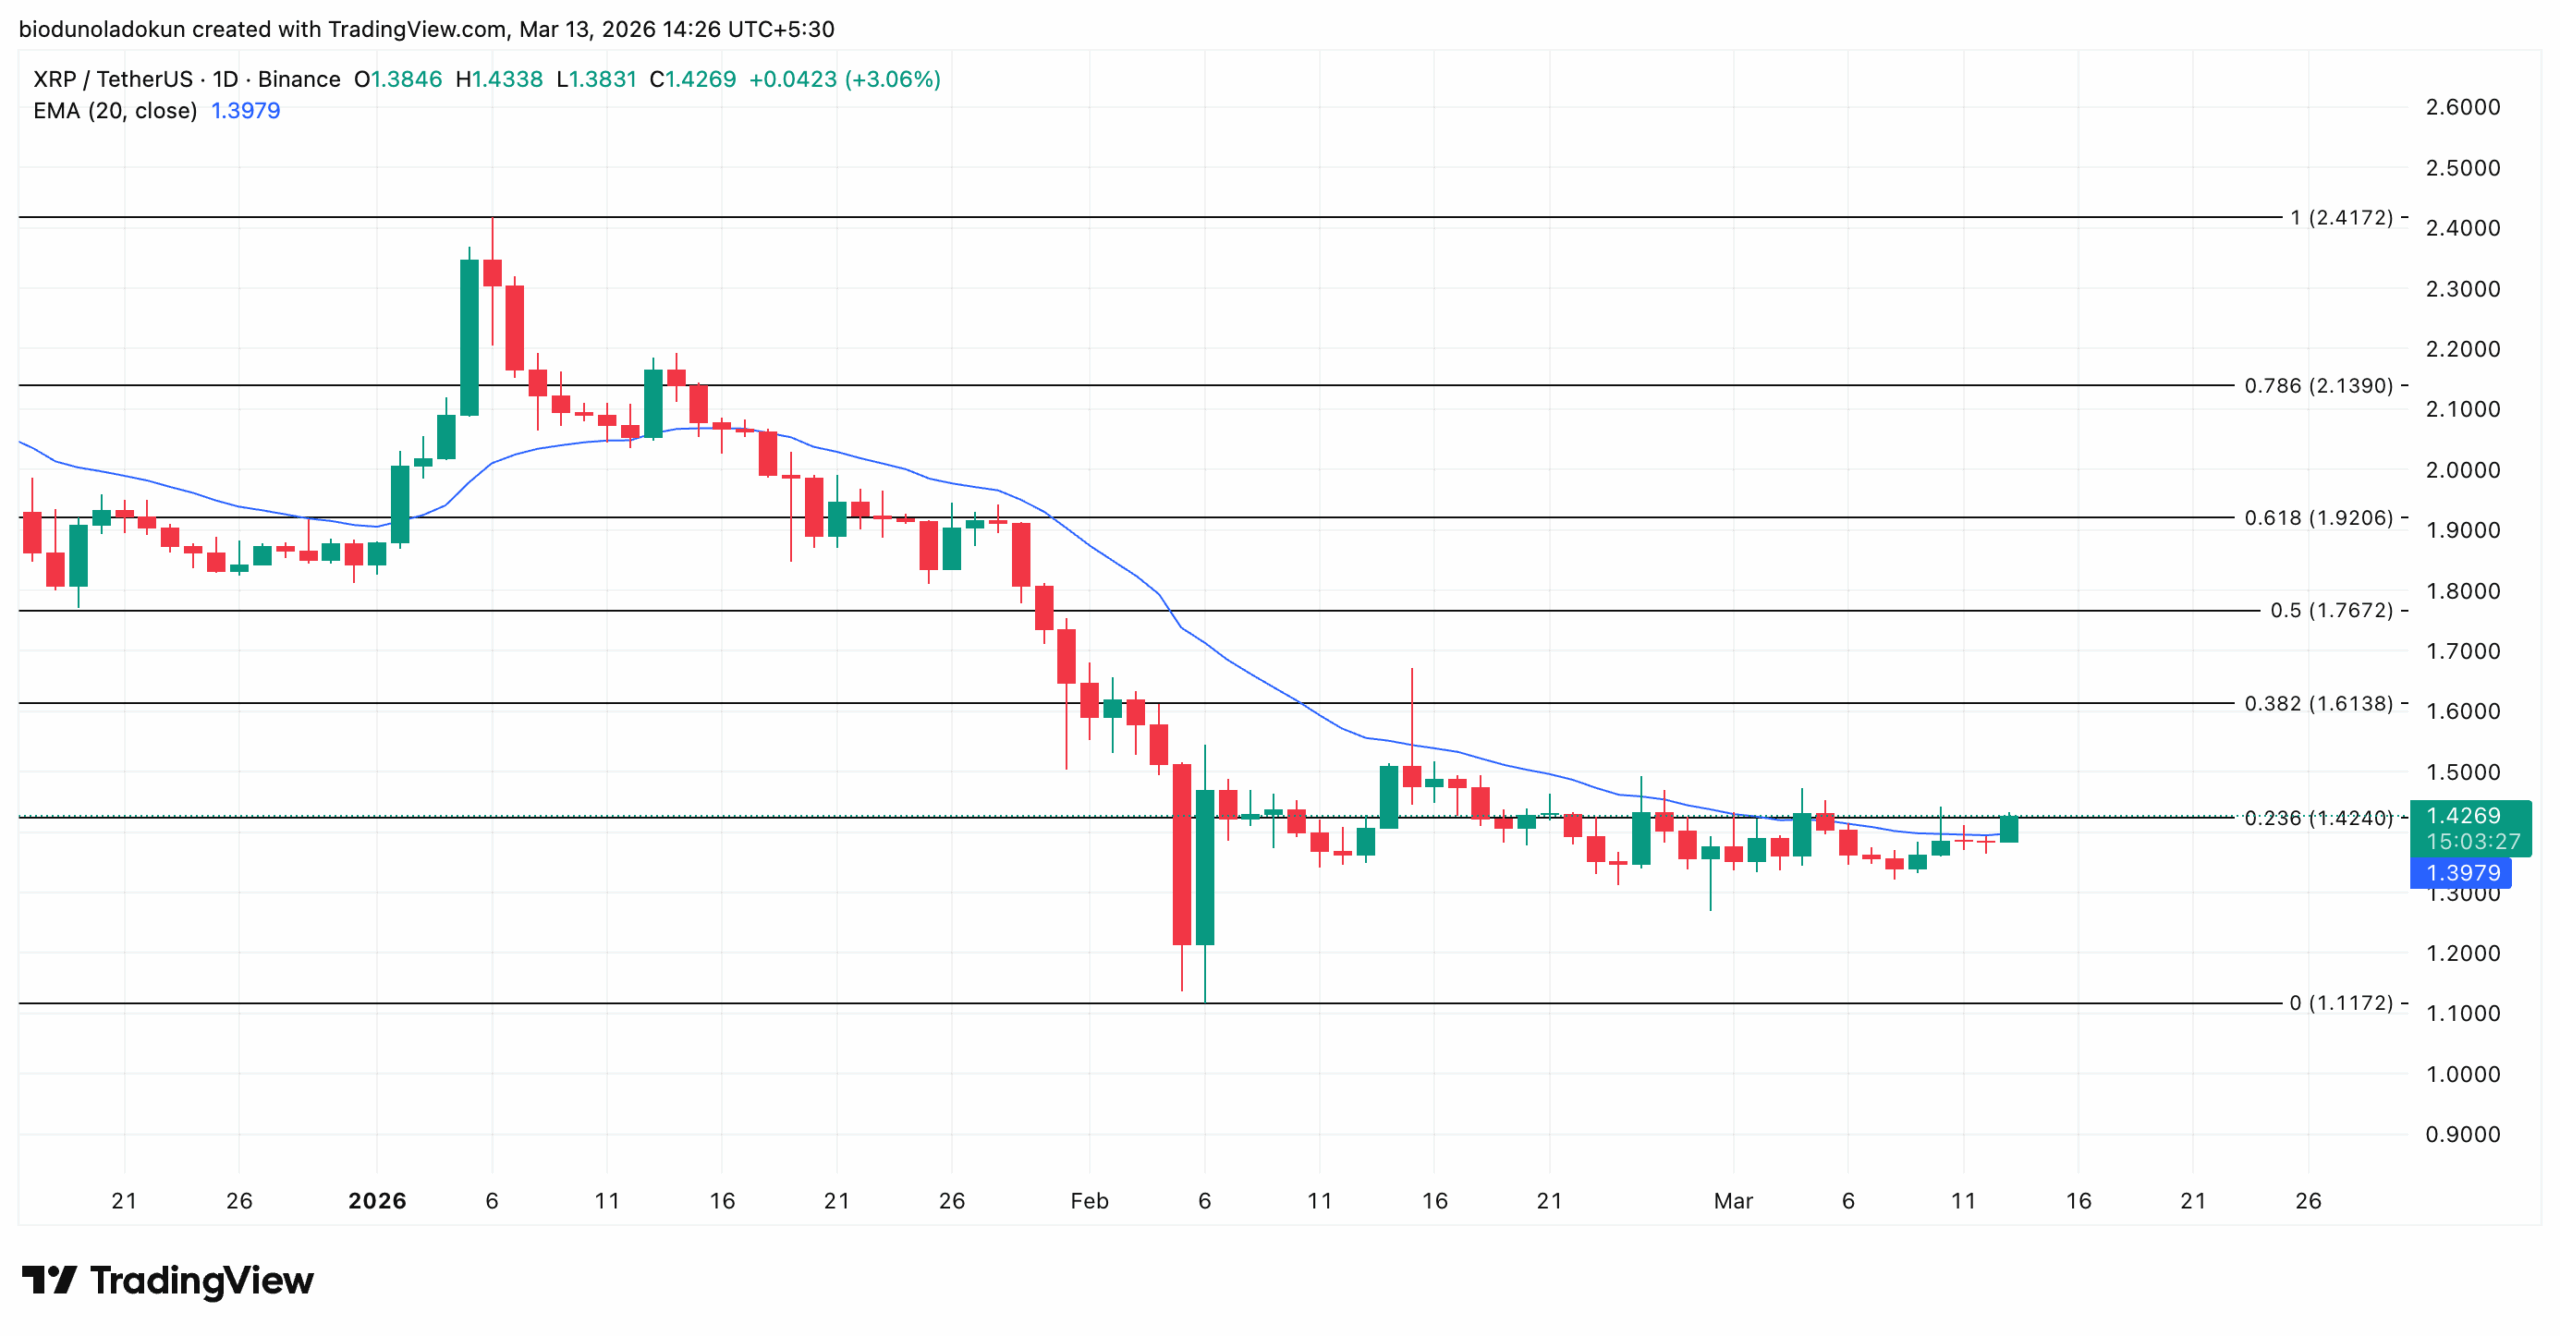
XRP has reclaimed its 20-day EMA, with the RSI approaching 50 — bulls need a daily close above both levels to confirm continuation toward $1.61; failure risks a drop to $1.11.
XRP short sellers have suffered significant losses over the past 12 hours as the token climbed nearly 5% amid a broad crypto market recovery on Friday.
The move comes as the total crypto market capitalization rises roughly 2% over the past 24 hours, signaling a decisive uptick in market-wide demand.
With on-chain and futures data suggesting the pressure on bears is not easing, XRP short traders may witness further losses.
XRP Short Sellers Bleed
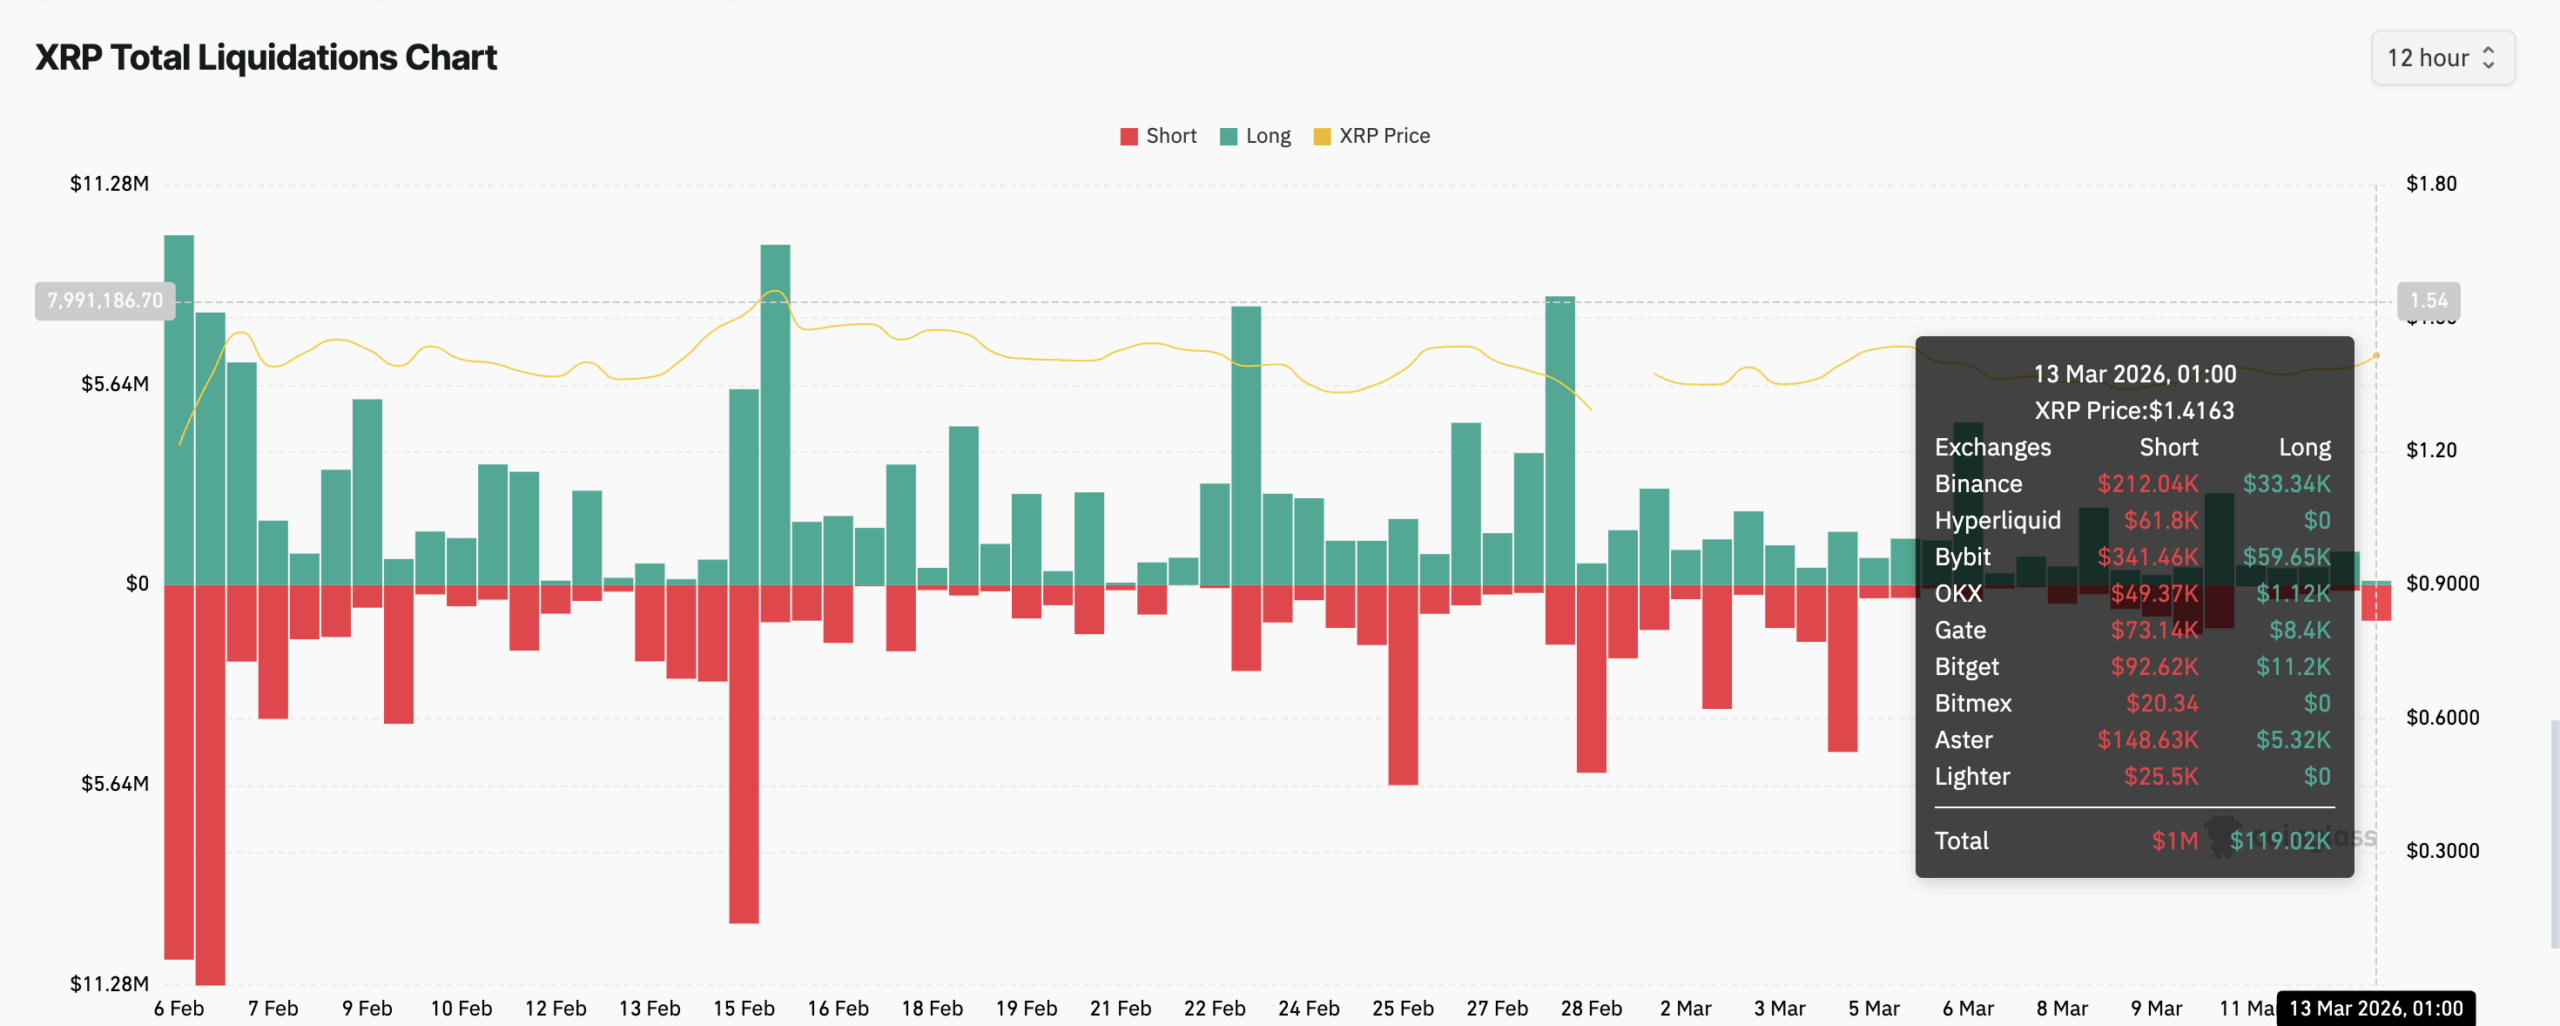
Data from Coinglass shows that in the 12-hour window ending 01:00 UTC on March 13, XRP futures short liquidations totaled $1 million across major exchanges, dwarfing the $119,000 wiped from long positions.
The 8:1 ratio signals that bears were aggressively positioned against an upside and have been caught offside as XRP’s price pushes upward.
Per Coinglass, Bybit recorded the heaviest short liquidations at $341,460, with Binance following at $212,0409, Aster at $148,630, and Gate at $73,140.
Hyperliquid, OKX, and Bitget added further pressure, while long liquidations across all exchanges remained negligible, a sign that bulls hold the advantage in the derivatives market.
XRP Futures Buyers Overwhelm Sellers
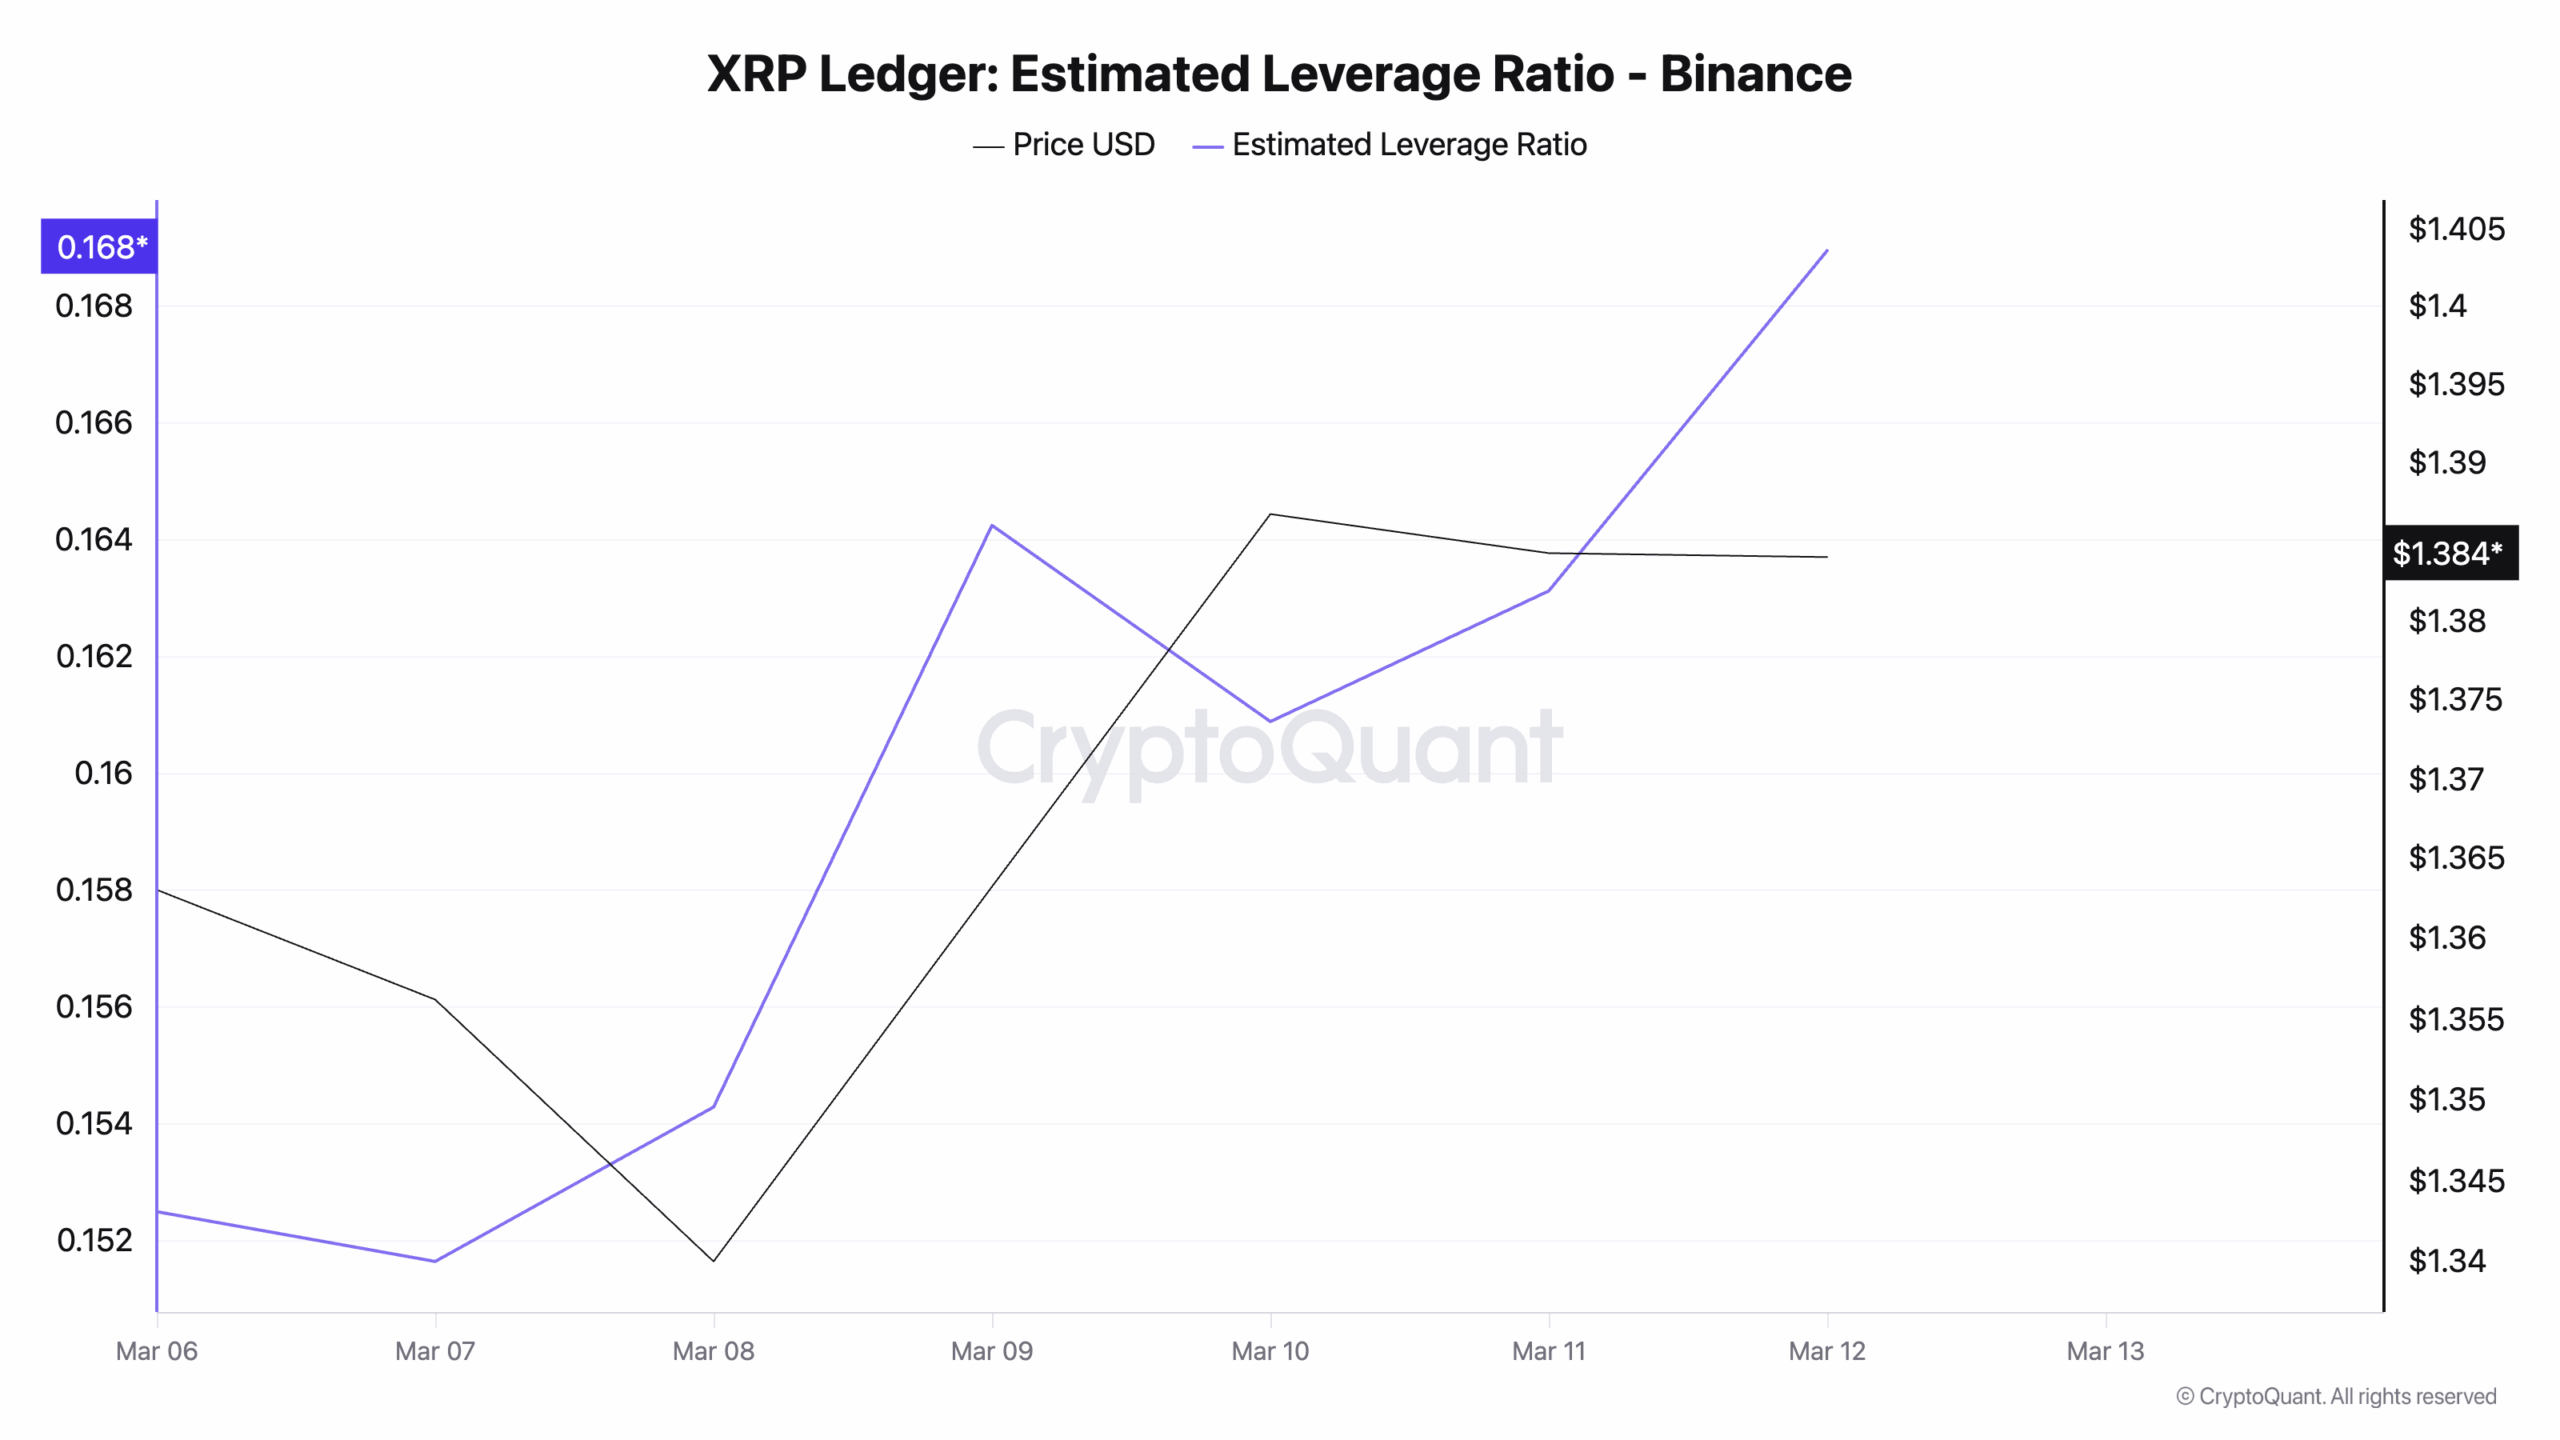
XRP’s rising Estimated Leverage Ratio (ELR) on leading exchange Binance supports this positive outlook.
According to CryptoQuant, this metric currently sits at a seven-day high of 0.168.
XRP Binance Estimated Leverage Ratio | Credit: CryptoQuant
An asset’s ELR tracks the average leverage its traders use to complete trades on a cryptocurrency exchange. It is calculated by dividing the asset’s open interest by the exchange’s reserve for that currency.
When it declines, it signals waning risk appetite among traders. It shows that investors are becoming more cautious about the token’s near-term outlook and steering clear of high-leverage positions that could magnify losses.
On the other hand, a rising ELR like XRP’s indicates that traders are taking on larger leveraged positions, showing stronger conviction.
For XRP, this trend shows a market growing increasingly confident in a short-term recovery, with leveraged traders doubling down on upside.
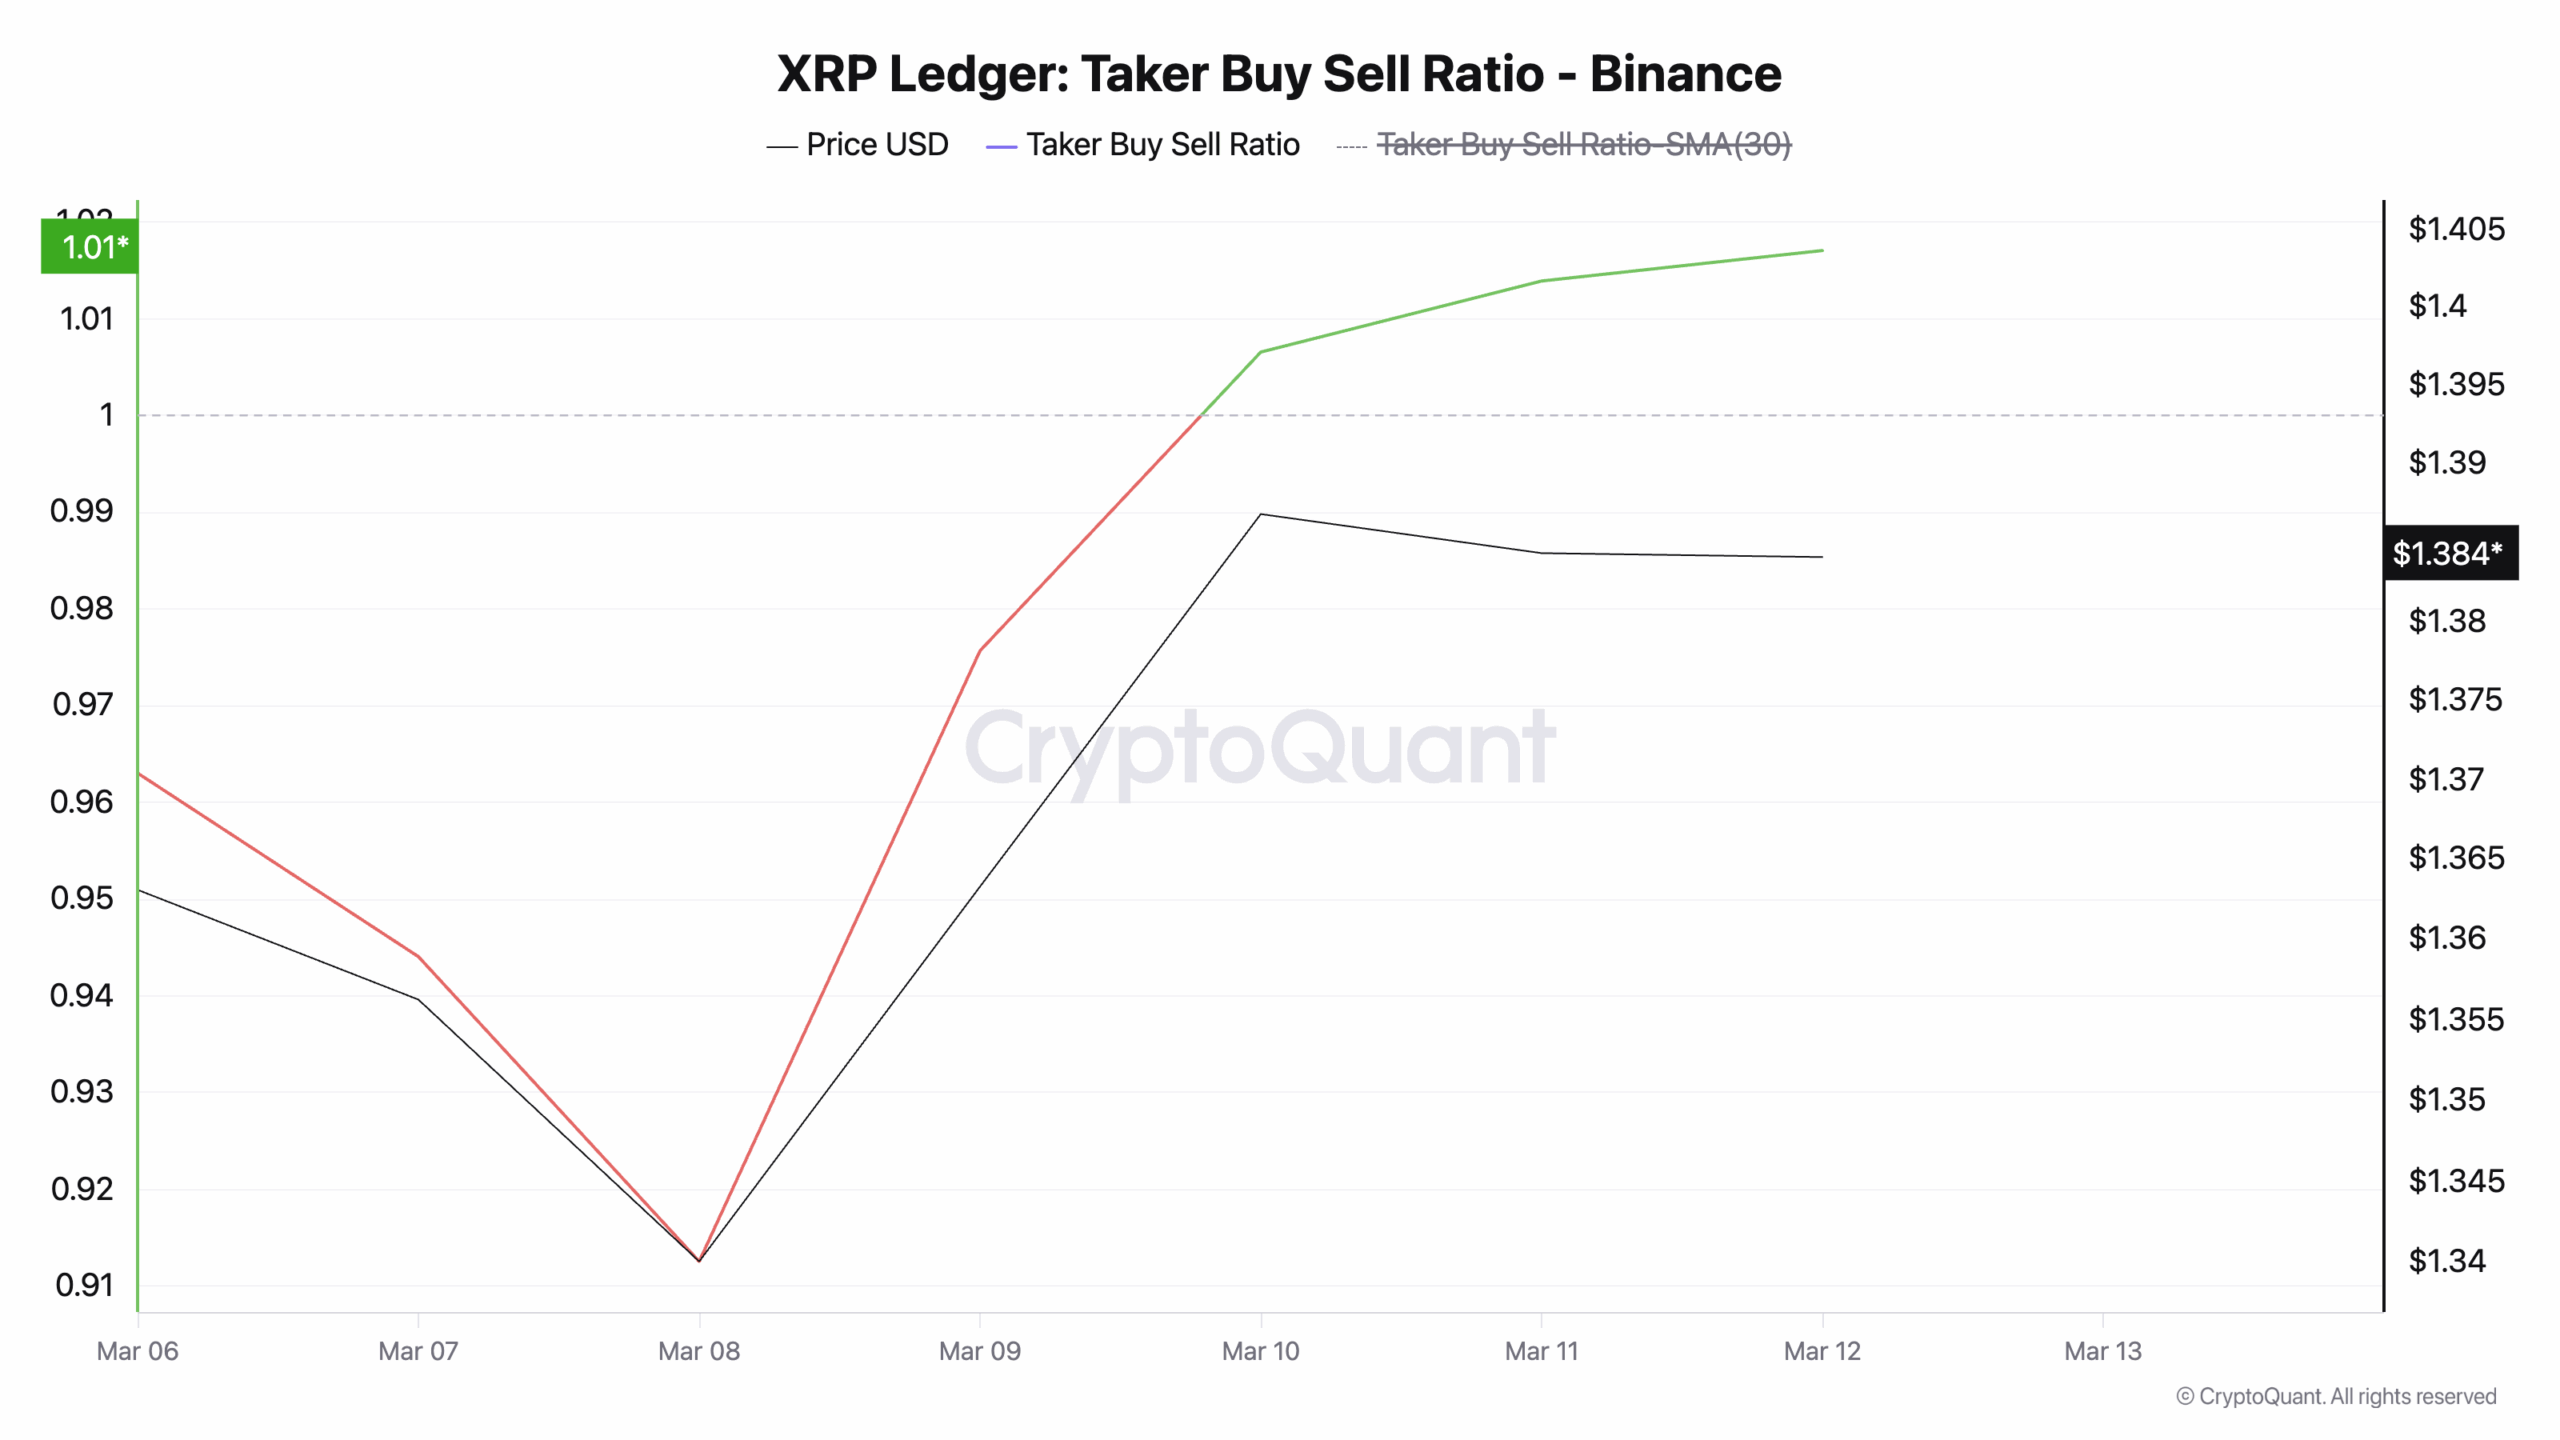
Furthermore, XRP’s Taker Buy Ratio on Binance, which has climbed back above 1, confirms the building buy pressure in its derivatives market.
An asset’s taker buy-sell ratio measures the ratio of buy to sell volumes in its futures market. Values above one indicate more buy than sell volume, while values below one suggest that more futures traders are selling their holdings.
According to Coinglass, XRP’s Taker-Buy Ratio is 1.01 at press time, sitting above the 1 threshold for the first time since the token’s early-March selloff.
A Taker Buy Ratio at this level indicates that XRP buyers are dominating order flow on Binance. This is a conviction-driven demand that suggests buyers are absorbing sell-side resistance rather than retreating from it.
One Close Could Flip the Momentum Signal
On the daily chart, XRP’s Relative Strength Index is trending higher, pressing against the 50 neutral line. At press time, this key momentum indicator stands at 49.50.
The RSI indicator measures an asset’s overbought and oversold market conditions. It ranges between 0 and 100. Values above 70 suggest the asset is overbought and due for a price decline, while values below 30 indicate the asset is oversold and may witness a rebound.
At 49.50, XRP’s RSI is knocking on the door of bullish territory. A confirmed close above 50 would decisively shift momentum in favor of buyers and drive prices higher.
Key Moving Average Turns Support as XRP Bulls Regain Footing
Moreover, XRP’s rally over the past day has once again pushed its price above the 20-day Exponential Moving Average (EMA). This key moving average now serves as support at $1.39 for XRP’s price.
The 20-day EMA measures an asset’s average trading price over the past 20 days, giving more weight to recent prices.
When an asset trades below its 20-day EMA, it indicates that the market is dominated by sellers and that short-term momentum is bearish.
Traders see this as a signal that the asset could face further declines unless buying pressure returns to push the price back above the moving average.
On the other hand, when the price is above this key moving average, it signals that buyers are in control of short-term momentum and that the market is trending higher.
Traders interpret this as a bullish condition, using the 20-day EMA as a dynamic support level—a floor that, if held, confirms the uptrend remains intact and opens the door to further gains.
As long as XRP holds above this level on a daily closing basis, the structure supports the move toward $1.61.
A failure to hold, however, would signal that the recovery is losing steam and put bears back in control. In this scenario, XRP’s price risks plunging to $1.11.
[You-may-like]
Disclaimer:
The information provided in this article is for informational purposes only. It is not intended to be, nor should it be construed as, financial advice. We do not make any warranties regarding the completeness, reliability, or accuracy of this information. All investments involve risk, and past performance does not guarantee future results. We recommend consulting a financial advisor before making any investment decisions.
Abiodun Oladokun is a Research Analyst at CCN, where he covers cryptocurrency markets with a focus on on-chain analysis, technical assessments, and emerging trends across decentralized finance (DeFi), real-world assets (RWA), artificial intelligence (AI), decentralized physical infrastructure networks (DePIN), Layer 2s, and meme coins.
Prior to CCN, he served as a Senior On-Chain Analyst at BeInCrypto, producing market reports spanning diverse crypto sectors.
Before that, he conducted technical analysis and market assessments of various altcoins at AMBCrypto, where he also contributed long-form quarterly research papers on DeFi, NFTs, DAOs, and scaling architectures, leveraging on-chain platforms including Messari, Santiment, DefiLlama, and Dune Analytics.
He began his crypto career as a research analyst at SixthSense DAO, developing blockchain forensic tools to trace the history of stolen assets.
Abiodun is a lawyer called to the Nigerian Bar and the founder of Ilé Ijó, a Lagos-based electronic dance music collective.