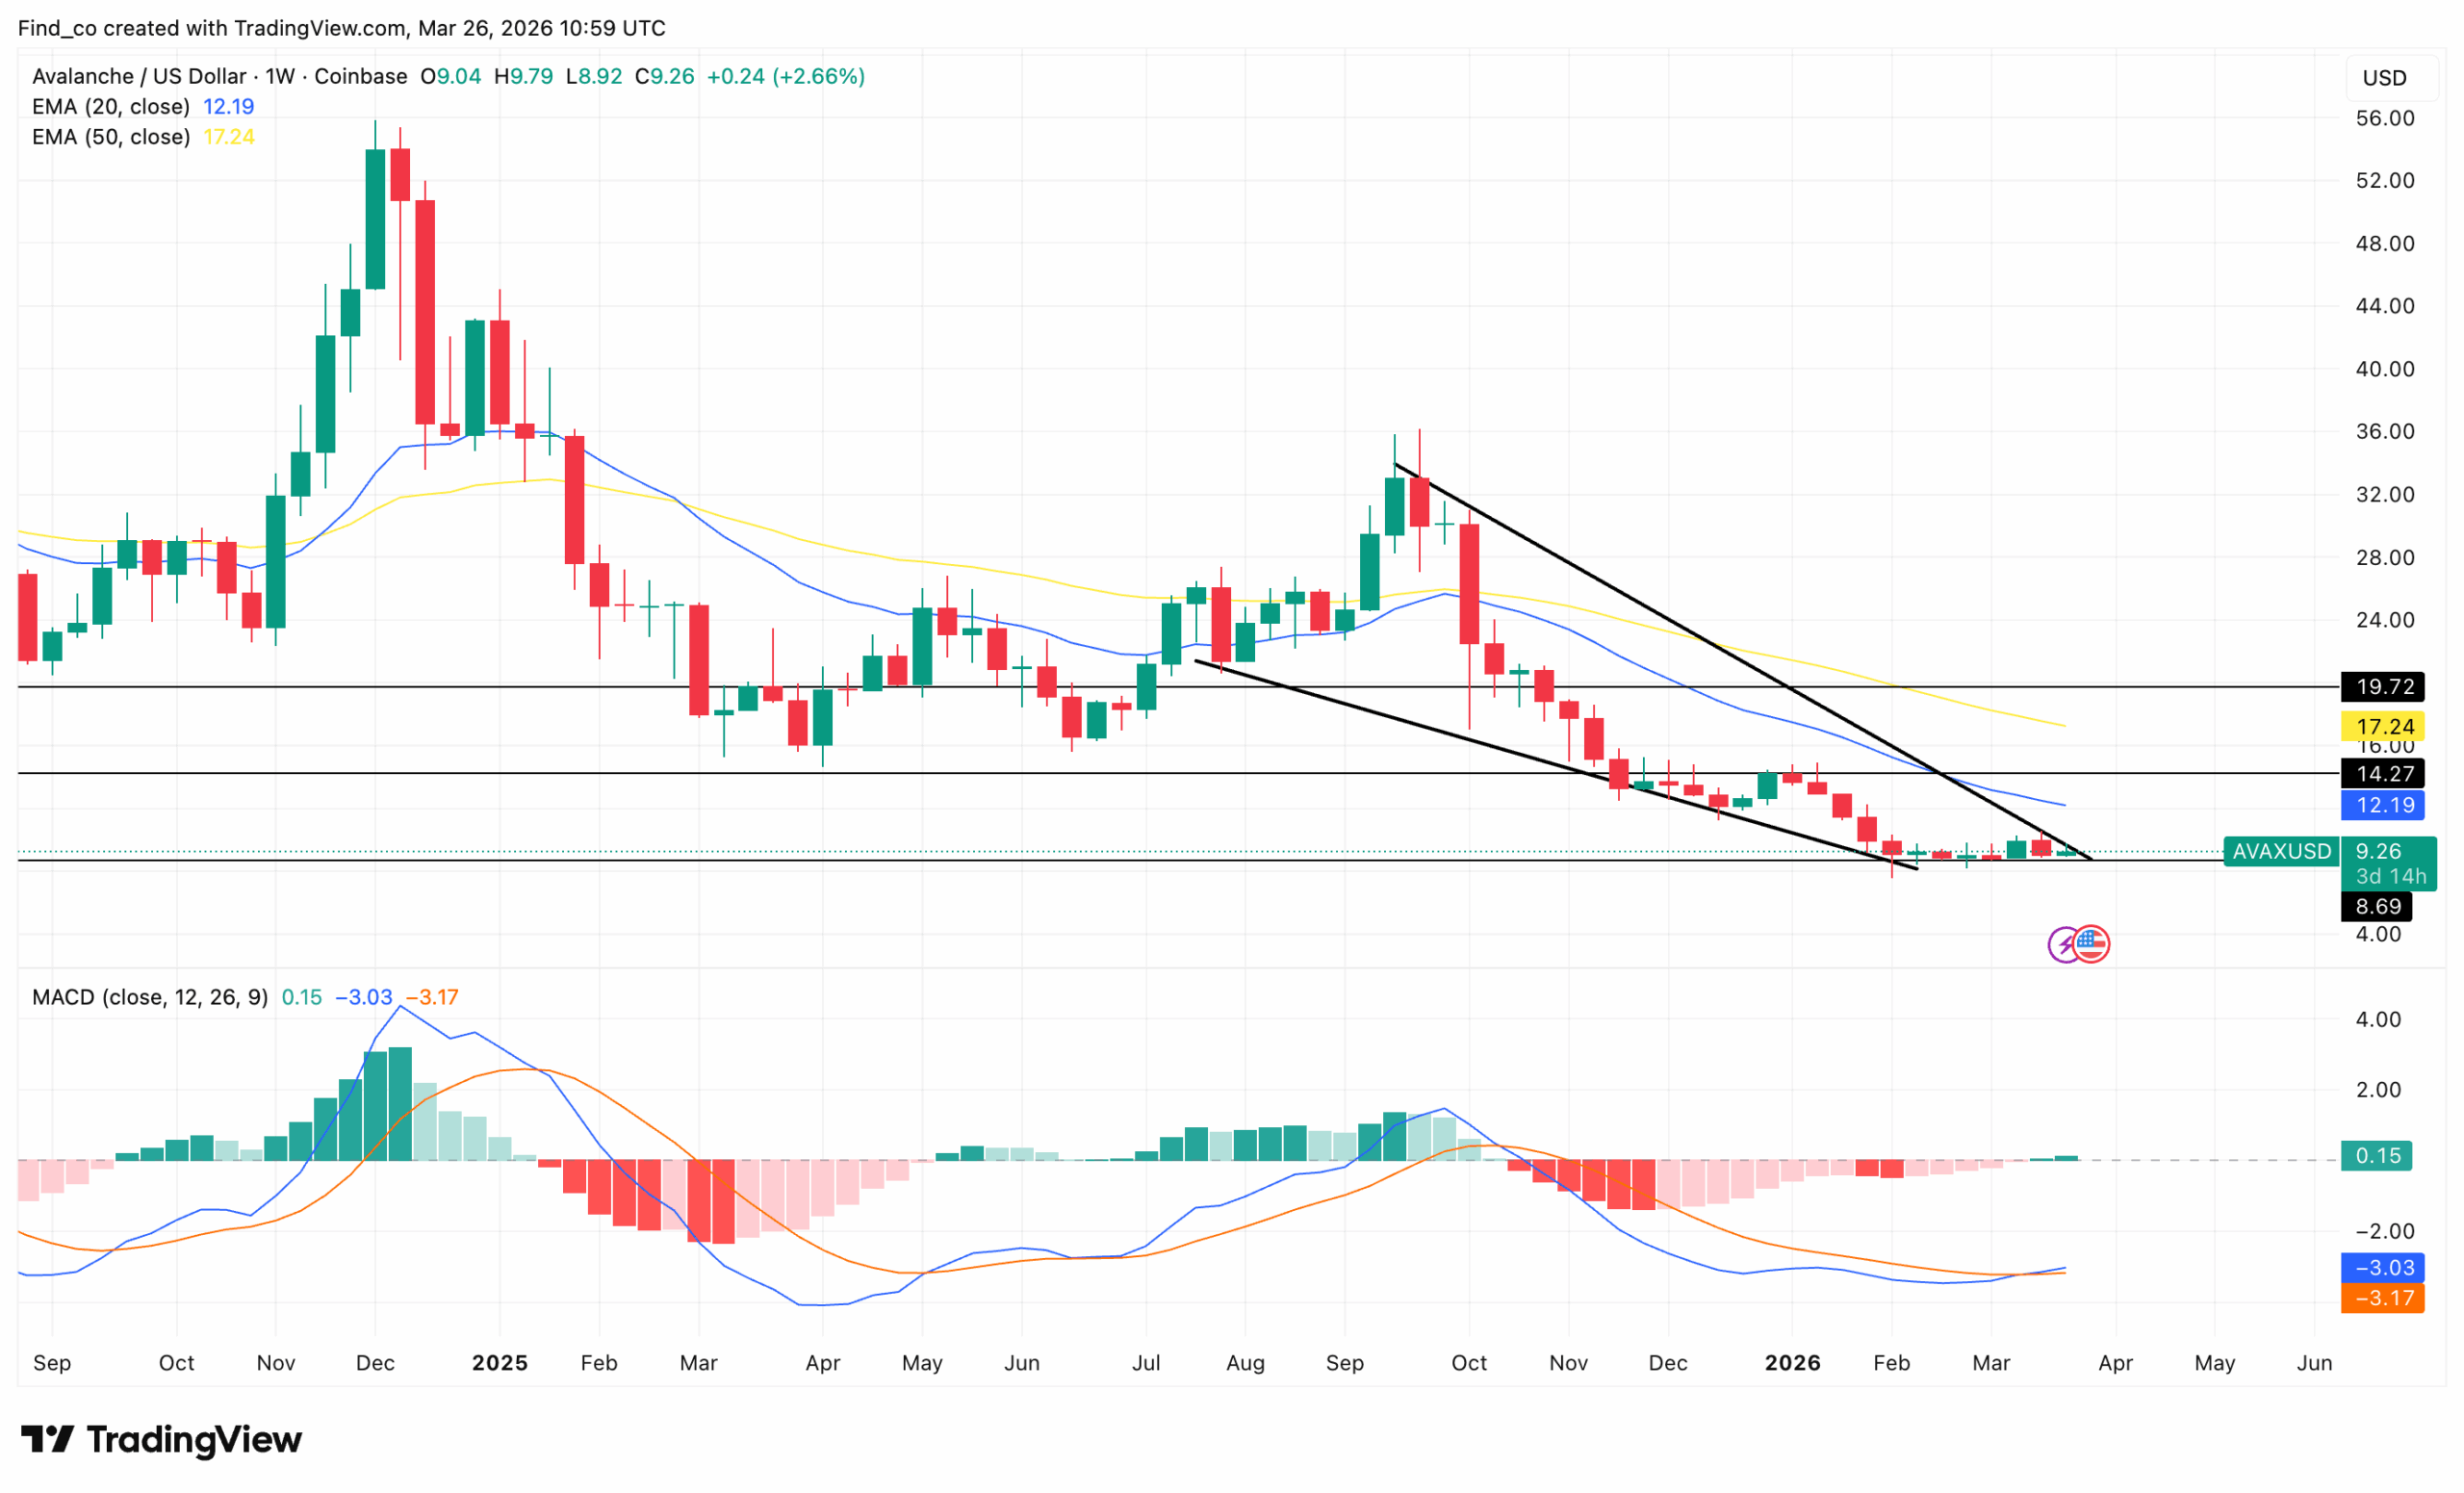
At press time, AVAX trades at $9.26. From the December 2024 peak near $54, AVAX has shed over 82%.
The descent accelerated after October 2025, when a brief rally to $36 failed and a descending triangle formed.
However, the horizontal support finally broke, and AVAX’s price collapsed into the $9 zone. For context, the last time the altcoin reached this level was around 2023.
Both EMAs loom far overhead as heavy resistance. The 20 EMA sits at $12.19 and the 50 EMA at $17.24, creating a substantial wall that any recovery must eventually overcome.
That single green histogram bar is the most encouraging signal available. Historically, on weekly timeframes, momentum exhaustion precedes recovery by several weeks.
Nevertheless, AVAX’s price needs to reclaim $12.19 before any bull case becomes credible. But as it stands, it could be challenging.
AVAX Price Outlook: No Rebound
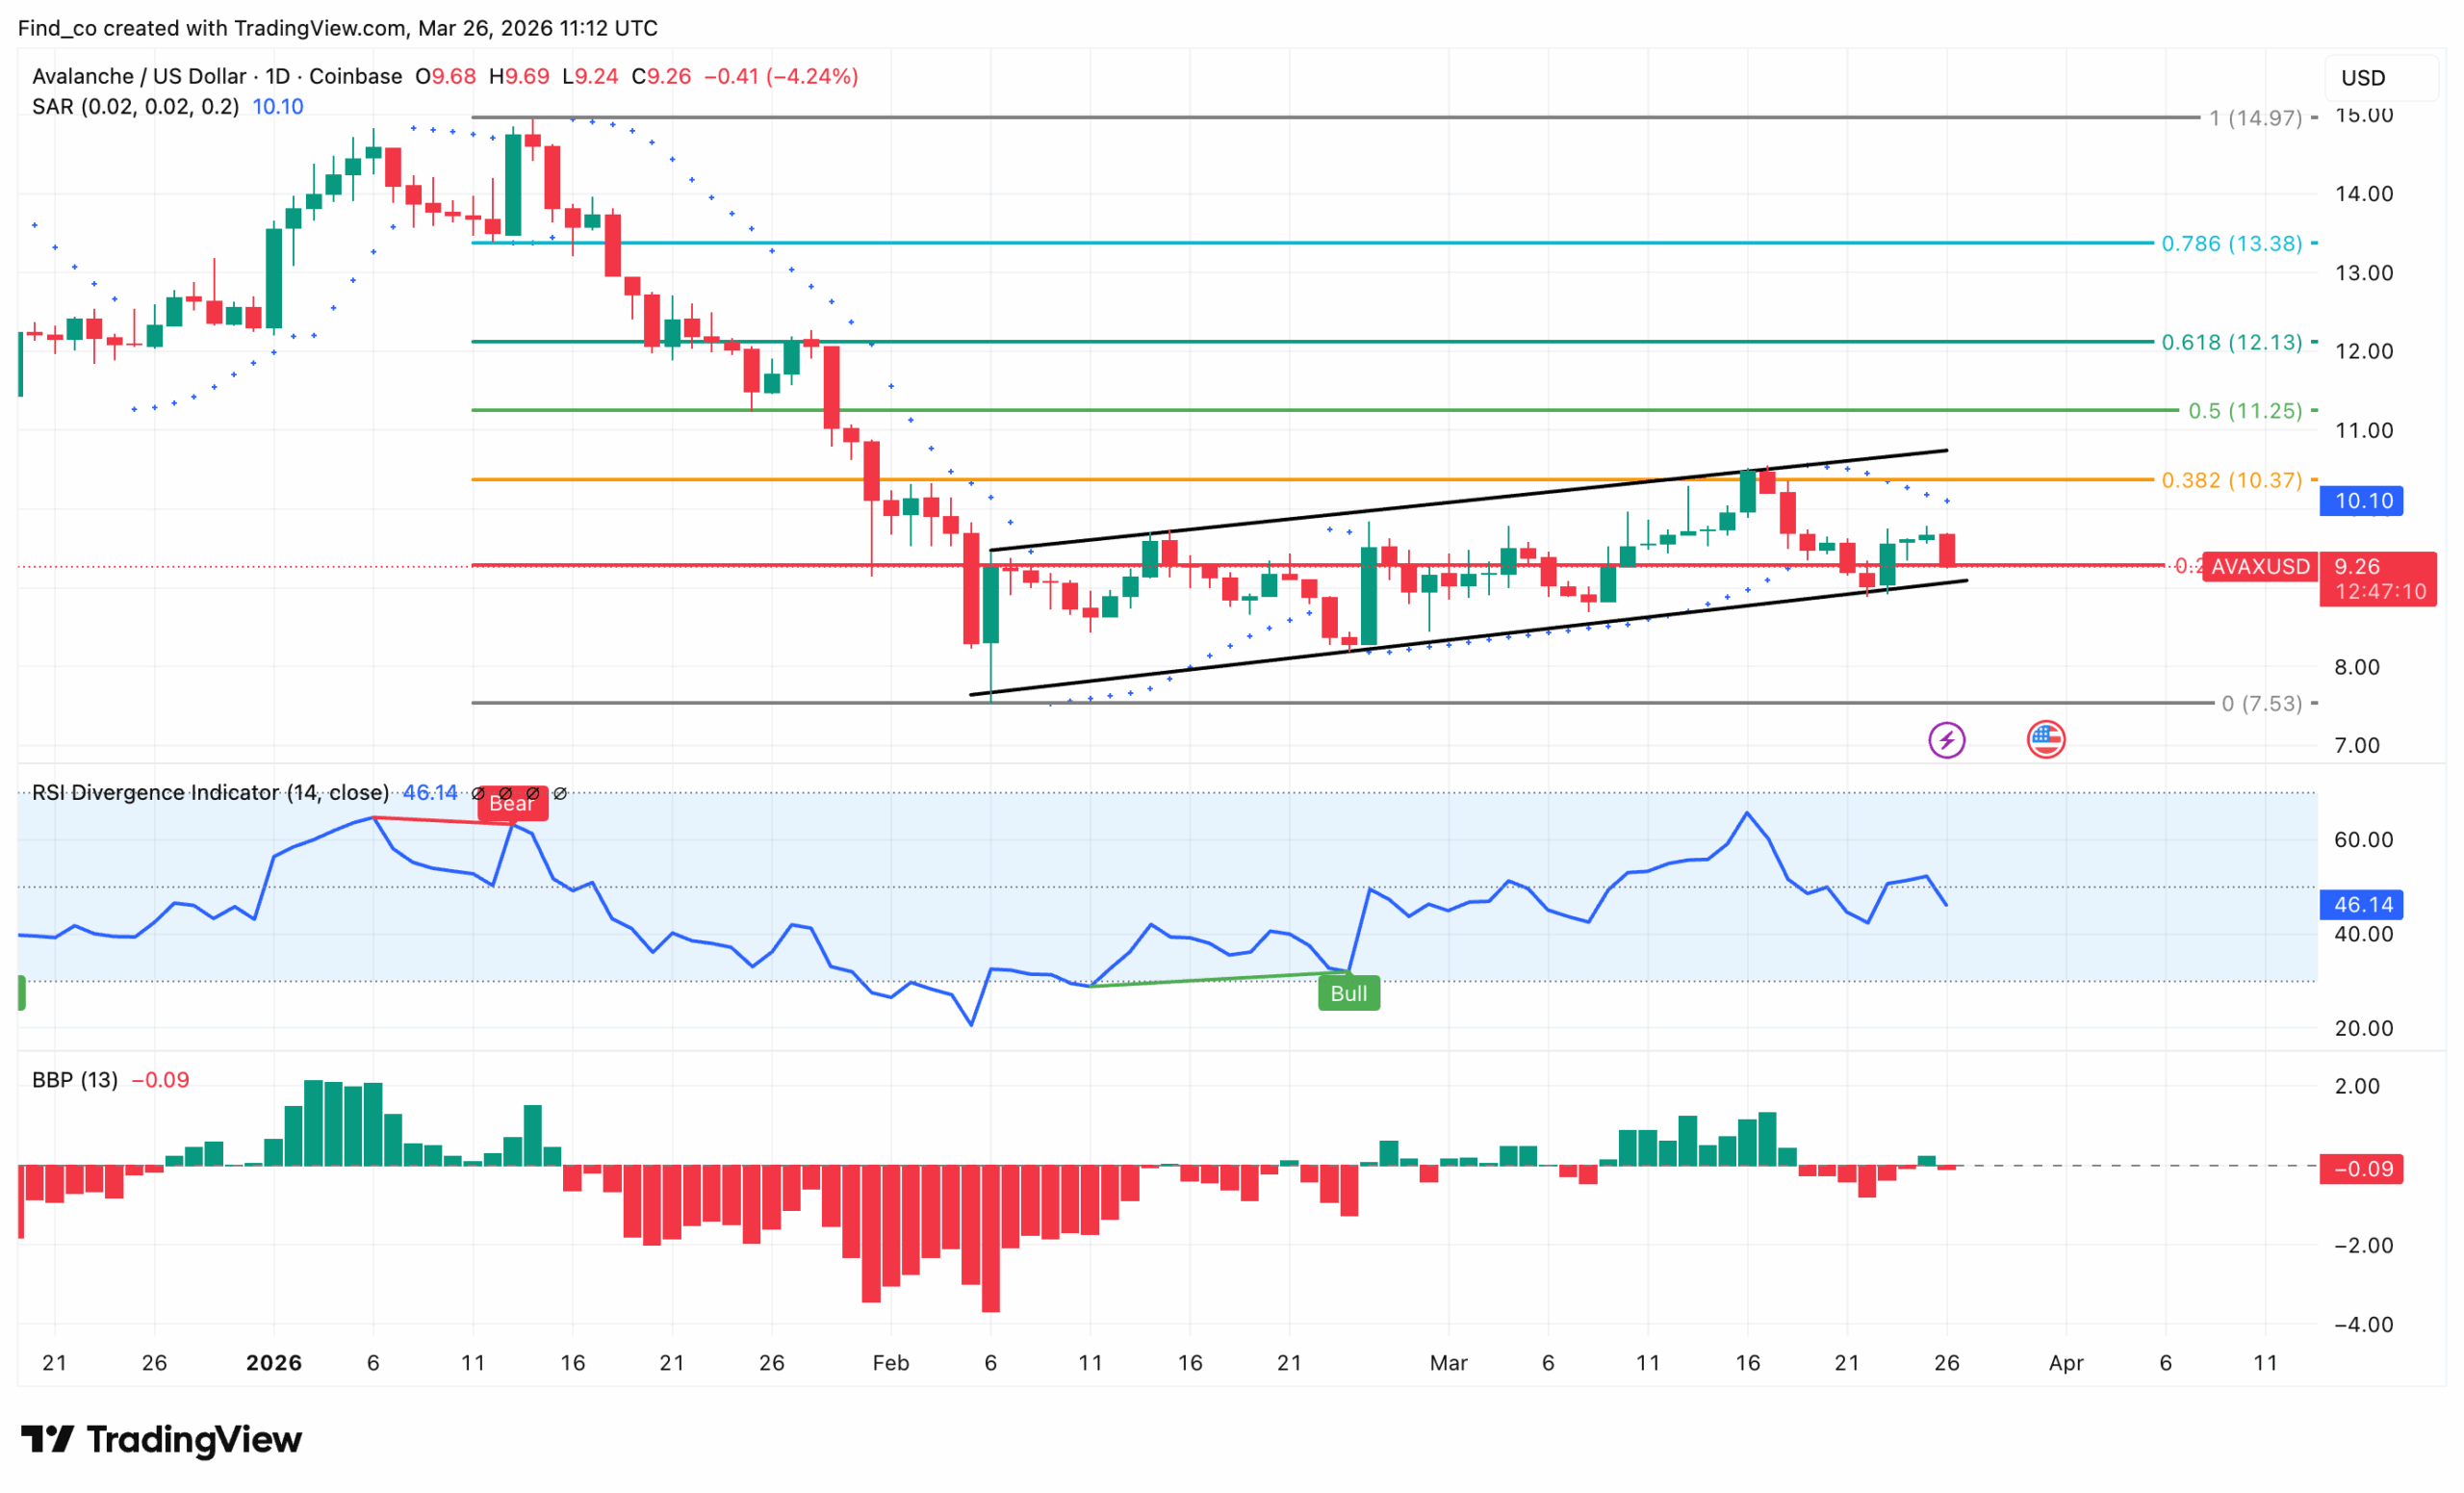
On the daily chart at Coinbase, AVAX dropped 4.24% to $9.26 today.
This happened as it pressed directly against the lower boundary of a rising channel that has defined the recovery since February’s lows.
The structure formed cleanly. After bottoming near $7.53 in early February, AVAX’s price carved out a rising channel, making consistently higher lows throughout the month.
That channel pushed price toward a high near $10.80 by mid-March.
However, the rally stalled beneath the 0.382 Fibonacci level at $10.37. Now, today’s red candle tests the channel’s lower trendline near $9.20.
The Parabolic SAR at $10.10 is above the price, providing bearish confirmation. Therefore, a daily close below $9 would break the channel entirely and expose the $7.53 absolute low.
In the meantime, the RSI generated a bullish divergence signal in early February, which launched the recovery rally.
Now at 46.14 and declining, it hasn’t triggered a fresh divergence yet.
Meanwhile, the Bull Bear Power (BBP) reads -0.09, marginally negative and hovering near the zero line.
Disclaimer:
The information provided in this article is for informational purposes only. It is not intended to be, nor should it be construed as, financial advice. We do not make any warranties regarding the completeness, reliability, or accuracy of this information. All investments involve risk, and past performance does not guarantee future results. We recommend consulting a financial advisor before making any investment decisions.
Victor Olanrewaju is a crypto analyst and reporter at CCN with deep roots in on-chain research and technical analysis. His crypto journey began in 2017, but it was the 2020 Uniswap airdrop that sparked a full-time pivot into the space.
With a foundation in copywriting, Victor honed his craft creating high-converting content for leading crypto brokers — most notably an XRP price prediction that ranked #1 on Google during the 2021 bull run.
He later joined AMBCrypto in 2022, where he combined storytelling with technical and on-chain analysis to cover key market narratives.
In 2024, he expanded his expertise at BeInCrypto, collaborating with analysts and using tools like Glassnode, Santiment, and IntoTheBlock to break down Bitcoin and altcoin trends.
At CCN, Victor covers the top cryptocurrencies, memecoins, macro shifts, blending real-time insights with deep-dive metrics.
He holds a Bachelor’s degree in Physics from the University of Ibadan, equipping him to simplify complex data for a wide audience. Follow his work or connect on LinkedIn or X.