SUI’s price is still locked in a bearish trend, down 82% from its $5.35 peak.
Momentum indicators reinforce the downside bias, with MFI is in the oversold region.
Until SUI reclaims $1.10 and breaks its descending structure, rallies are likely temporary.
SUI is in freefall.
The Layer-1 coin has crashed to $0.90, its lowest level since September 2024. It’s now trading around $0.94, down 82.9% from its all-time high of $5.35.
The collapse has been brutal and relentless.
Over the past 30 days, SUI’s price posted only 8 green days — a 73% bearish hit rate. In February alone, it has dropped 47% with volatility spiking to 21.97% as sellers overwhelmed every bounce attempt.
But here’s the problem: every technical indicator says it’s not done falling yet.
Relief Bounces Fail Again
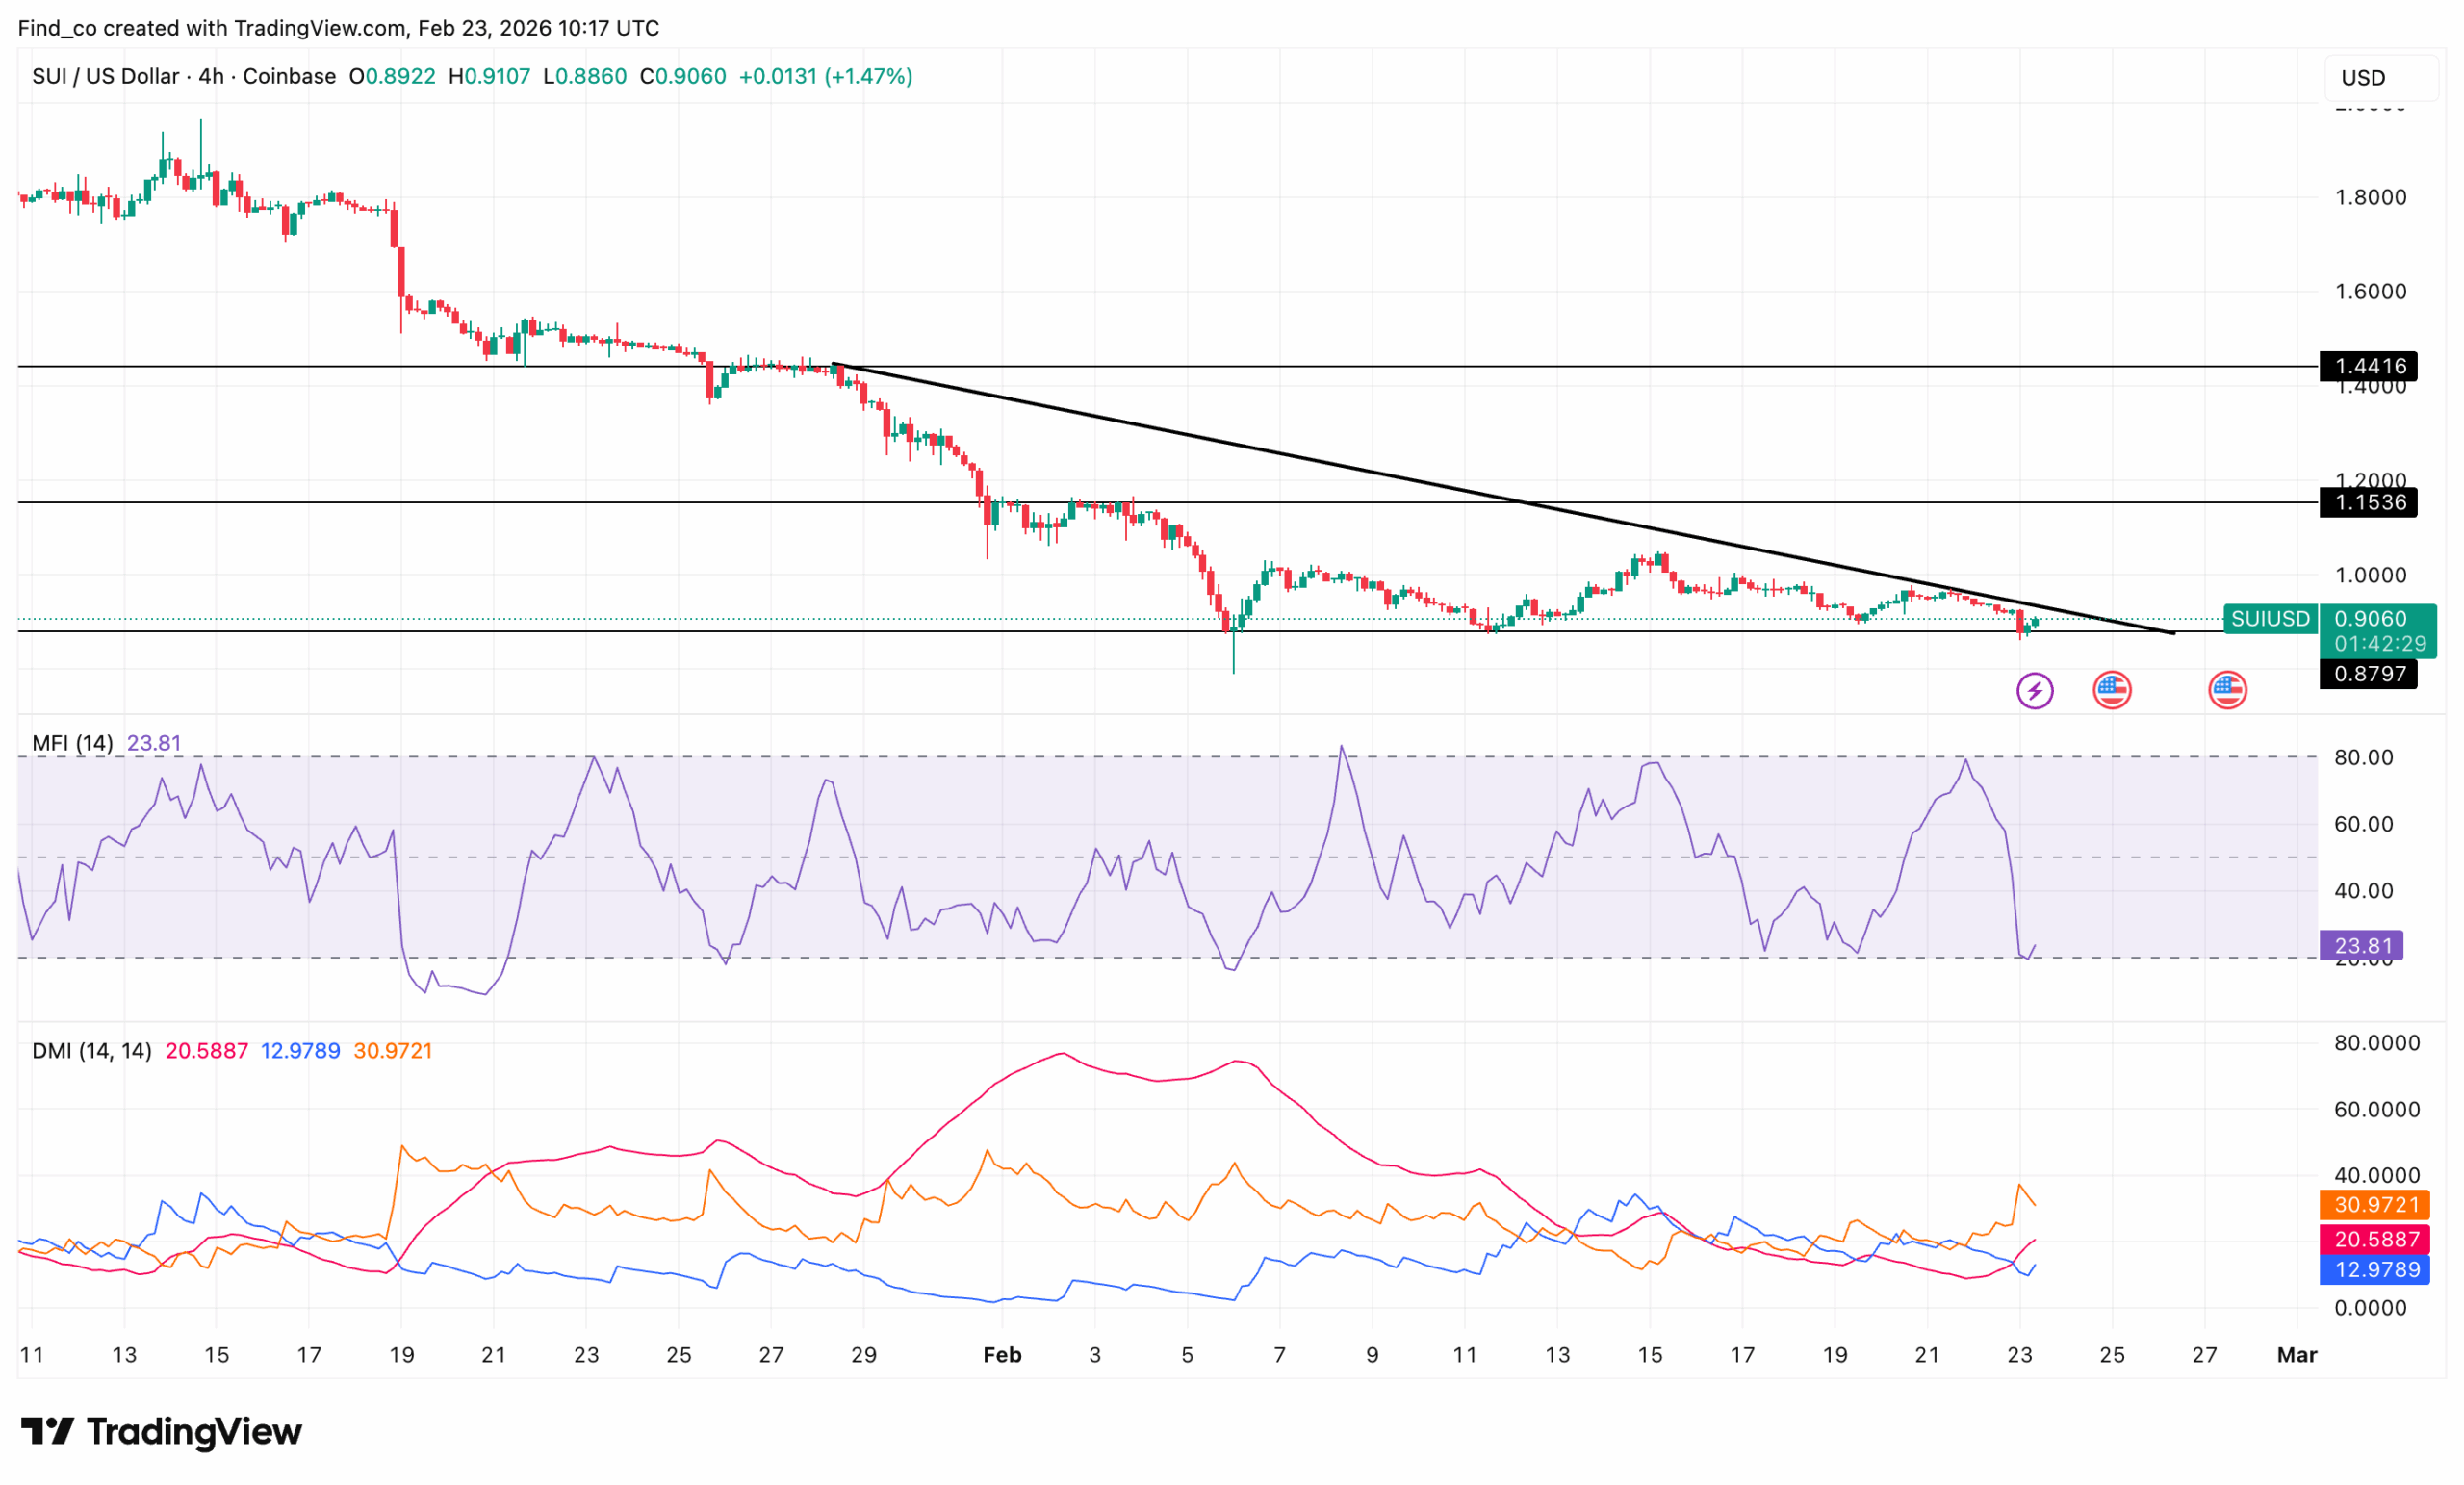
SUI’s price continues to trade under sustained selling pressure, with the 4-hour chart showing a clear lower-high structure that has dominated since mid-January.
Price action remains compressed between roughly $1.15 and $0.82.
Get These Top Crypto Casino Offers Now!
Sponsored
Disclosure
We sometimes use affiliate links in our content, when clicking on those we might receive a commission at no extra cost to you. By using this website you agree to our terms and conditions and privacy policy.
Notably, key momentum indicators reinforce that bias.
The Money Flow Index (MFI) has dropped to about 19.59, capping the asset within the oversold territory. This typically precedes relief bounces. However, oversold readings alone do not confirm reversals.
Instead, they often reflect strong bearish conditions, especially when trend strength remains elevated.
Meanwhile, the Directional Movement Index (DMI) shows the negative DI line well above the positive DI line, while the Average Directional Index (ADX) holds above 30.
That combination confirms a strong, active trend and is bearish. In other words, downward momentum is not just present; it is structurally dominant.
Amid all of this, SUI recently had its Nasdaq debut on Feb. 18.
Despite the positive development, the SUI price has struggled to gain traction. For those unfamiliar, the SUIS ETF provides regulated exposure to the altcoin.
While this might attract substantial institutional capital, it is unlikely to drive SUI’s price higher.
“CanaryFunds has launched SUIS, the first U.S. spot ETF for Sui on Nasdaq. Regulated public market exposure to SUI is here. As Sui scales across stablecoins and global payments, where money moves as freely as messages, Sui expands access for traditional finance,” SUI noted.
SUI Price Forecast: Bears Hold Control
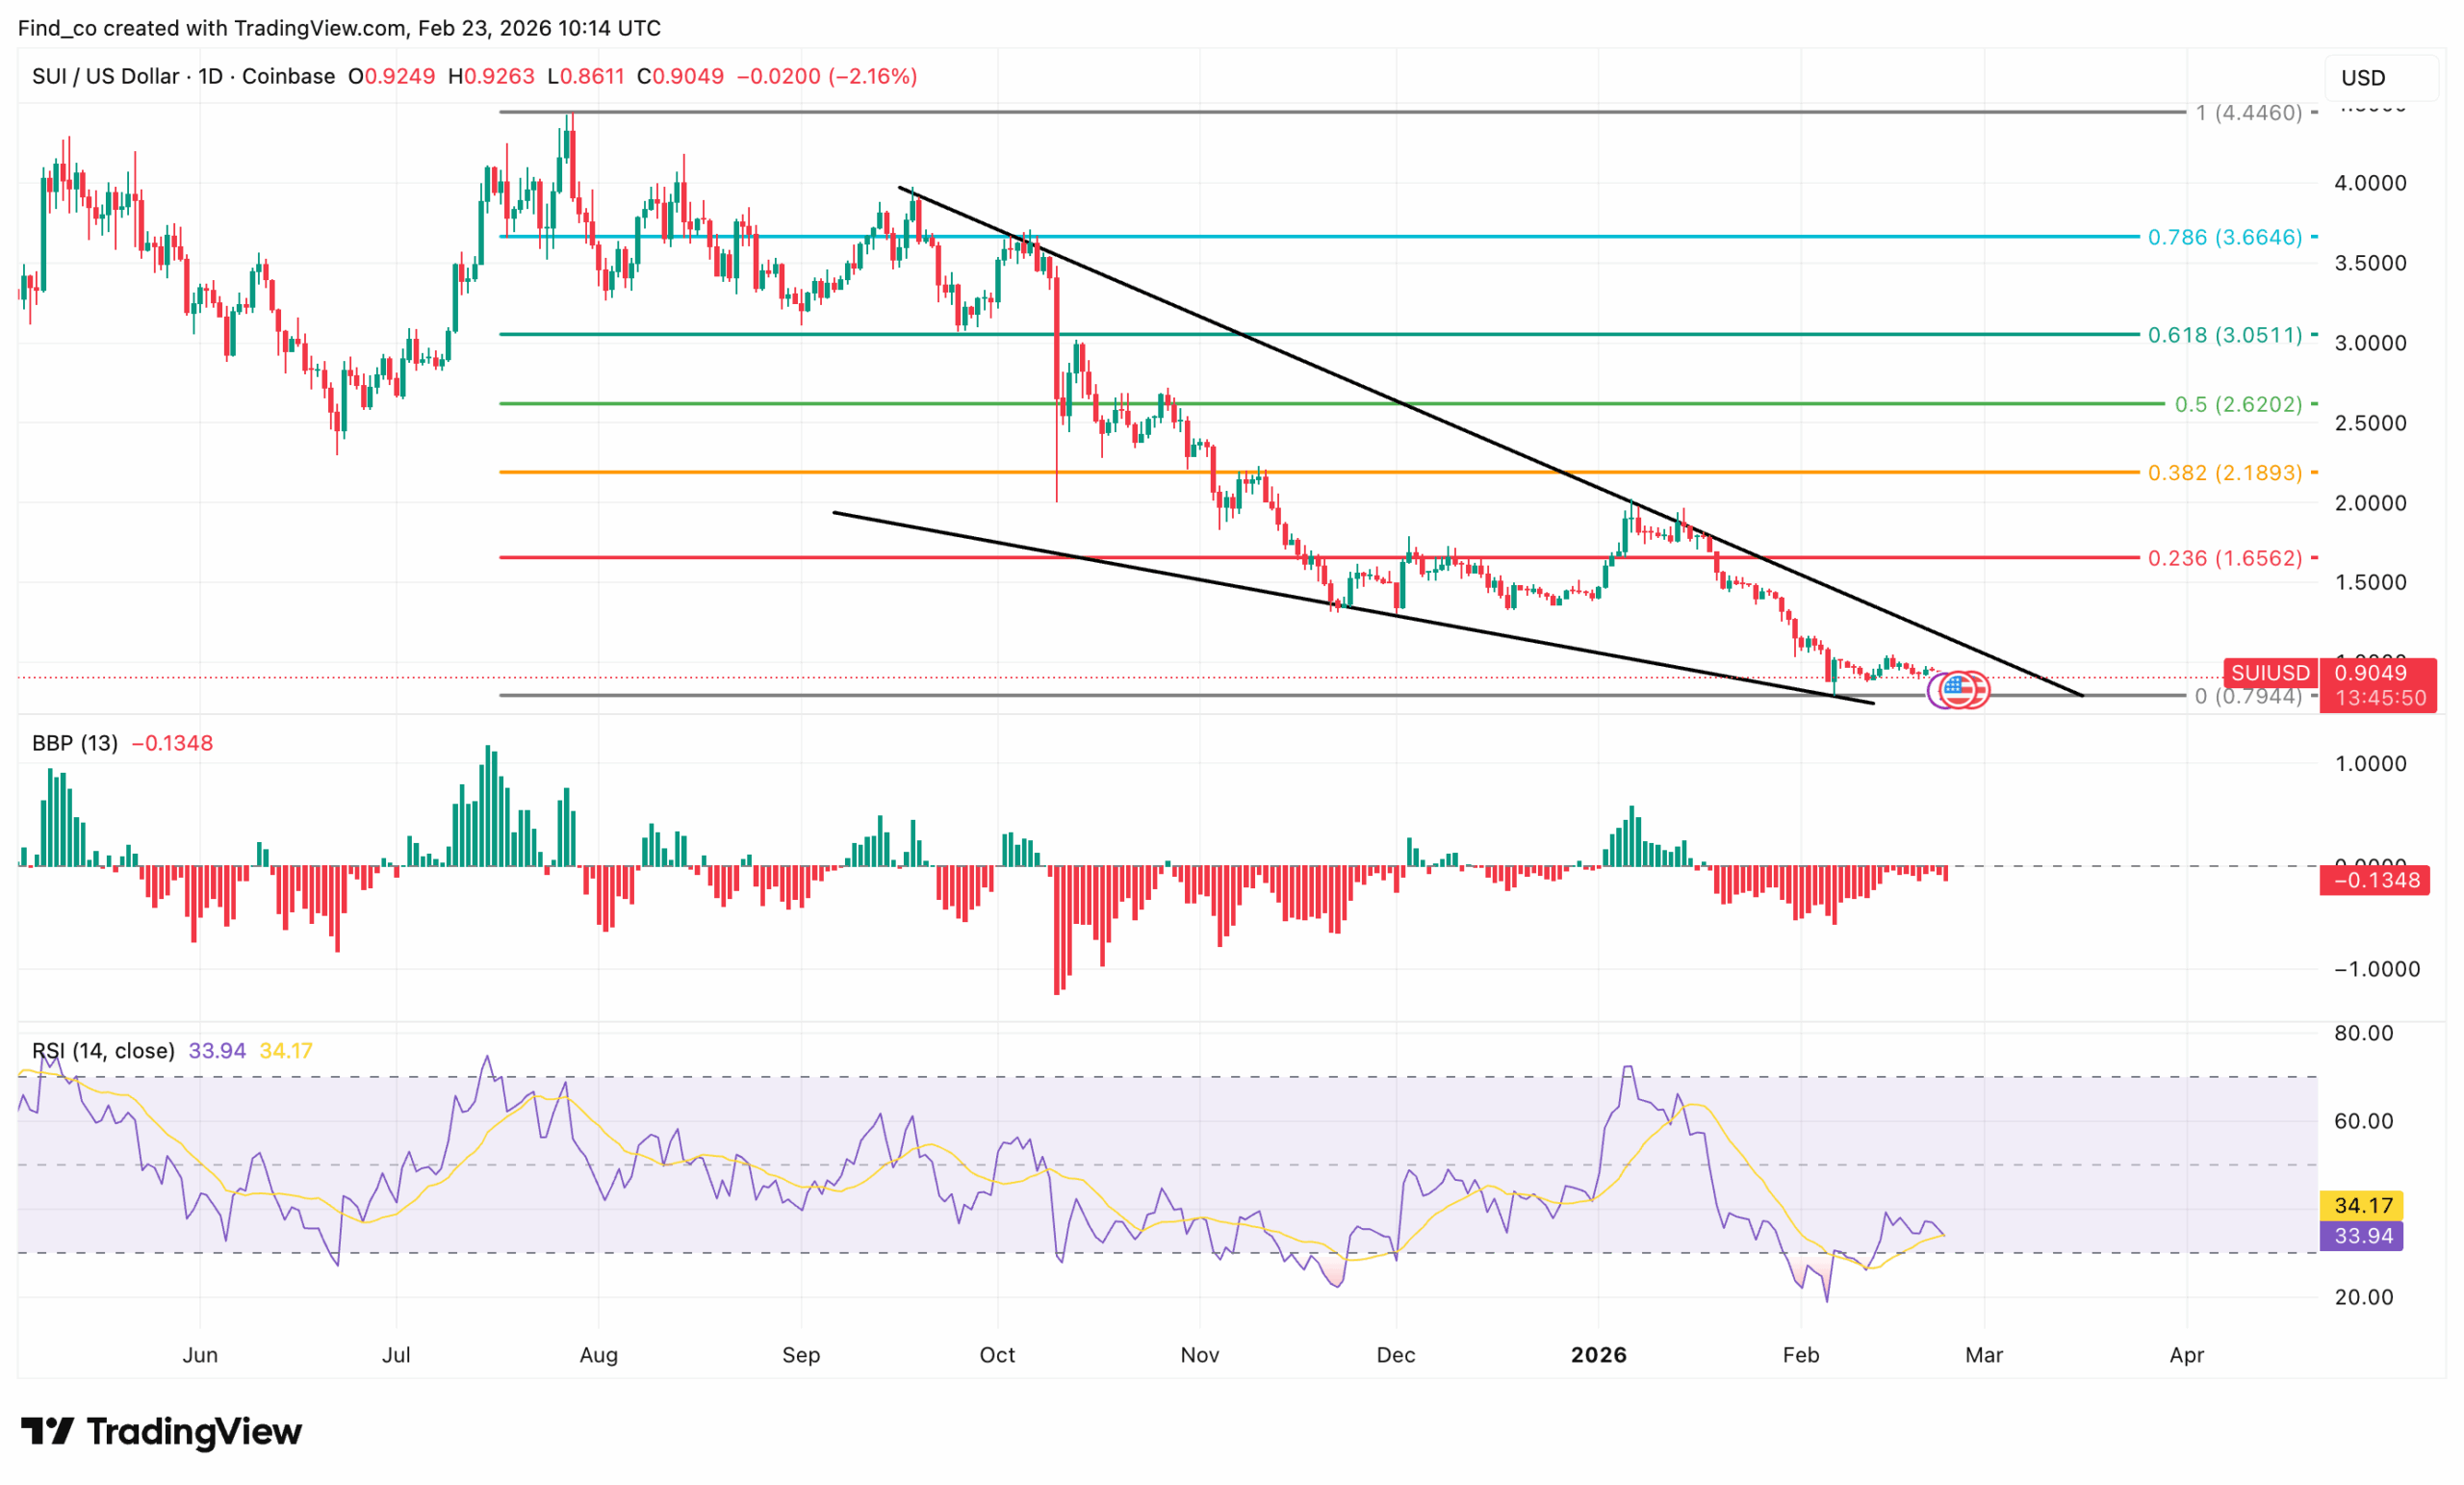
Additionally, on the daily timeframe, SUI’s price remains trapped near $0.89, confined within a descending channel, with each bounce fading before reaching mid-channel resistance.
Previous Fibonacci levels around 0.236 and 0.382 failed to hold as support, reinforcing that sellers control the short-term trend.
The lower channel boundary now converges with horizontal support near $0.86. A break below this zone could open the way to $0.79, which coincides with the zero Fib level.
Currently, momentum favors bears, with the Bull Bear Power (BBP) stuck in negative territory and the relative strength index (RSI) hovering near 33, signaling weakness without extreme oversold conditions.
Disclaimer:
The information provided in this article is for informational purposes only. It is not intended to be, nor should it be construed as, financial advice. We do not make any warranties regarding the completeness, reliability, or accuracy of this information. All investments involve risk, and past performance does not guarantee future results. We recommend consulting a financial advisor before making any investment decisions.
Victor Olanrewaju is a crypto analyst and reporter at CCN with deep roots in on-chain research and technical analysis. His crypto journey began in 2017, but it was the 2020 Uniswap airdrop that sparked a full-time pivot into the space.
With a foundation in copywriting, Victor honed his craft creating high-converting content for leading crypto brokers — most notably an XRP price prediction that ranked #1 on Google during the 2021 bull run.
He later joined AMBCrypto in 2022, where he combined storytelling with technical and on-chain analysis to cover key market narratives.
In 2024, he expanded his expertise at BeInCrypto, collaborating with analysts and using tools like Glassnode, Santiment, and IntoTheBlock to break down Bitcoin and altcoin trends.
At CCN, Victor covers the top cryptocurrencies, memecoins, macro shifts, blending real-time insights with deep-dive metrics.
He holds a Bachelor’s degree in Physics from the University of Ibadan, equipping him to simplify complex data for a wide audience. Follow his work or connect on LinkedIn or X.