SUI breaks its symmetrical triangle, surging 37% | Credit: Hameem Sarwar
Share
Key Takeaways
SUI’s price broke out of a symmetrical triangle and reclaimed trend support.
The next resistance steps before $3 are between the $2.04 and the $2.20 levels.
SUI remains bullish, but it is overbought, and exchange inflows signal a pullback.
SUI has staged a breakout, surging more than 37% over the past seven days to hit a two-month high as bullish momentum strengthens across the broader market.
After weeks of subdued price action, this rally signals a clear shift in market structure, with buyers regaining control and driving SUI back into a well-defined uptrend.
As a result, bullish sentiment has returned sharply, placing the $3 psychological resistance back at the center of market attention.
Momentum indicators, trading volume, and on-chain data are now aligning, increasing the probability of further upside in the near term.
With that in mind, which resistance levels stand in the way before SUI reaches $3?
SUI Sustains Upward Momentum
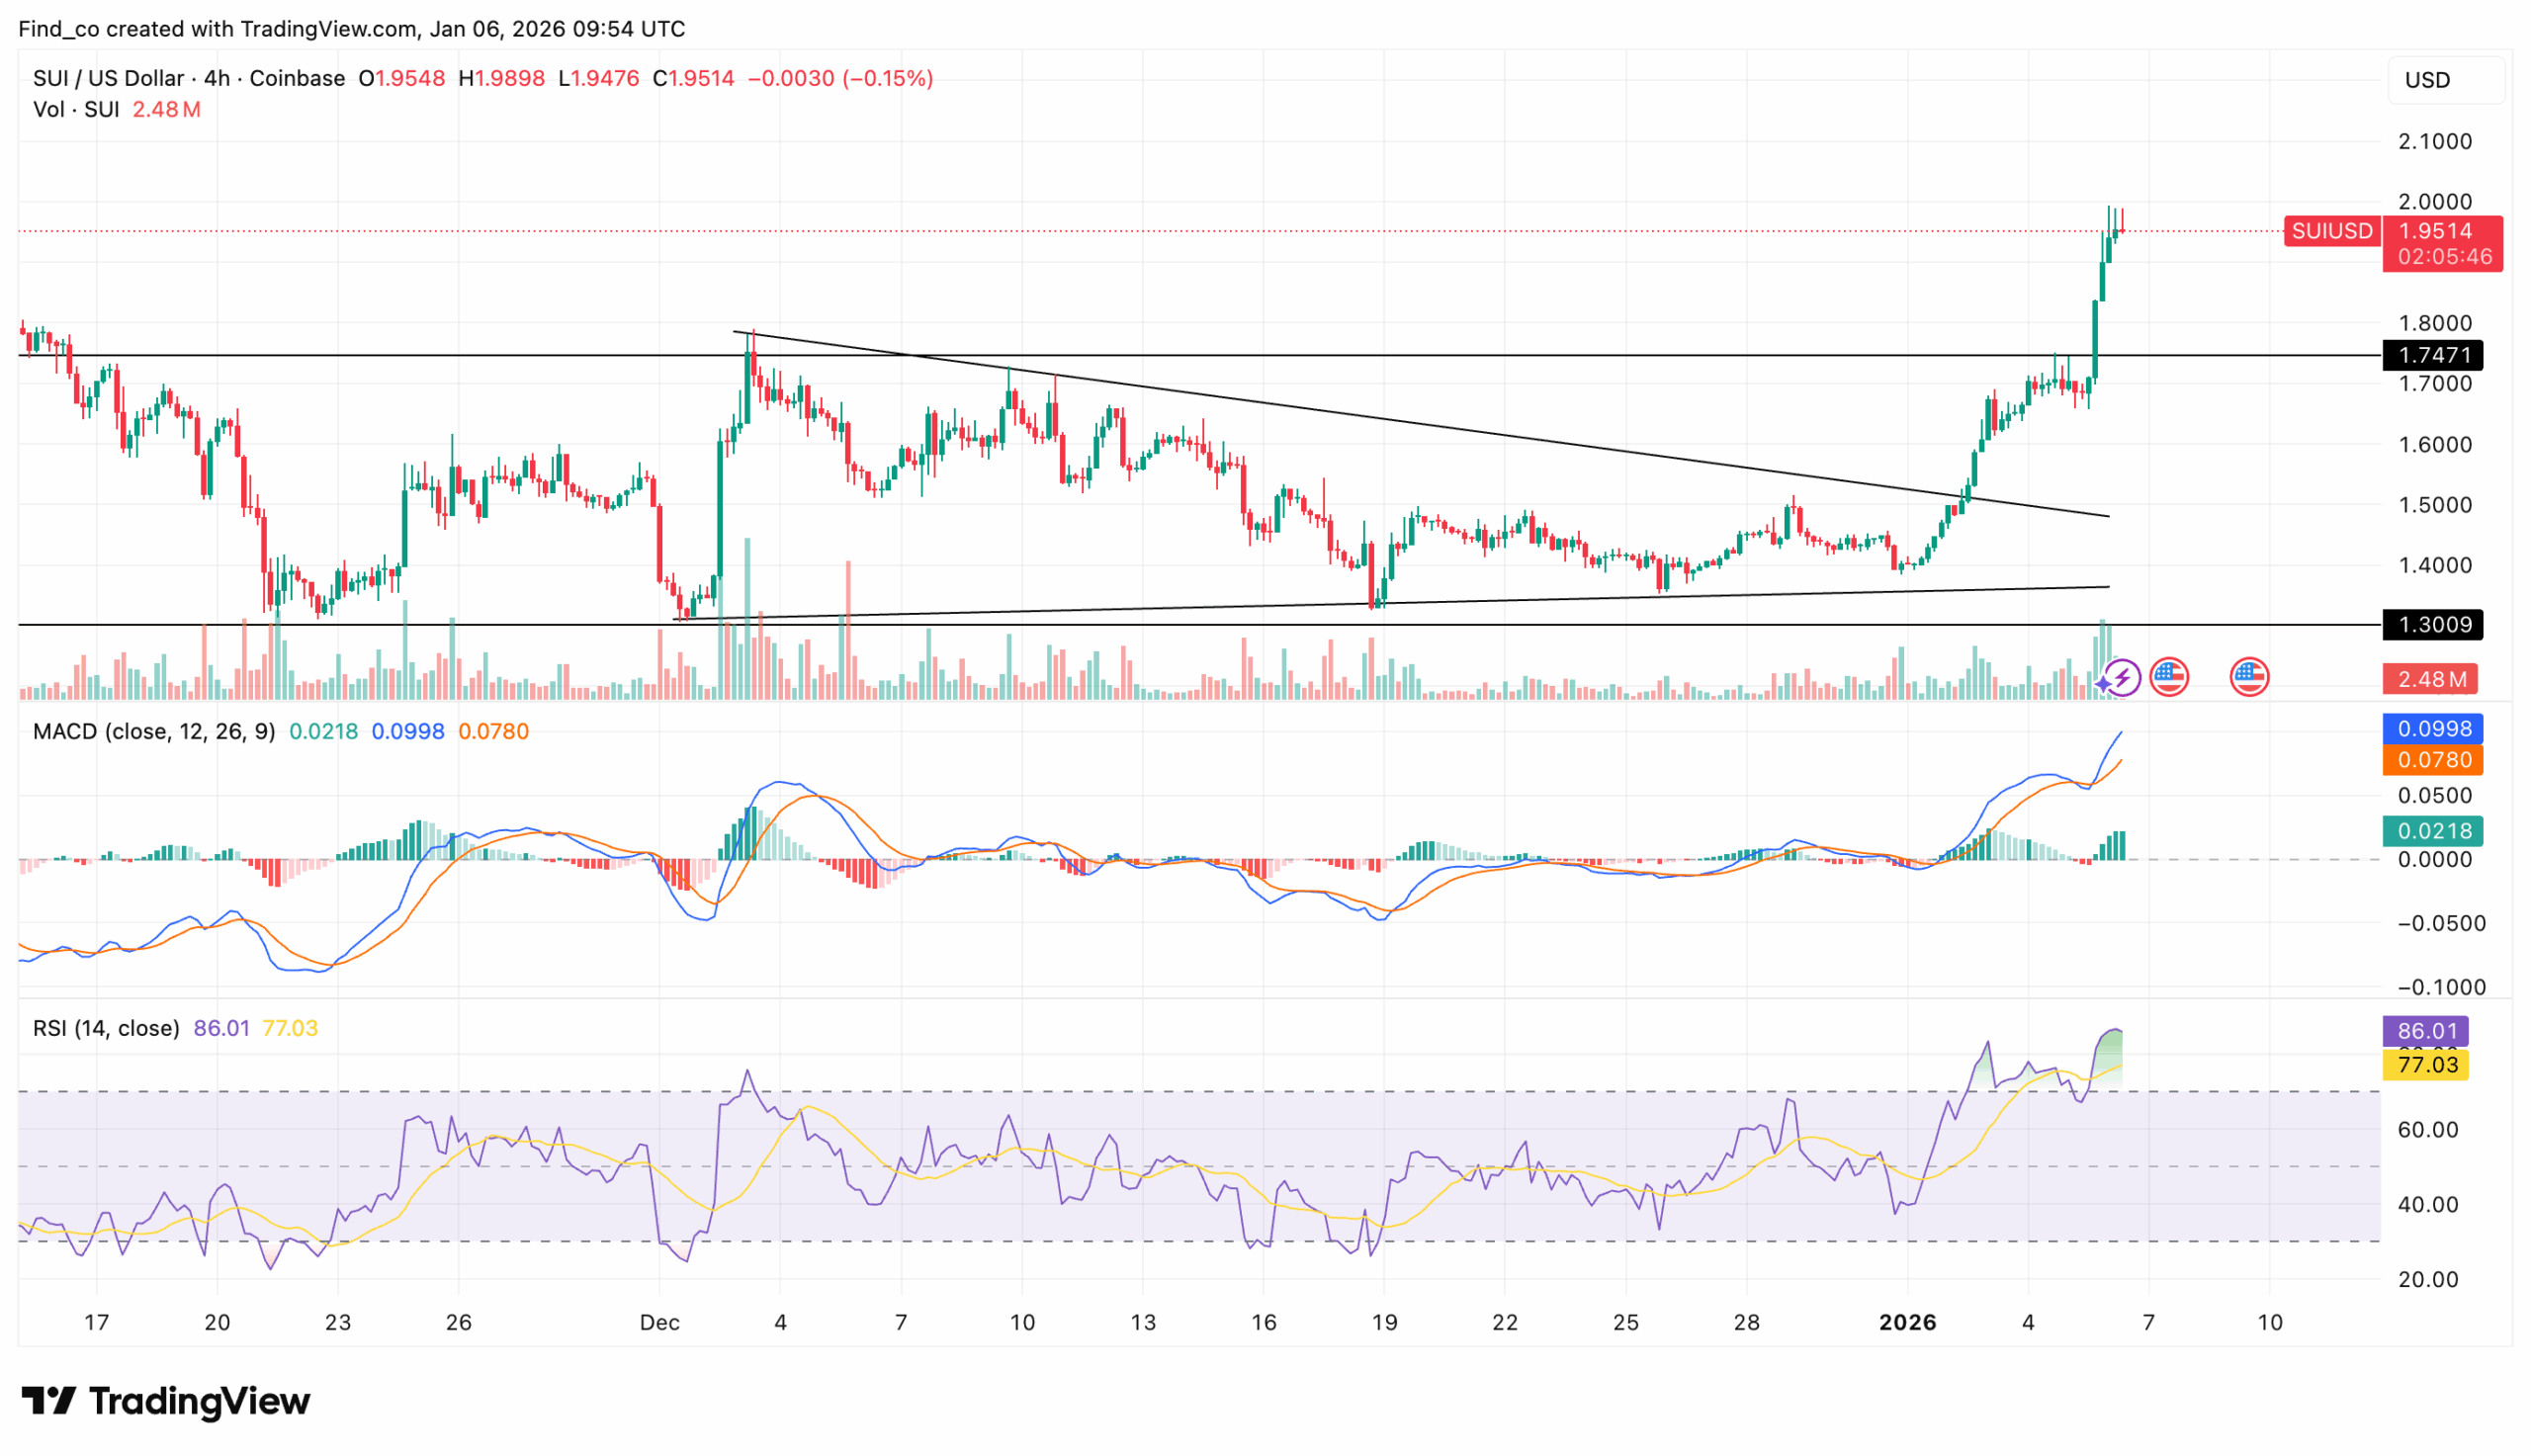
SUI’s price climbed this high after breaking out of a symmetrical triangle. As a result, momentum indicators have continued to validate the ongoing rally.
On the 4-hour timeframe, the Moving Average Convergence/Divergence (MACD) indicates a strong bullish continuation.
Get These Top Crypto Casino Offers Now!
Sponsored
Disclosure
We sometimes use affiliate links in our content, when clicking on those we might receive a commission at no extra cost to you. By using this website you agree to our terms and conditions and privacy policy.
The 12-day EMA remains firmly above the 26-day EMA, while the histogram expands further into positive territory. This setup confirms growing upside strength rather than a temporary rebound.
At the same time, the Relative Strength Index (RSI) has climbed to 87.09, deep in overbought territory.
Although such readings often signal caution, they typically reflect sustained buyer dominance during intense trending phases. The RSI holding well above the 70 level reinforces the view that bulls remain in control of price action.
From a structural standpoint, SUI has broken above a rising channel formed in late December, successfully turning the former $1.70 to $1.75 resistance zone into support.
As long as SUI’s price remains above this area, the broader bullish structure stays intact.
Meanwhile, immediate resistance sits near the psychological $2.20 level.
A break and daily close above this zone could accelerate momentum toward the $2.80 to $3.00 resistance range, which previously capped the upside.
Traders Position for Profits
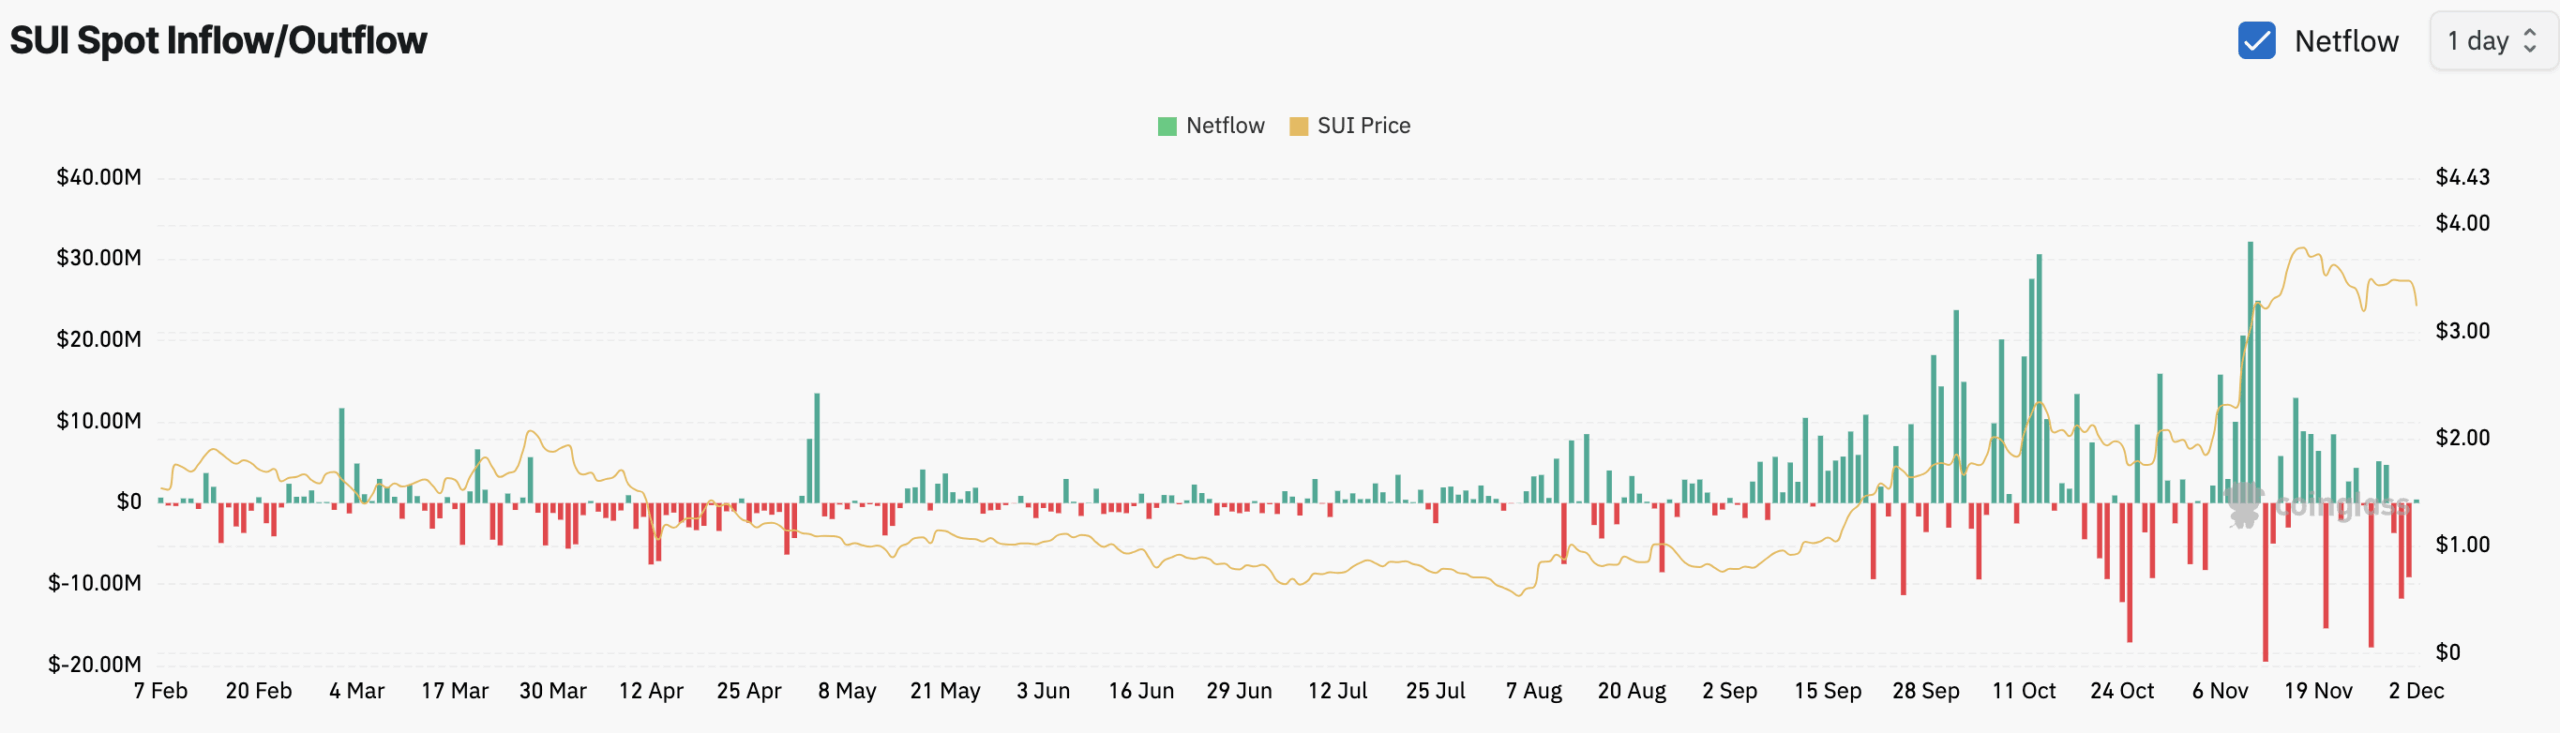
On-chain data paints a more cautious short-term picture. Spot inflows currently outweigh outflows, indicating that more SUI tokens are moving onto exchanges rather than off them.
This shift suggests rising sell-side readiness as traders position liquidity on centralized platforms.
Although this development does not invalidate the broader bullish trend, it introduces near-term risk.
Elevated spot inflows often precede profit-taking or consolidation phases, particularly after sharp rallies.
If inflows continue to dominate without a matching increase in buy-side demand, SUI’s price could experience temporary downside pressure or range-bound movement before attempting another breakout.
SUI Price Prediction: Bullish
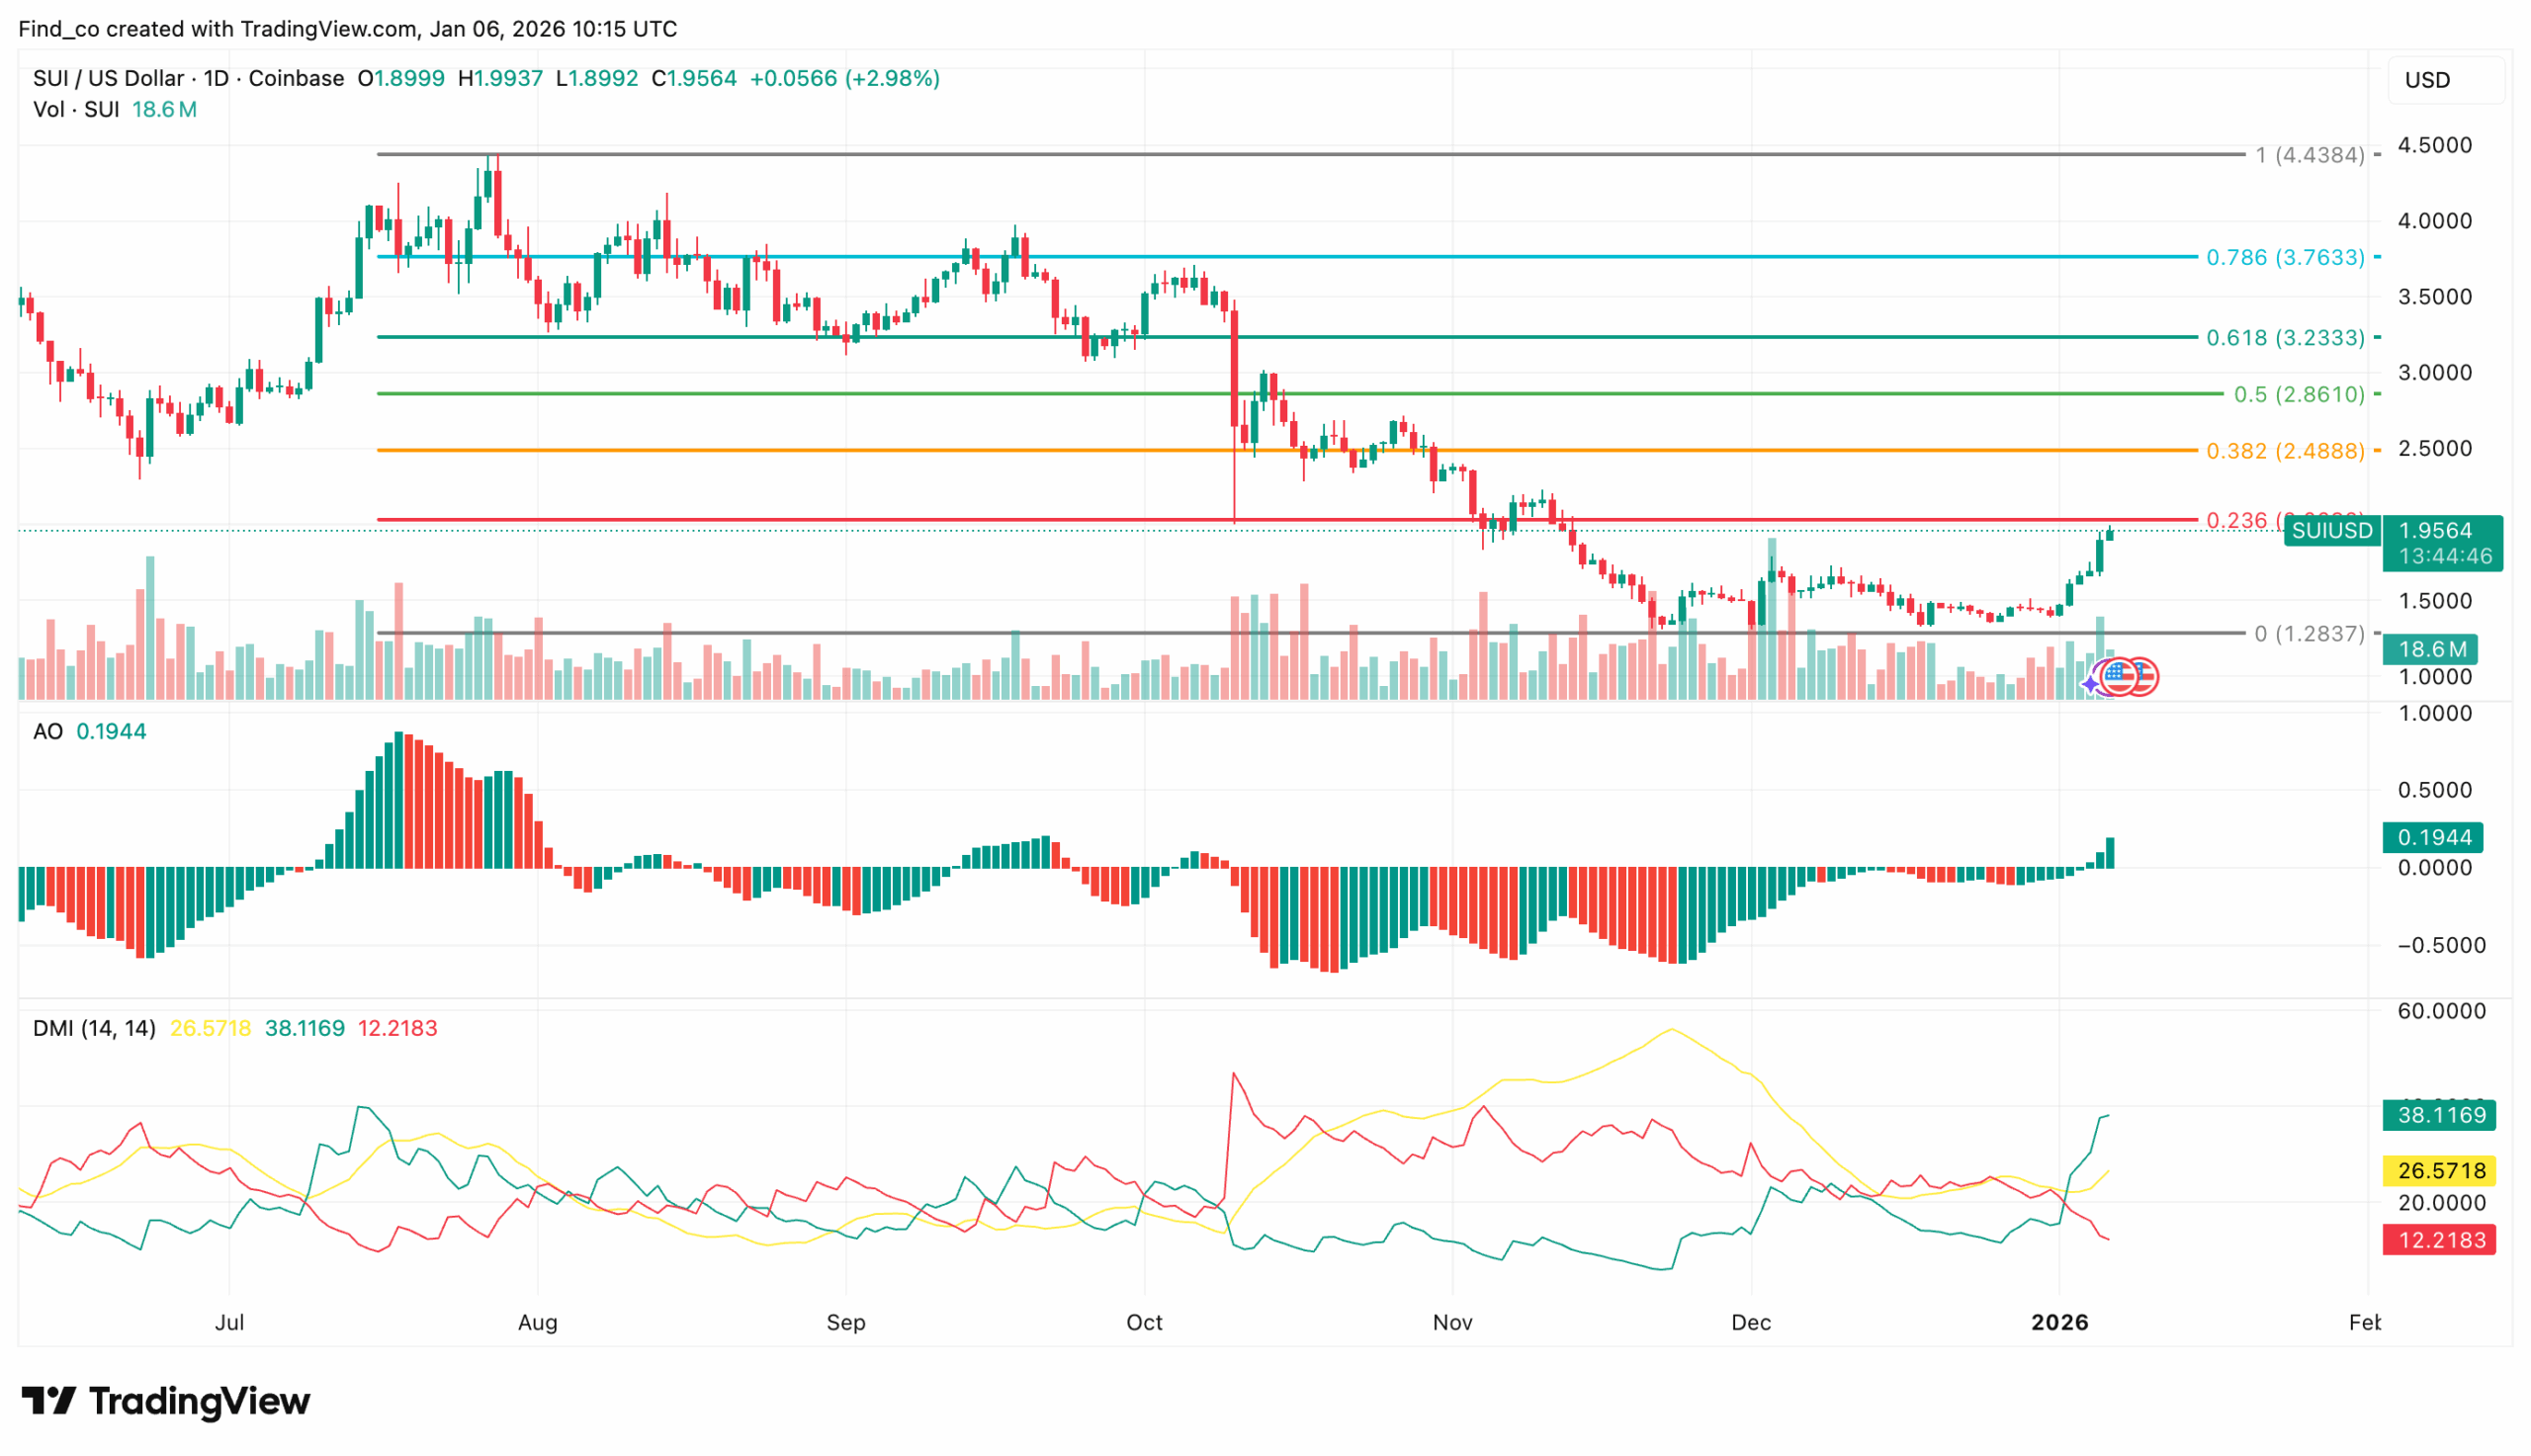
On the daily chart, SUI has printed multiple consecutive green candles and continues to trade within an ascending channel.
The Awesome Oscillator (AO) confirms this momentum shift.
After spending weeks below the zero line, the AO has crossed into positive territory, indicating that buyers are now firmly in control of market conditions.
Further supporting this outlook, the Directional Movement Index (DMI) highlights strong trend strength.
The positive +DMI stands at 38.12, significantly above the negative -DMI at 12.22, confirming a clear bullish directional bias.
In addition, the Average Directional Index (ADX) has risen to 26.57, indicating that the uptrend is strengthening and likely to persist as long as SUI remains within the ascending channel.
Fibonacci retracement levels provide additional insight into potential price targets.
At the time of writing, SUI trades around $1.96 and approaches its near-term resistance at $2.04, which aligns with the 0.236 Fib level.
Disclaimer:
The information provided in this article is for informational purposes only. It is not intended to be, nor should it be construed as, financial advice. We do not make any warranties regarding the completeness, reliability, or accuracy of this information. All investments involve risk, and past performance does not guarantee future results. We recommend consulting a financial advisor before making any investment decisions.
Victor Olanrewaju is a crypto analyst and reporter at CCN with deep roots in on-chain research and technical analysis. His crypto journey began in 2017, but it was the 2020 Uniswap airdrop that sparked a full-time pivot into the space.
With a foundation in copywriting, Victor honed his craft creating high-converting content for leading crypto brokers — most notably an XRP price prediction that ranked #1 on Google during the 2021 bull run.
He later joined AMBCrypto in 2022, where he combined storytelling with technical and on-chain analysis to cover key market narratives.
In 2024, he expanded his expertise at BeInCrypto, collaborating with analysts and using tools like Glassnode, Santiment, and IntoTheBlock to break down Bitcoin and altcoin trends.
At CCN, Victor covers the top cryptocurrencies, memecoins, macro shifts, blending real-time insights with deep-dive metrics.
He holds a Bachelor’s degree in Physics from the University of Ibadan, equipping him to simplify complex data for a wide audience. Follow his work or connect on LinkedIn or X.