Data shows SUI's price will likely experience high volatility | Credit: Hameem Sarwar
Share
Key Takeaways
SUI’s price has gained about 10% after breaking out of a downtrend, signaling rising buying pressure.
Anticipation of the CME futures launch supports the outlook, though past listings suggest volatility is likely.
If SUI’s price breaks above $1.08, it could rally further; however, bears could pull it back.
Like several altcoins, SUI’s price has increased in the last 24 hours.
Within that period, the altcoin has risen about 10%, signaling increasing buying pressure.
The move comes ahead of the planned CME futures launch on May 4, which is expected to bring institutional interest.
While the setup supports further upside, the rally may face volatility as the event approaches. Here is why and what could be next for the SUI crypto.
Sui Leaves Bearish Phase
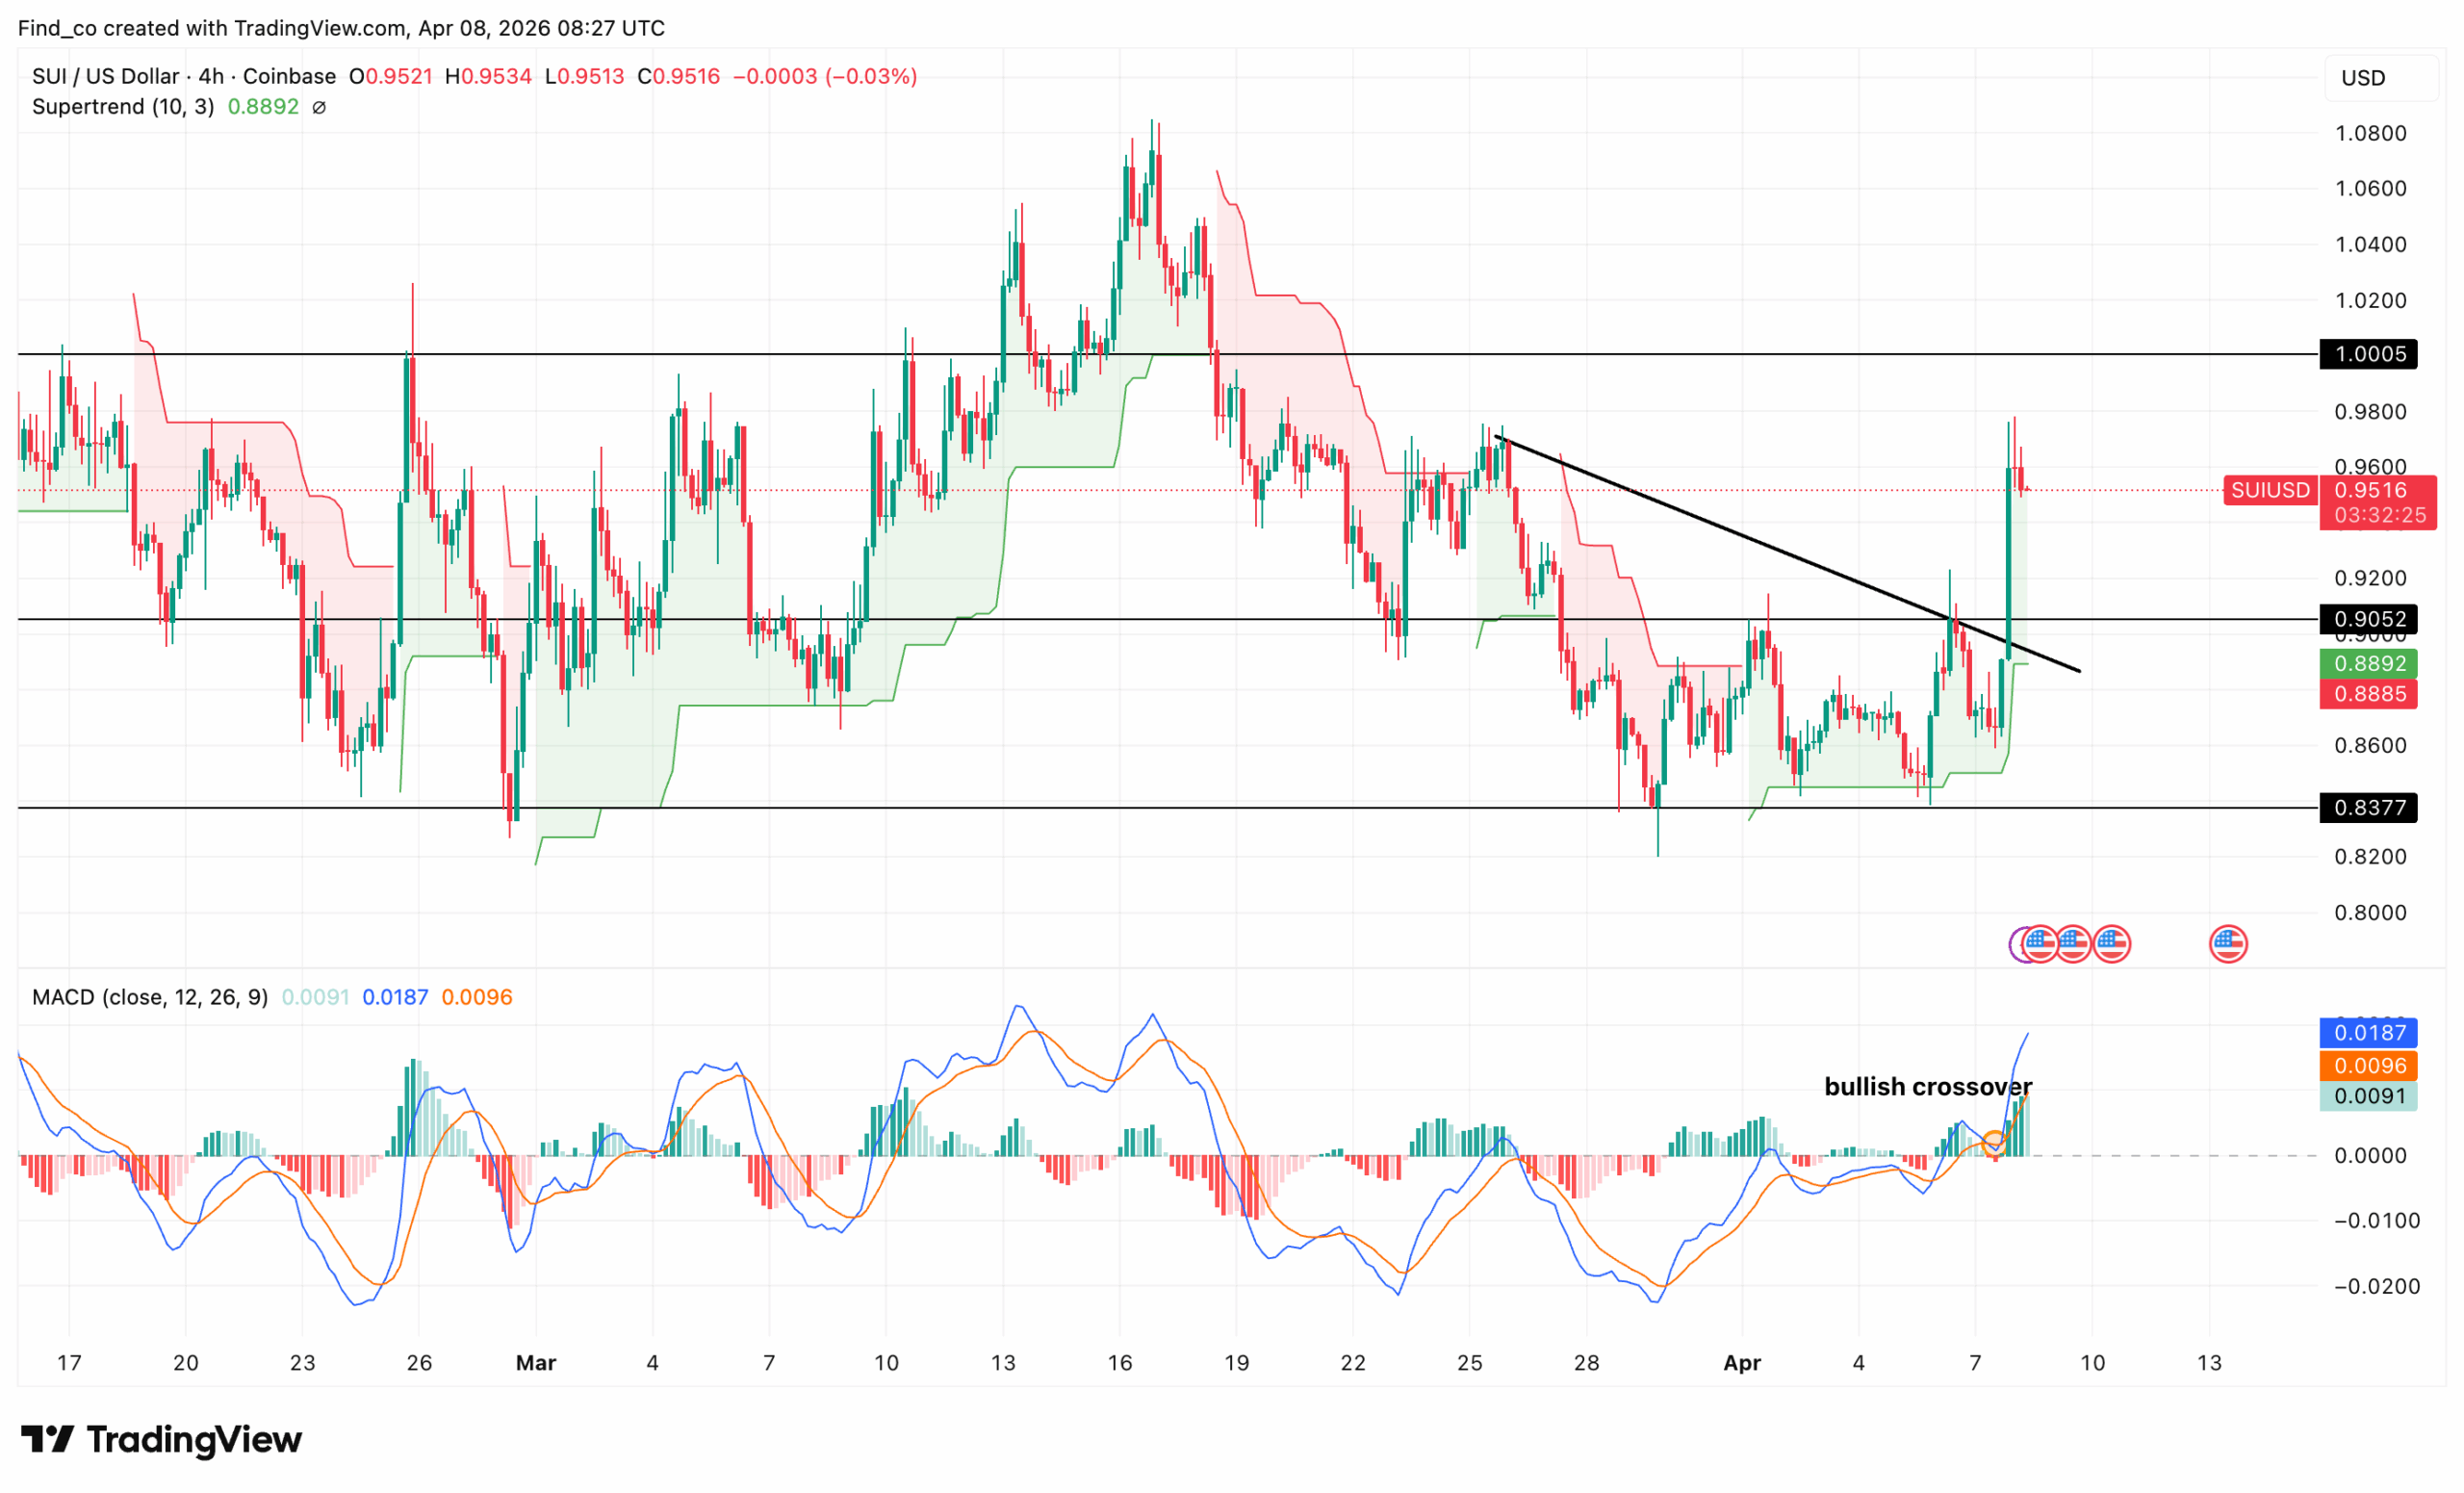
At the time of writing, SUI is showing early signs of a bullish reversal after breaking out of a short-term downtrend.
On the 4-hour chart, the price has been forming lower highs under a descending trendline.
However, the latest move shows a clear breakout above this trendline, pushing the SUI crypto price back toward the $0.96 resistance zone.
Besides that, momentum is also improving. The MACD has printed a bullish crossover, with histogram bars turning positive.
This suggests that buying pressure is building and could support further upside if sustained.
In addition, the Supertrend indicator has flipped bullish, with the altcoin now trading above it. This reinforces the shift in the short-term trend and signals that buyers are regaining control.
Looking ahead, the key level to watch is the $0.96–$1.00 region. A break above this zone would confirm the reversal and open the door toward higher levels.
In that case, the SUI crypto price could move toward $1.05 and potentially $1.10.
However, if SUI fails to hold above $0.90, the breakout could lose strength. But that seems unlikely unless bears take control.
May Event Could Change Things
As mentioned earlier, the planned launch of CME futures on May 4 is also drawing attention to SUI. This event is significant because it introduces institutional access to SUI through a regulated platform.
Historically, such developments tend to influence market behavior. Traders often position themselves ahead of major listings.
This can create upward pressure in the short term as anticipation builds. At the same time, not all CME futures listed drive higher prices.
For instance, the last one involving Cardano (ADA) and Chainlink (LINK) did not produce such results.
Ahead of the February launch, LINK and ADA traded sideways, with no meaningful gains. Afterward, their respective prices crashed.
While that does not mean the SUI crypto will face the same fate, the anticipated upswing is not guaranteed.
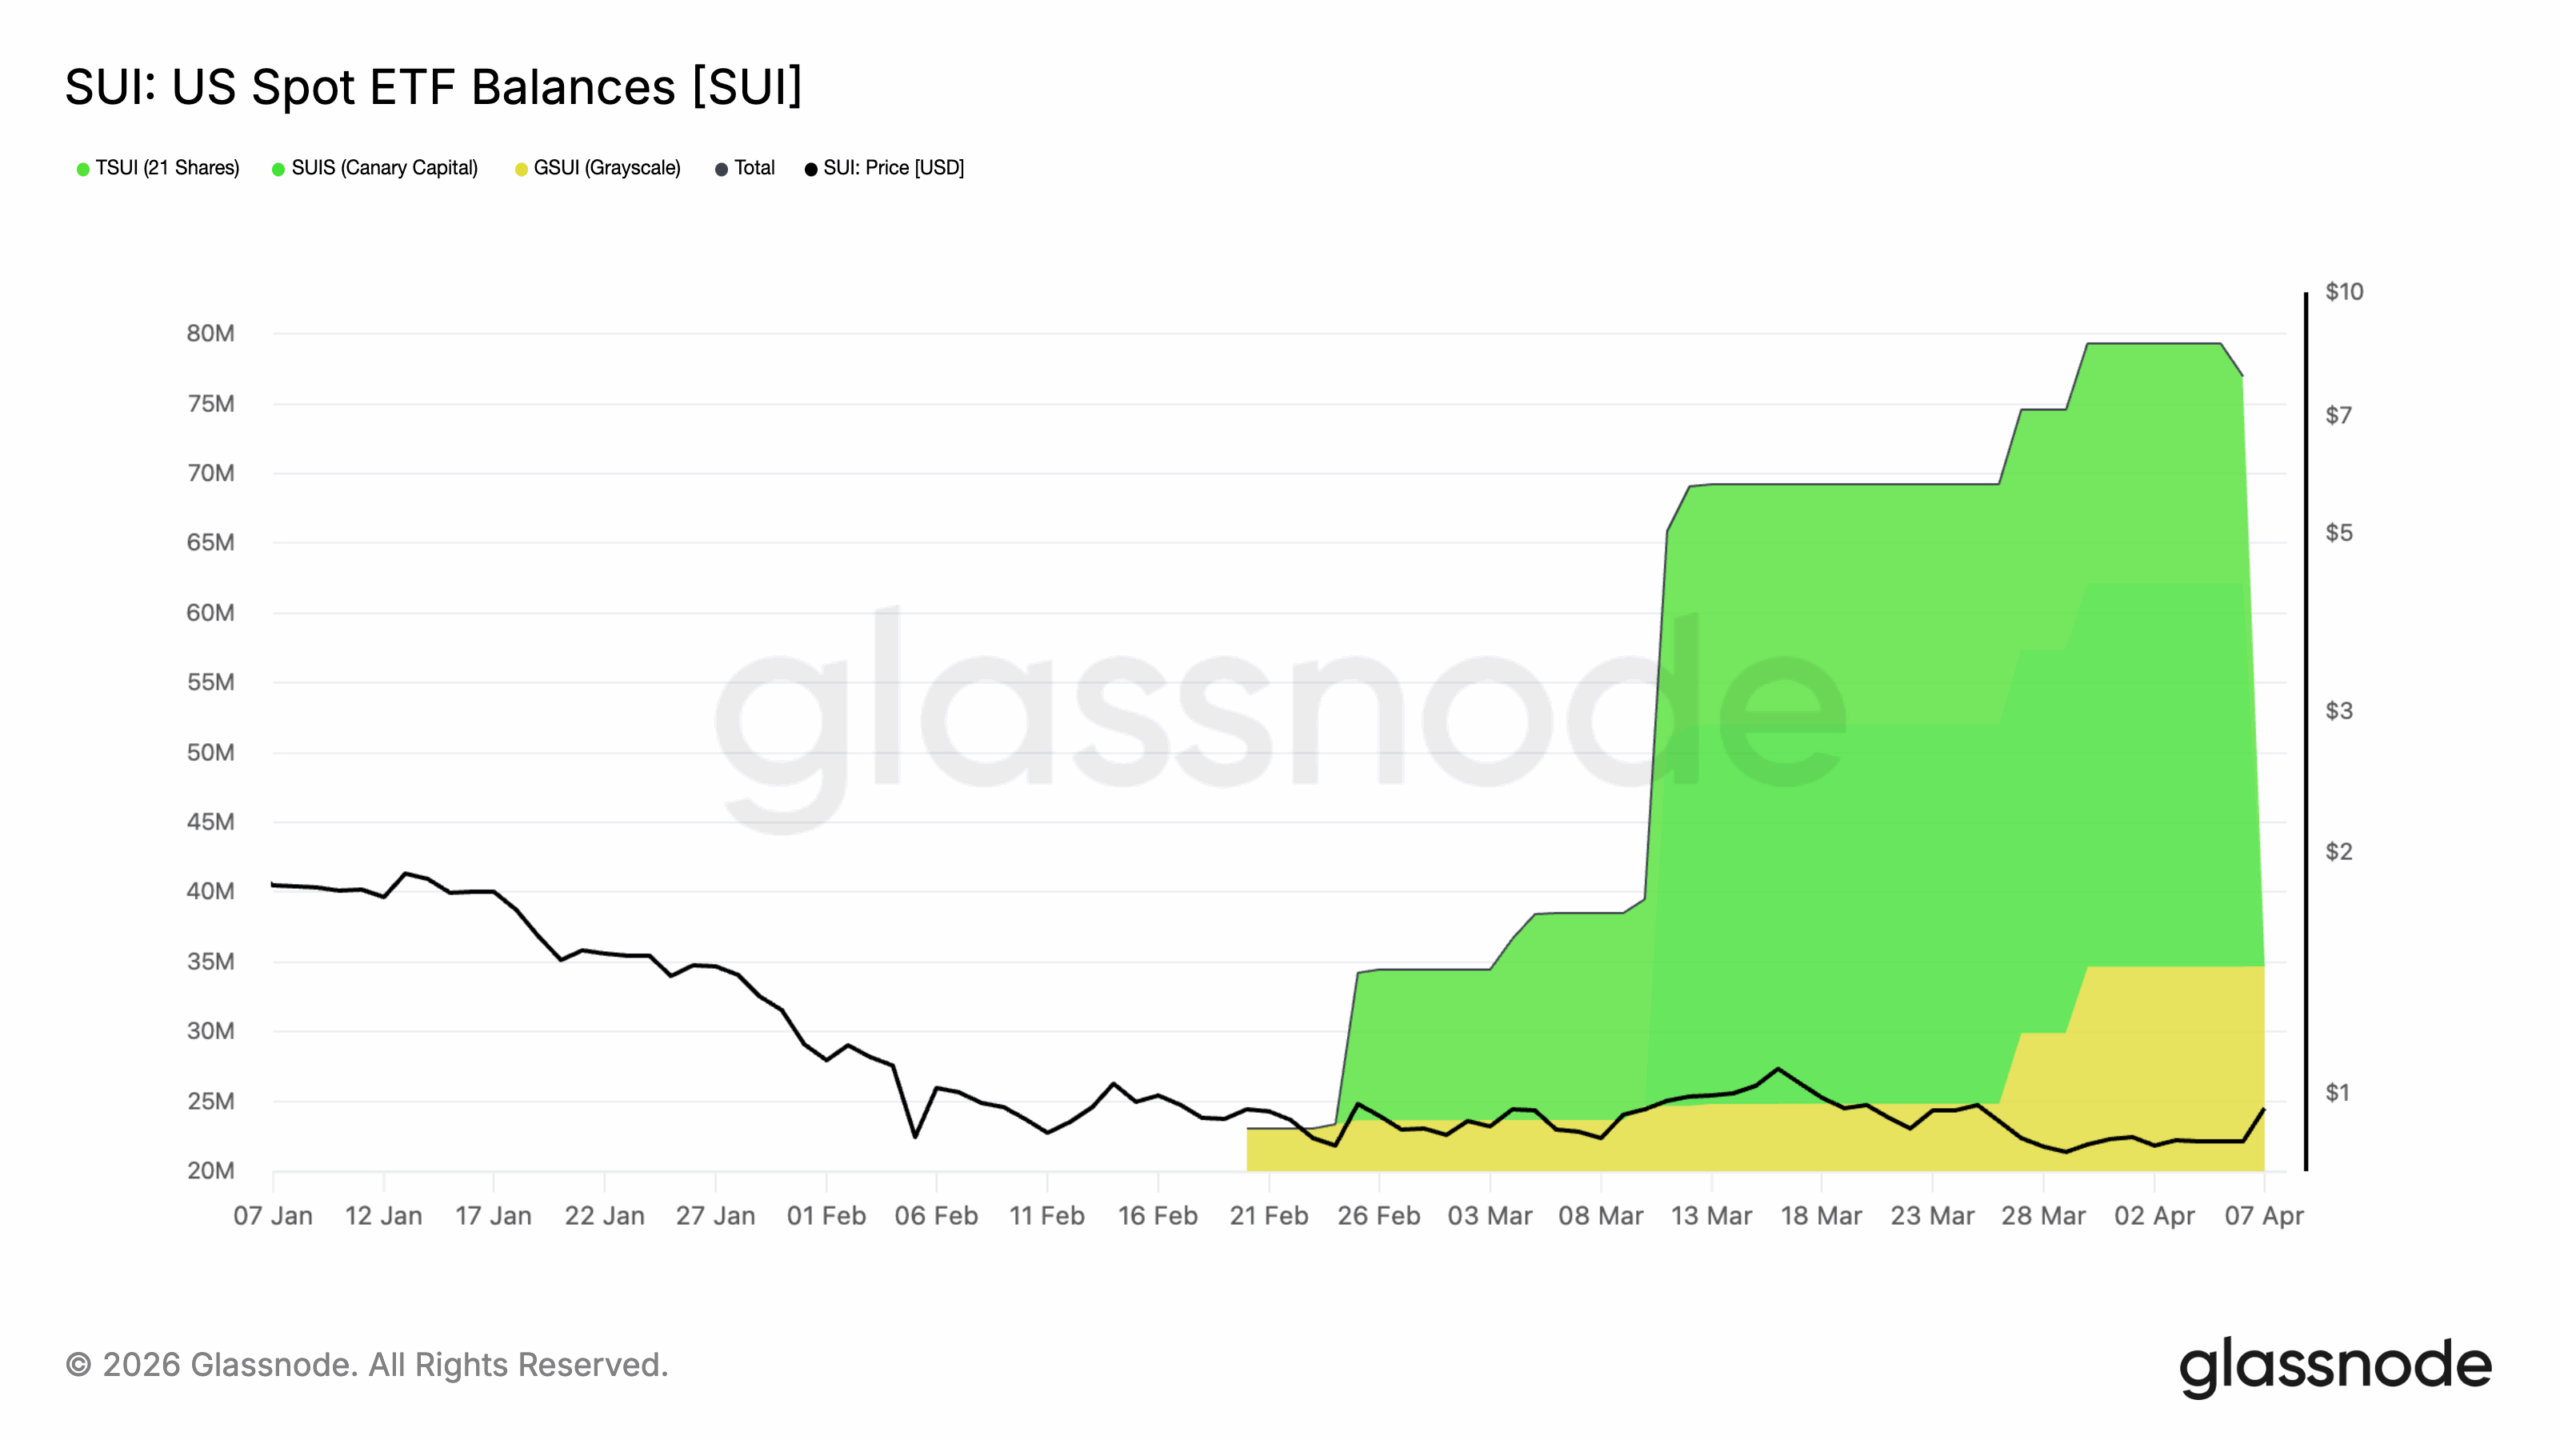
In the meantime, SUI’s exchange-traded fund (ETF) data is showing strong institutional accumulation.
The chart highlights a rise in US spot ETF balances, with total holdings climbing steadily from late February into April.
Large inflows, particularly from Canary Capital and Grayscale, have pushed total balances close to 80M SUI.
However, the price has not reacted proportionally. While ETF balances surged, the SUI price has remained relatively flat.
This divergence is important. It suggests that accumulation is happening quietly, without immediate price expansion.
Historically, this type of setup often precedes a delayed move.
When large players accumulate over time, supply gets absorbed. Eventually, this can create a supply squeeze, in which less available liquidity leads to sharper price moves as demand increases.
That said, the latest data shows a slight dip in total balances. This could indicate short-term profit-taking or rebalancing. While not a major reversal, it is worth monitoring.
SUI Price Prediction: Higher Highs?
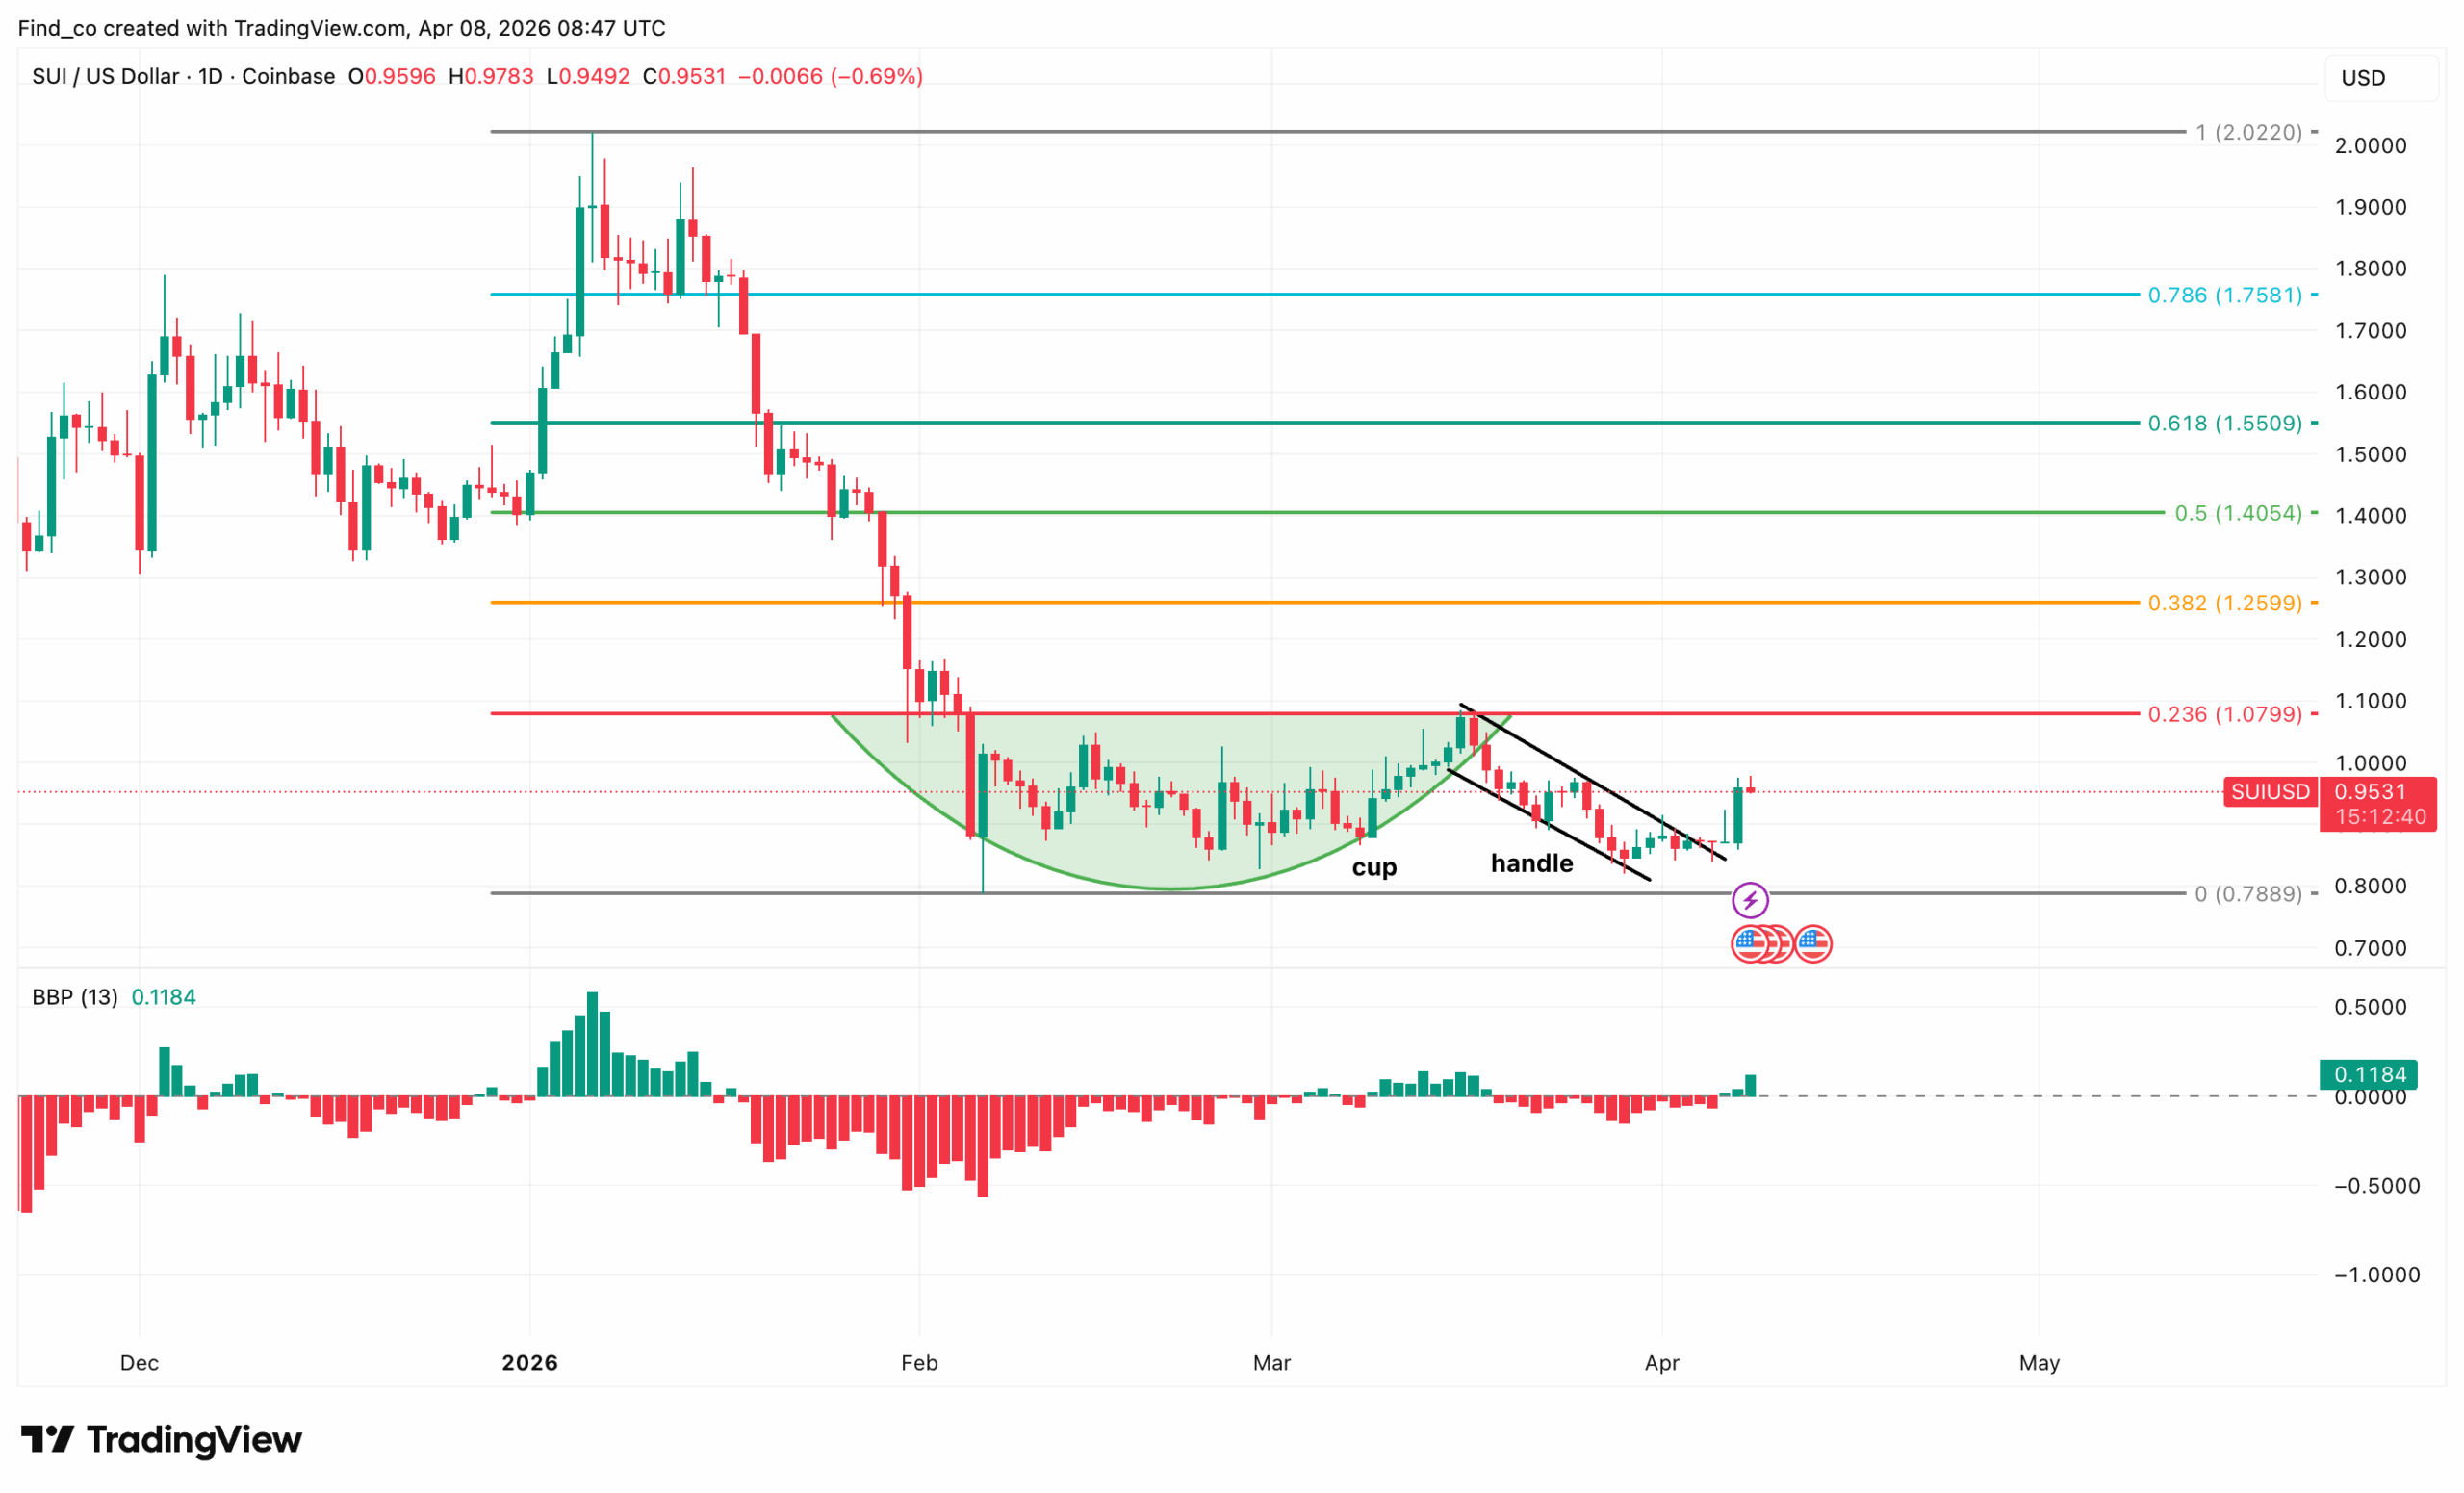
On the daily timeframe, SUI is showing a potential bullish reversal, with a classic cup-and-handle pattern forming after a prolonged downtrend.
Price has been based around the $0.80 zone and formed a rounded “cup,” signaling gradual accumulation. This is followed by a smaller pullback forming the “handle,” which typically acts as a continuation setup.
However, confirmation is still pending. The SUI crypto price is currently trading near $0.95, below the key resistance at $1.08 (0.236 Fib).
This level is critical. A breakout above it would validate the pattern and signal a stronger trend reversal.
Besides that, the Bull-Bear Power (BBP) has flipped positive, indicating that buyers are slowly regaining control.
If the breakout holds, the next targets are $1.25 (0.382 Fib), followed by $1.40 and $1.55. These levels align with major resistance zones from the previous downtrend.
On the downside, failure to break above $1.00–$1.08 could keep the price range-bound. In addition, a drop below $0.80 would invalidate the pattern and shift the outlook back to bearish.
Disclaimer:
The information provided in this article is for informational purposes only. It is not intended to be, nor should it be construed as, financial advice. We do not make any warranties regarding the completeness, reliability, or accuracy of this information. All investments involve risk, and past performance does not guarantee future results. We recommend consulting a financial advisor before making any investment decisions.
Victor Olanrewaju is a crypto analyst and reporter at CCN with deep roots in on-chain research and technical analysis. His crypto journey began in 2017, but it was the 2020 Uniswap airdrop that sparked a full-time pivot into the space.
With a foundation in copywriting, Victor honed his craft creating high-converting content for leading crypto brokers — most notably an XRP price prediction that ranked #1 on Google during the 2021 bull run.
He later joined AMBCrypto in 2022, where he combined storytelling with technical and on-chain analysis to cover key market narratives.
In 2024, he expanded his expertise at BeInCrypto, collaborating with analysts and using tools like Glassnode, Santiment, and IntoTheBlock to break down Bitcoin and altcoin trends.
At CCN, Victor covers the top cryptocurrencies, memecoins, macro shifts, blending real-time insights with deep-dive metrics.
He holds a Bachelor’s degree in Physics from the University of Ibadan, equipping him to simplify complex data for a wide audience. Follow his work or connect on LinkedIn or X.