Chainlink's price is set to breach key resistance | Credit: Hameem Sarwar
Share
Key Takeaways
LINK’s price has bounced from its recent low and is currently trading within an ascending channel.
Chainlink’s MVRV ratio currently sits at -25.56, with history suggesting a bullish reversal.
Data shows that the whales are accumulating, and the altcoin might soon breach the $13.54 resistance.
Chainlink (LINK) price last hit $15 nearly five months ago.
Since then, the altcoin has struggled to maintain a double-digit market value. At the time of writing, Chainlink’s price has bounced after initially dropping to $8.
This development appears to signal that LINK bulls have returned. But does this mean the cryptocurrency will retest $15?
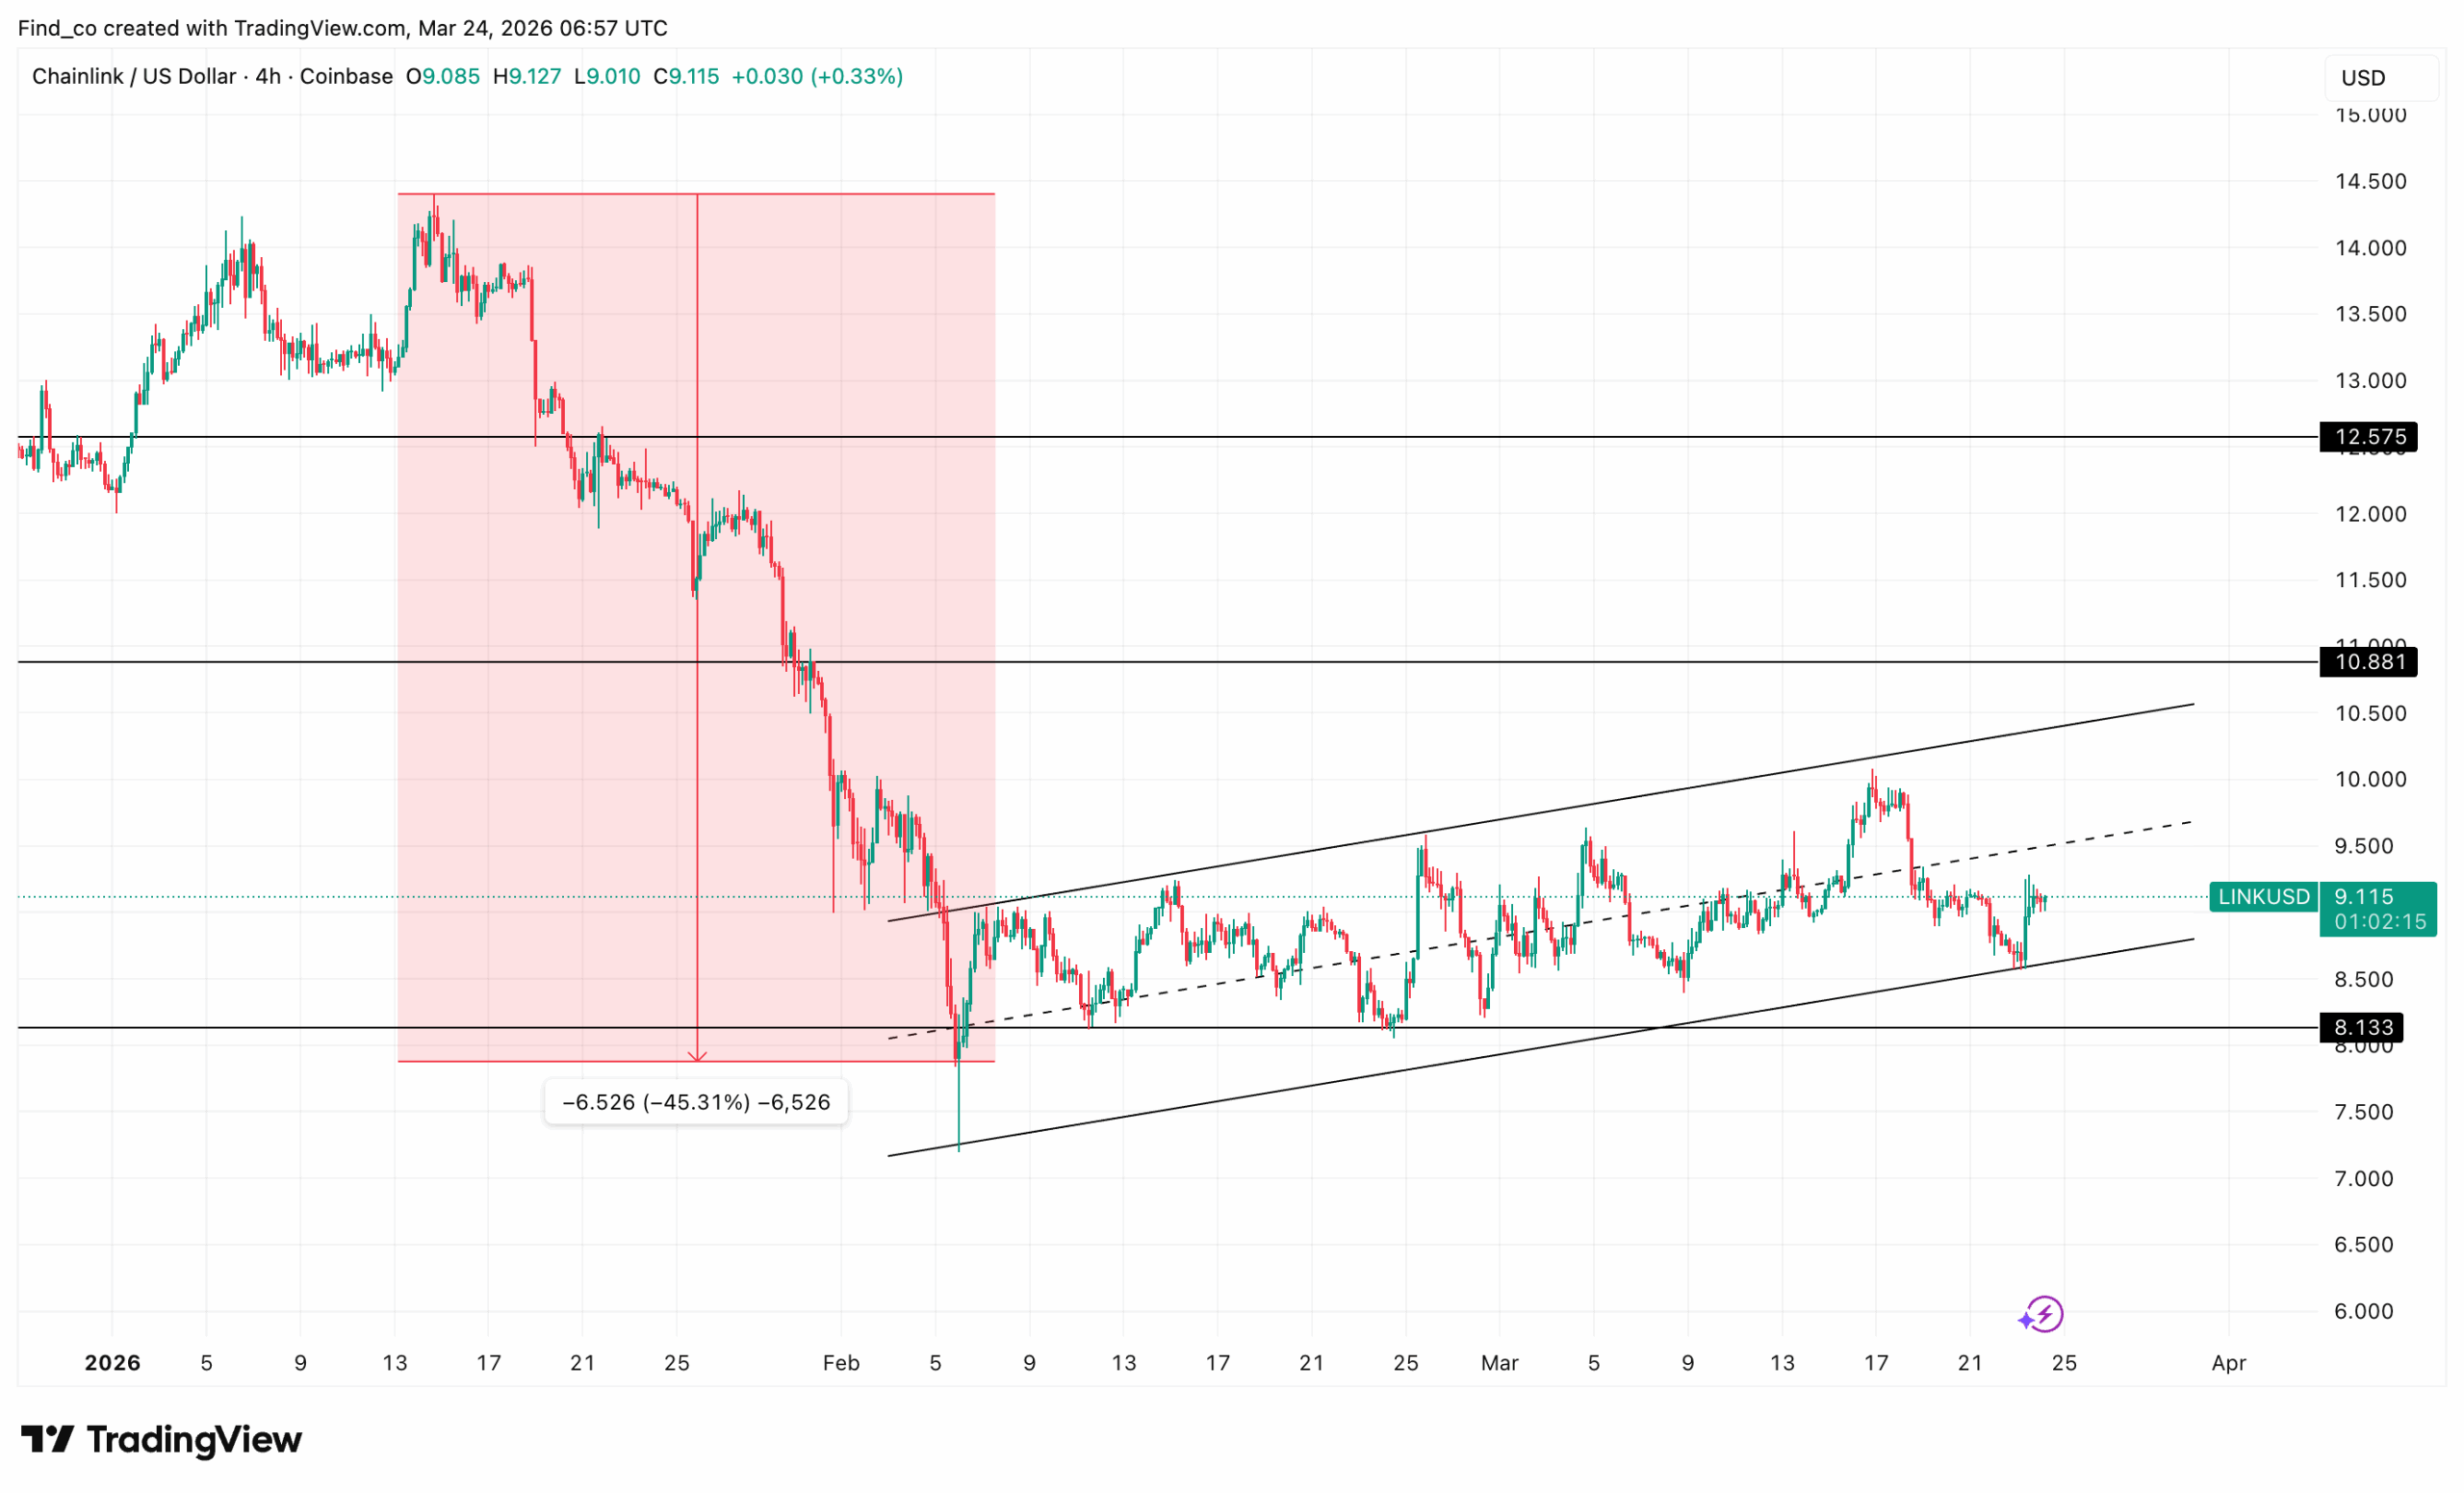
On the 4-hour timeframe, LINK/USD trades at $9.12. Notably, before the bounce, the damage began around Jan. 13, when LINK peaked near $14.50.
What followed was swift and ruthless. Over roughly three weeks, Chainlink’s price collapsed 45.31%, shedding $6.53 to a bottom near $8 by early February.
Since then, however, the structure has improved. A rising parallel channel has formed from the February lows, with price consistently making higher lows.
The channel’s lower boundary near $8.70 has absorbed every dip.
Nevertheless, progress has been frustratingly slow. Chainlink’s price has repeatedly tested the upper channel boundary near $10 without breaking through.
The $10.88 resistance level looms directly above, and sellers have aggressively defended it every time LINK’s price approaches it.
Currently, LINK sits near the channel’s midline at $9.12, drifting sideways after rejecting $10 again in mid-March.
LINK/USD 4-Hour Chart | Credit: TradingView
That midline needs to act as support now. Losing it risks a retest of the lower channel boundary near $8.13.
However, clearing $10.88 remains the bull case. Until that happens, LINK’s price remains in recovery mode.
Data Shows It’s Undervalued
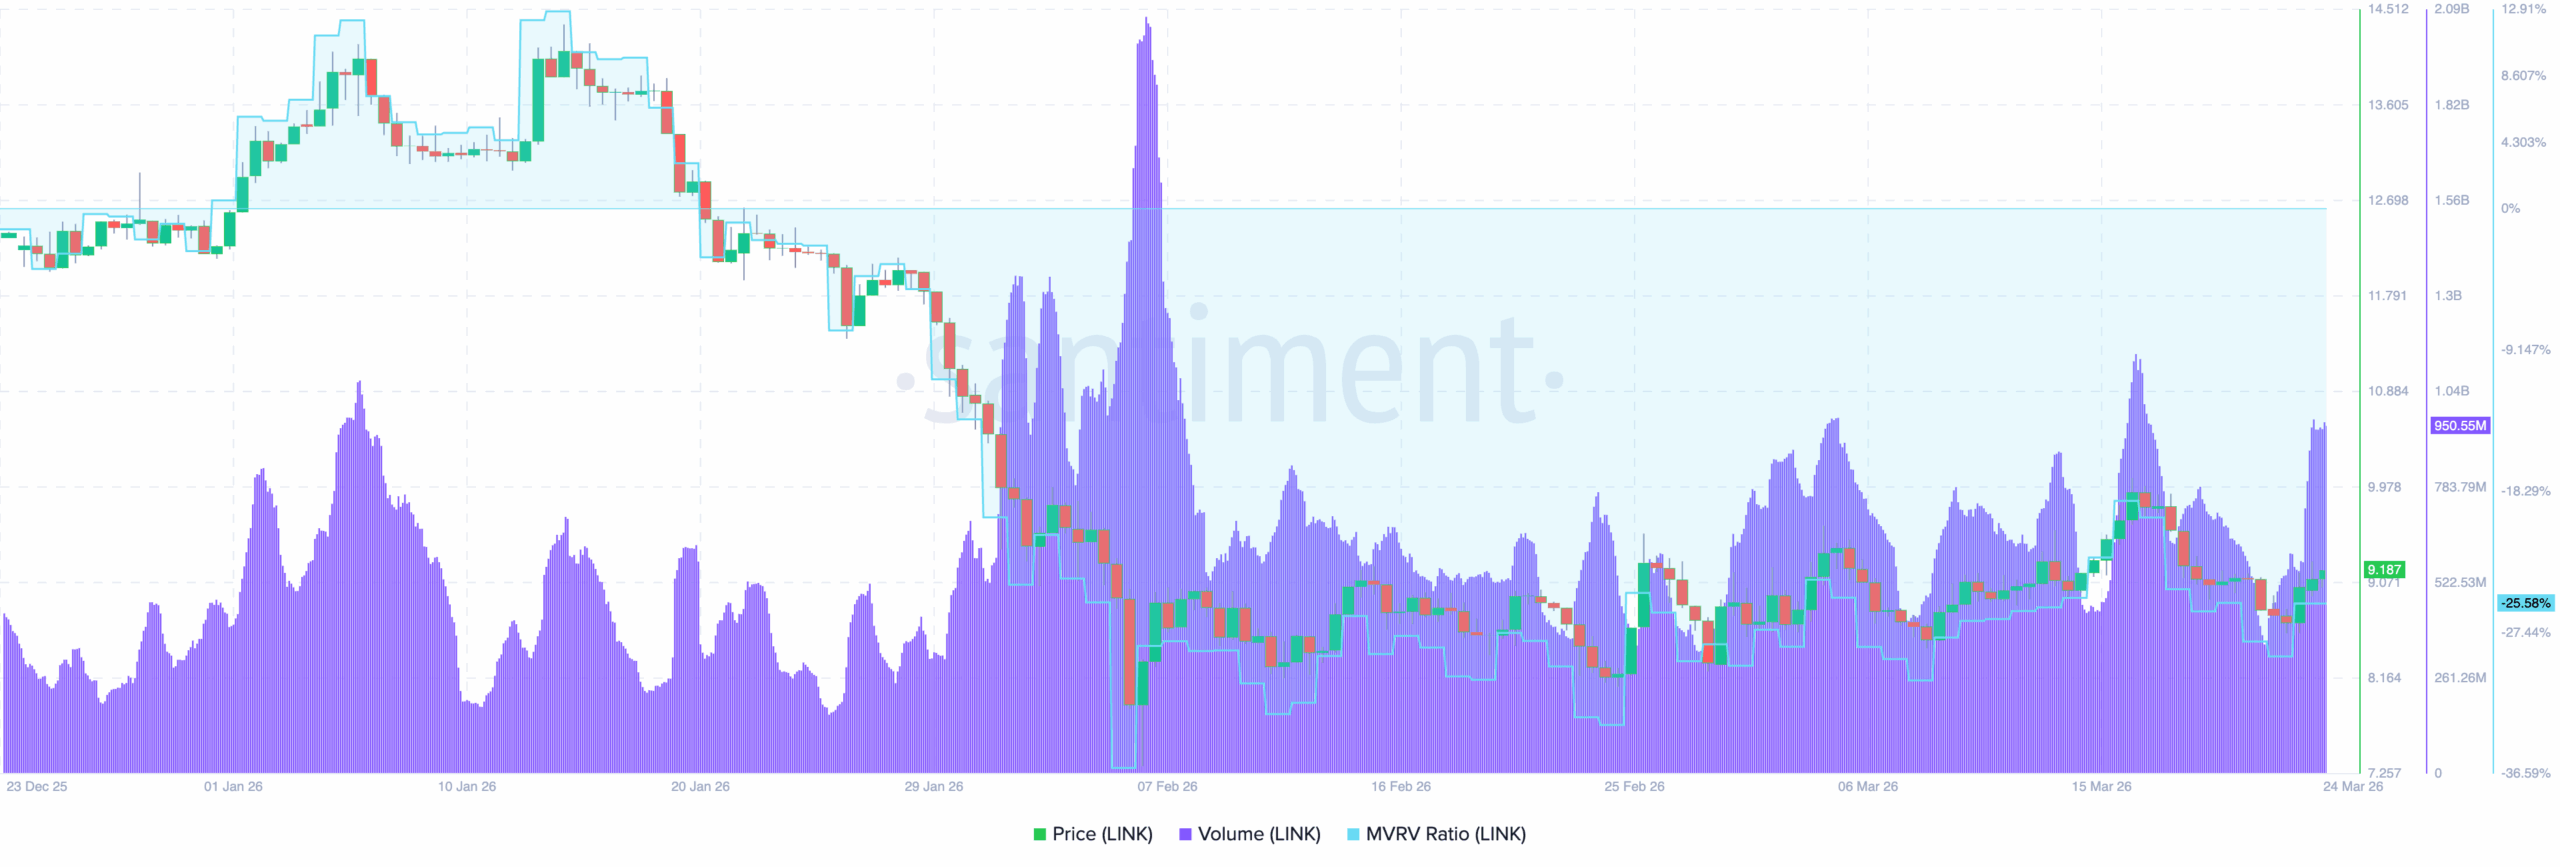
Additionally, on-chain data from Santiment shows that the MVRV ratio is -25.56%.
The MVRV Ratio measures the difference between market value and realised value. Simply put, a reading of -25.56% means the average LINK holder is currently sitting on a 25% unrealized loss.
Historically, deeply negative MVRV readings indicate that an asset has entered undervalued accumulation territory.
The journey to this point was sharp. LINK’s price traded above $14 in late December and early January, with the MVRV ratio sitting comfortably positive.
Then the January selloff hit. By early February, Chainlink’s price cratered, and the MVRV plunged into negative territory, crossing below the zero line and staying there ever since.
The volume data adds critical context. A massive volume spike erupted around Feb. 7 during the price collapse.
Since then, however, volume has normalised significantly. Crucially, there are no fresh panic spikes despite the price remaining depressed. That suggests forced selling has largely run its course.
Combined with the rising channel visible on the price chart, a negative MVRV of this magnitude historically precedes meaningful recoveries.
The risk/reward for LINK is increasingly skewed to the bullish side. However, a sustained return above the zero MVRV line would mark the true trend confirmation signal to watch.
Additionally, CCN observed that smart money is moving into Chainlink.
Whales Add to the Thesis
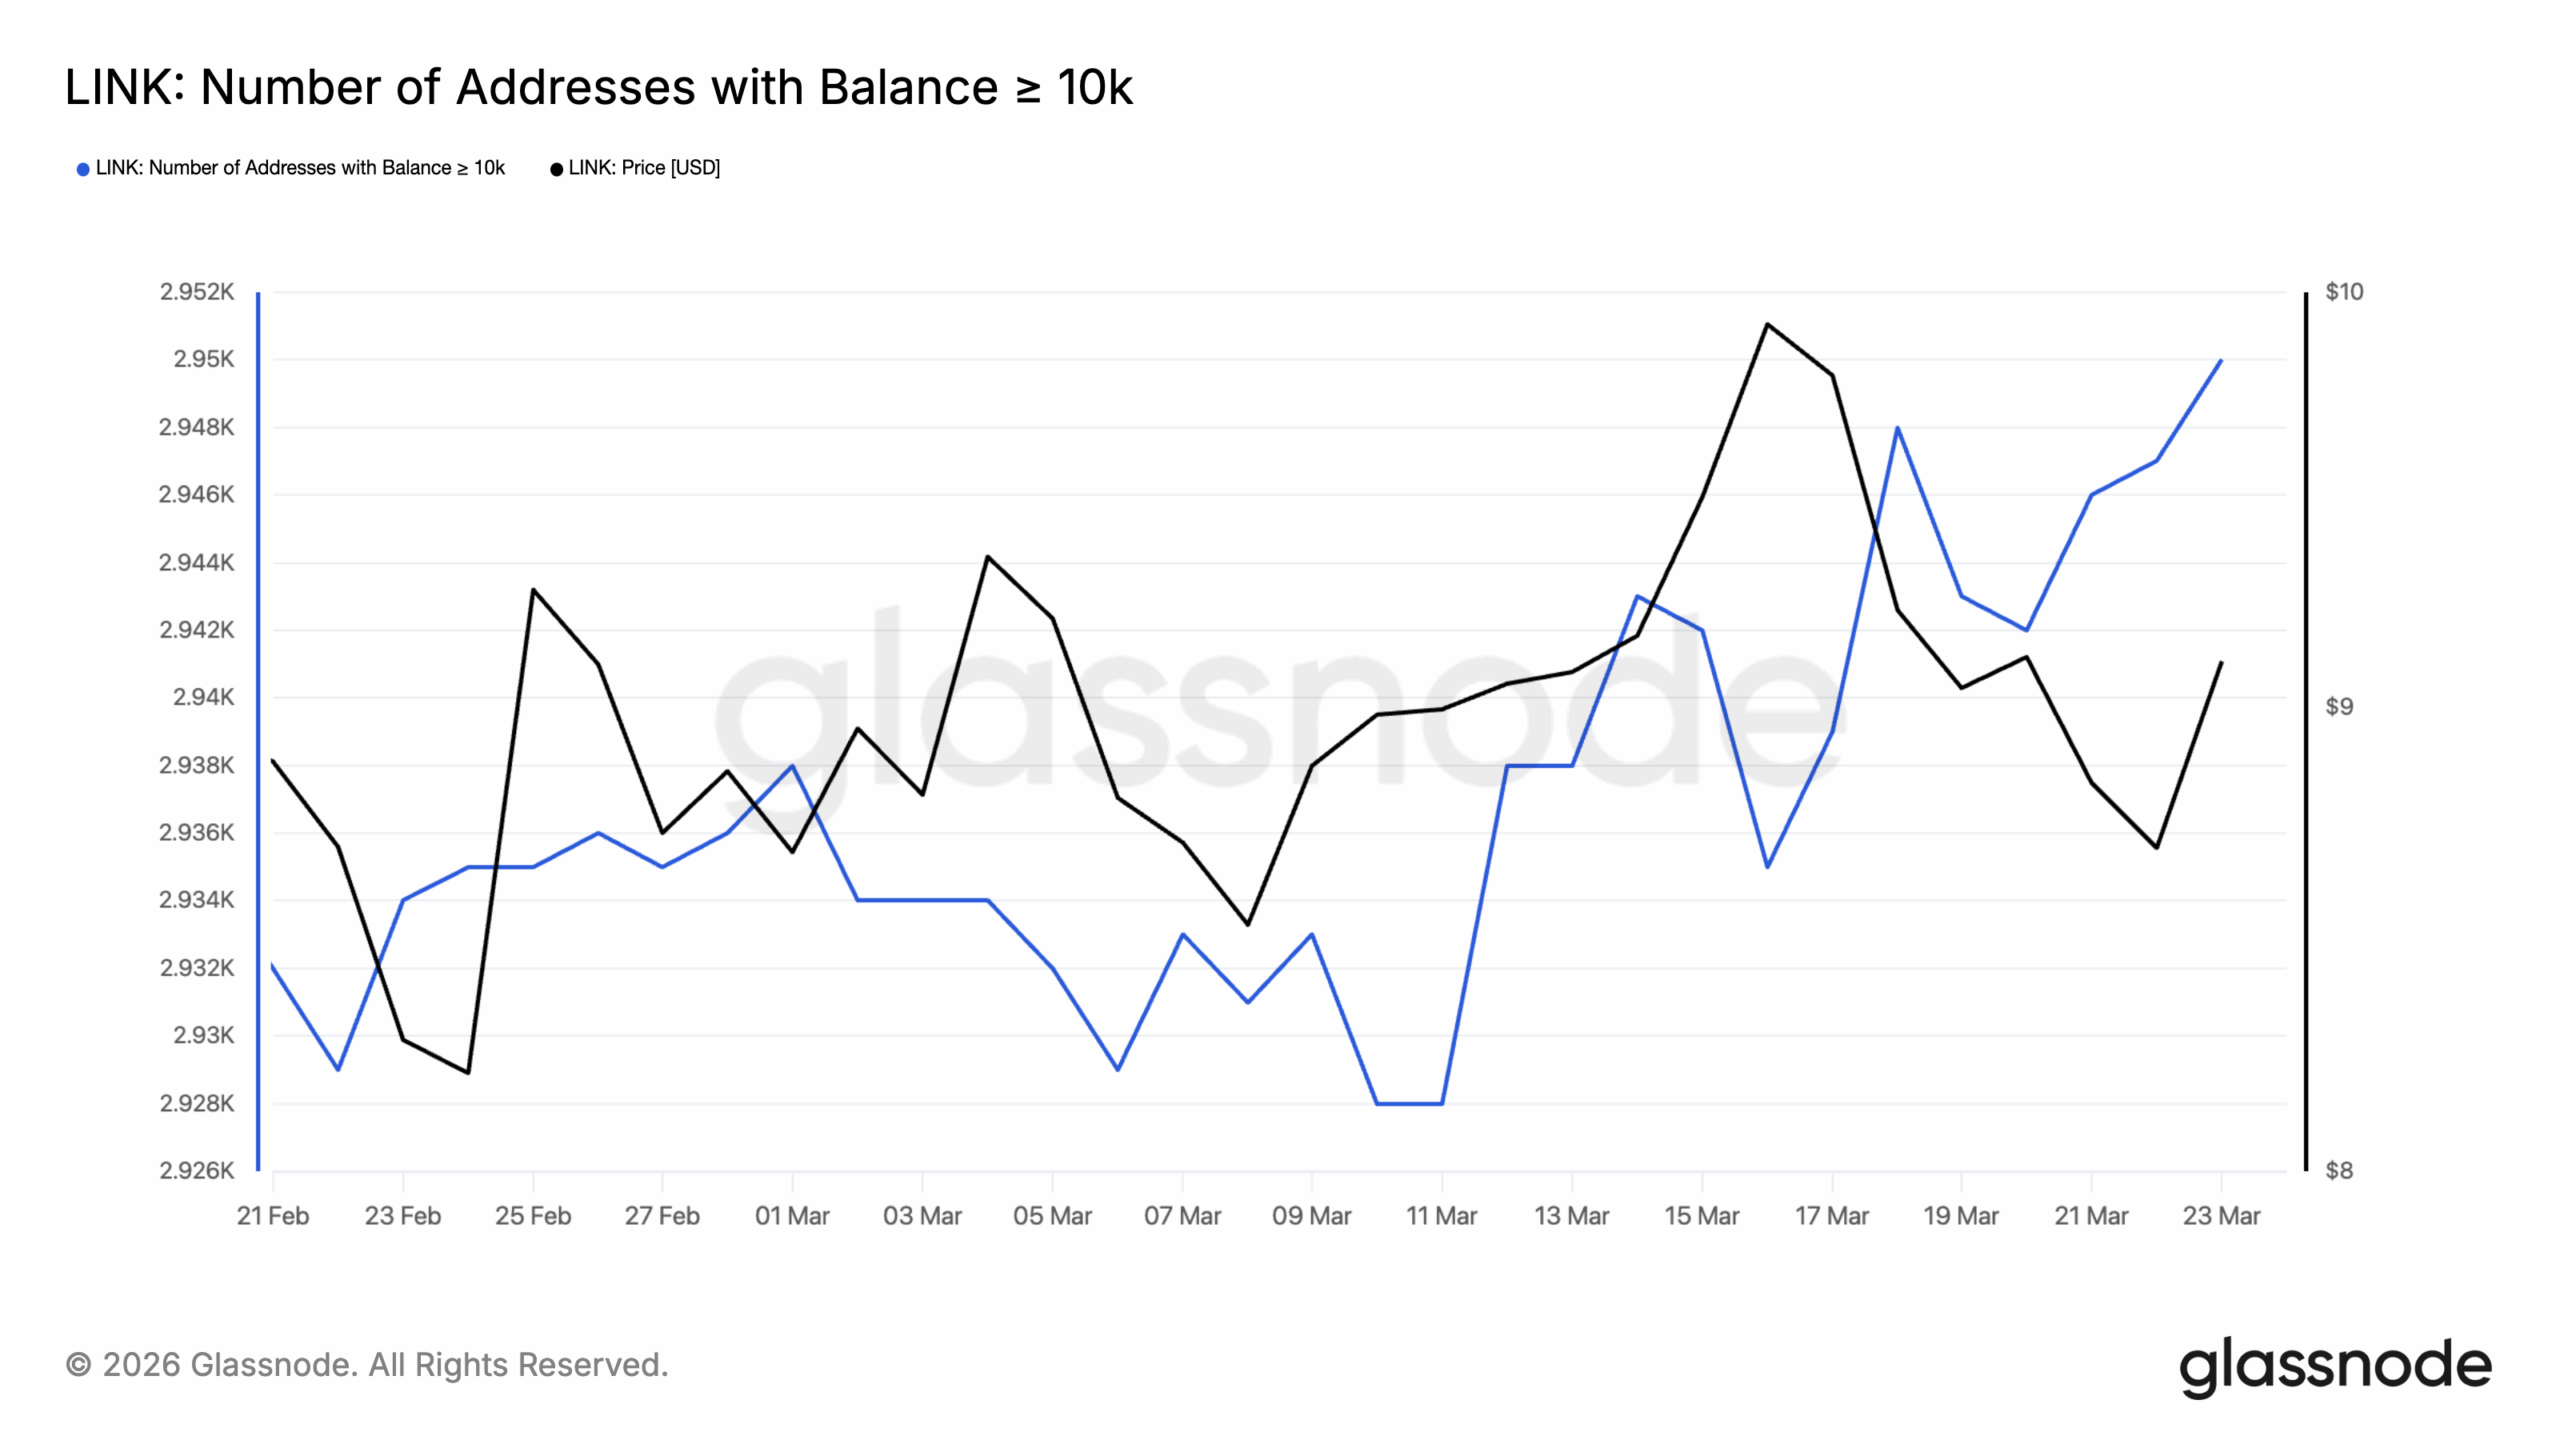
Glassnode’s data shows that the number of wallets holding at least 10,000 LINK has been steadily rising since mid-March, even as the price remained largely suppressed.
The chart covers Feb. 21 to March 24, and the story it tells unfolds in two distinct phases.
First, from late February through early March, whale addresses actually declined from 2,9520 to a low of 2,929 around March 11.
During this period, Chainlink’s price also drifted lower toward $8.50.
Then something shifted. From March 13 onward, whale addresses began climbing consistently and aggressively.
By March 24, the count had recovered to 2,950 (nearly matching the February peak).
Crucially, this accumulation intensified even during the mid-March price dip toward $8.60.
Meanwhile, the price has responded. LINK has pushed back above $9, and the correlation between rising whale counts and recovering price is increasingly evident in the second half of the chart.
LINK Number of Addresses with Balance ≥ 10k | Credit: Glassnode
This on-chain data aligns powerfully with the MVRV undervaluation signal and the rising channel structure identified on the price chart.
If sustained, this could drive LINK’s price higher than it has recently.
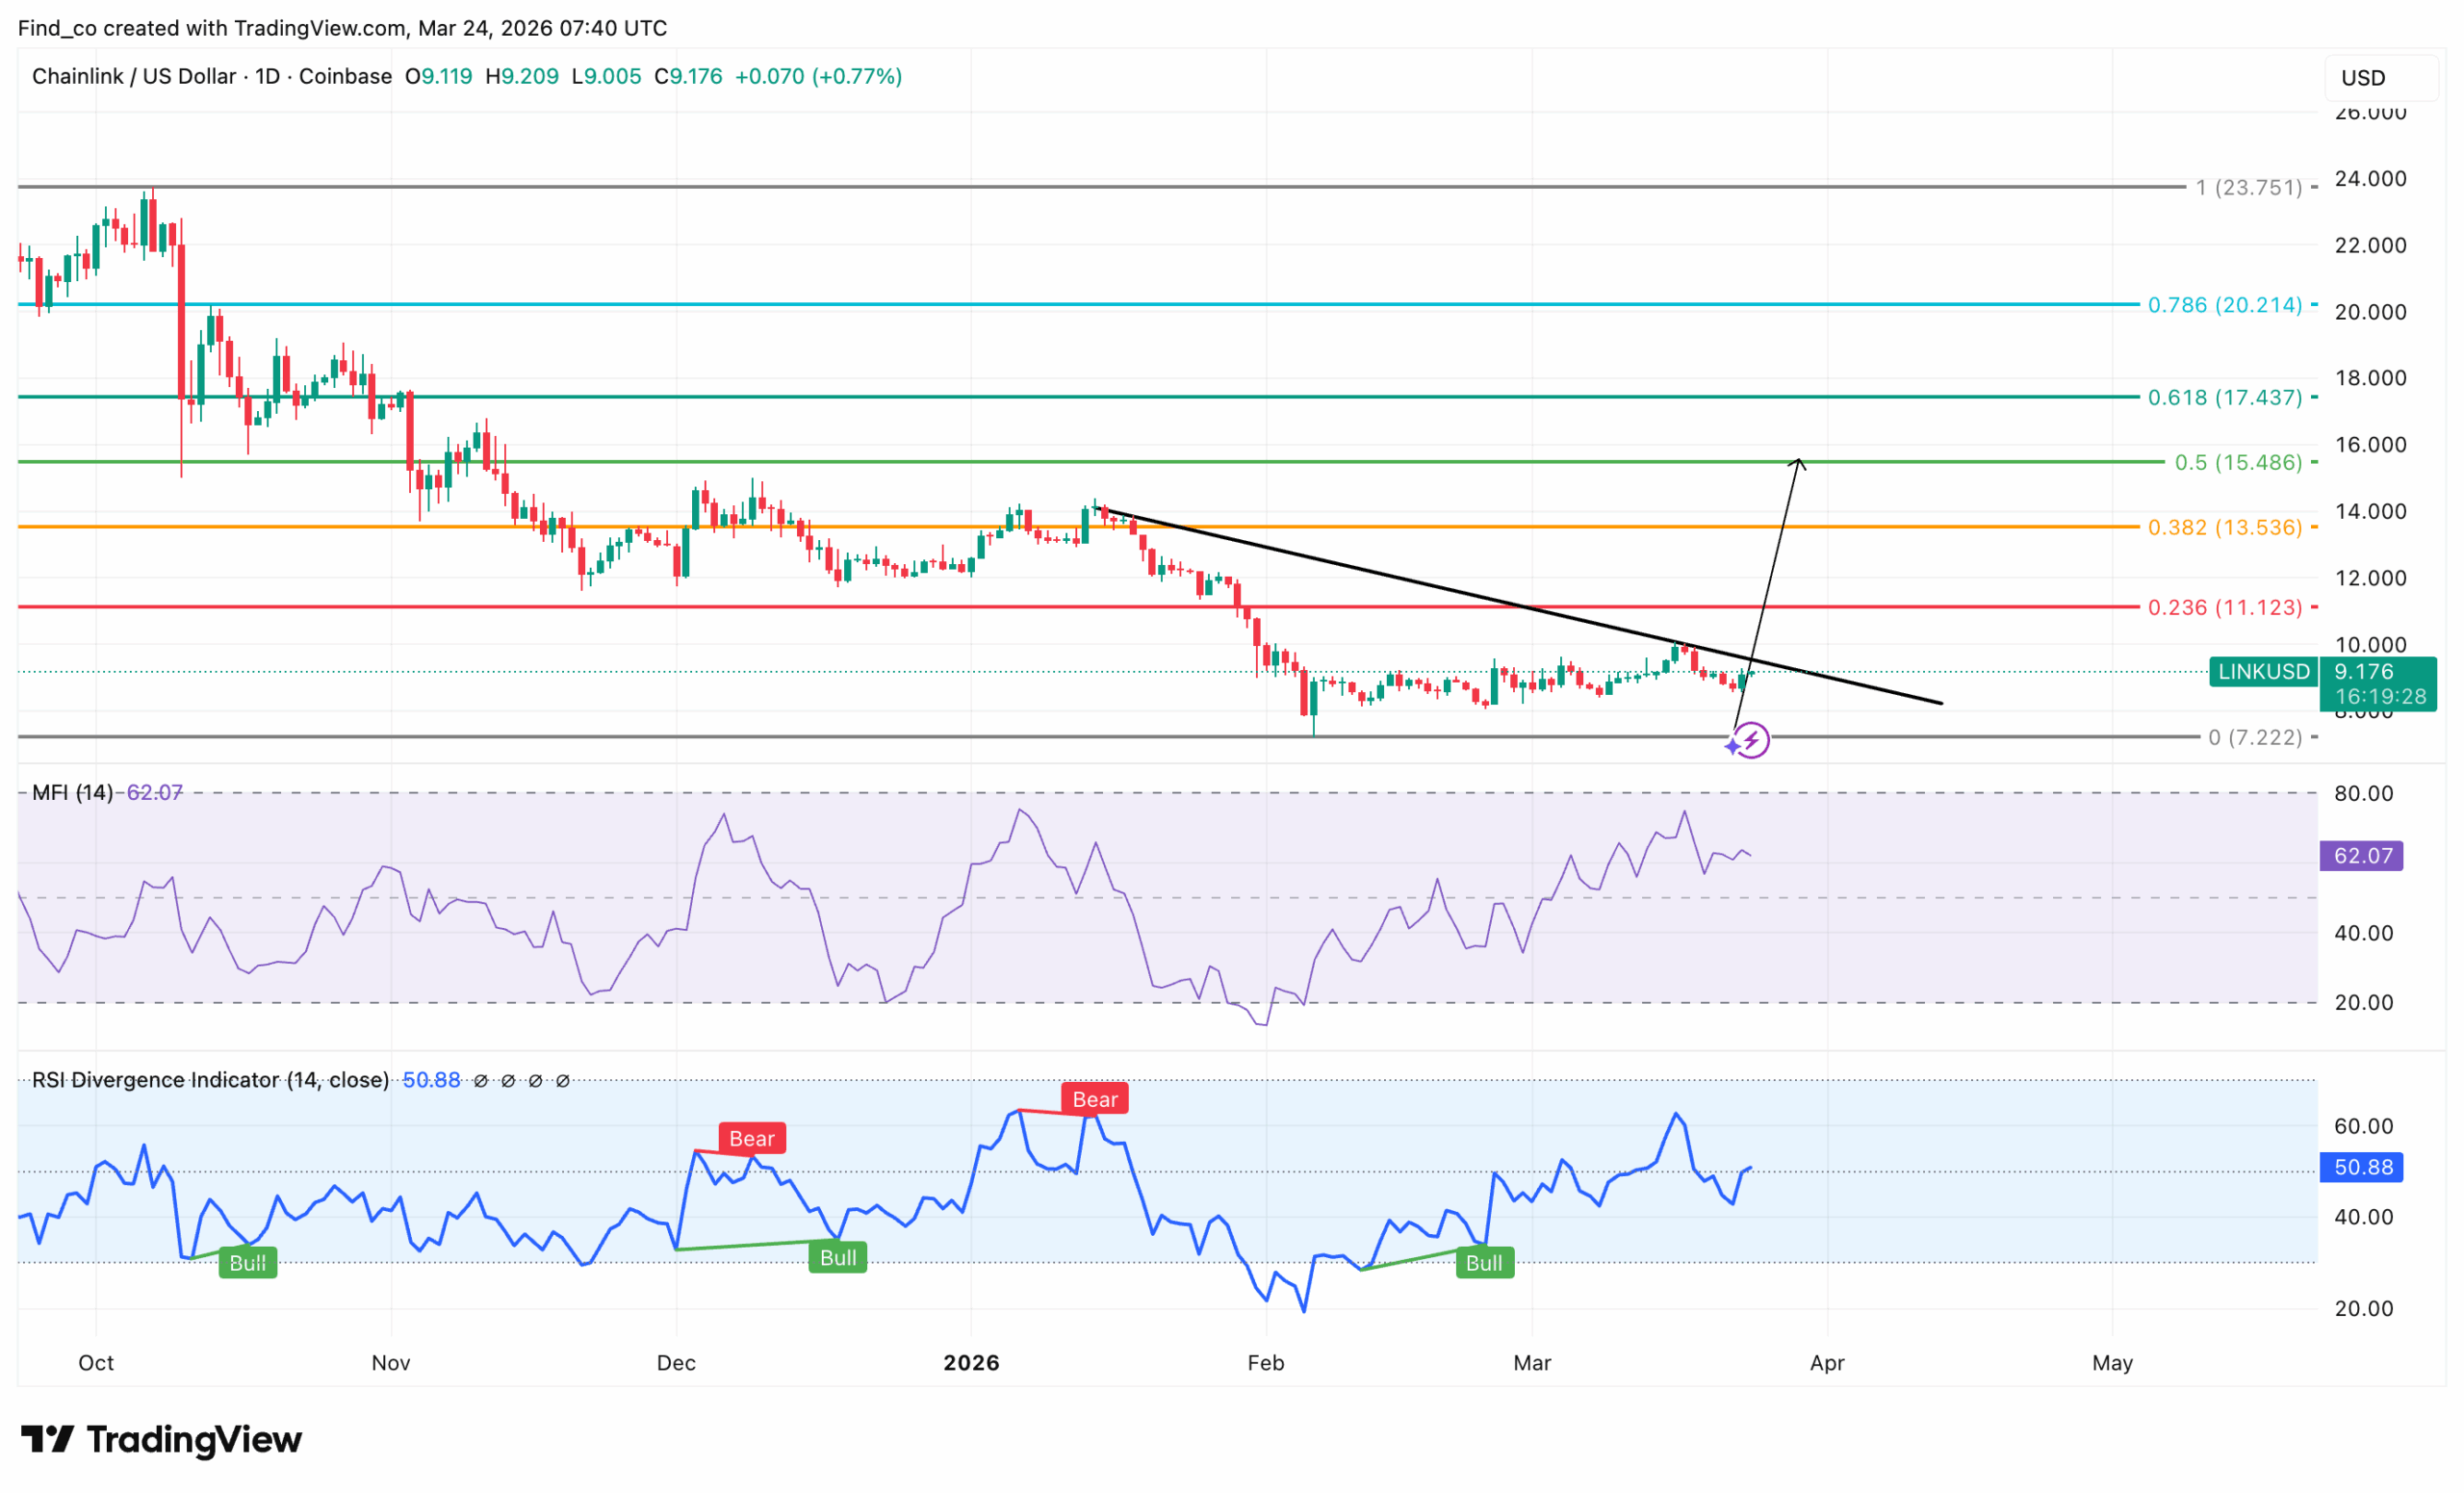
On the daily chart, the technical picture is quietly becoming one of the most compelling setups in the current market.
The dominant structure is a descending trendline that has capped every meaningful rally since October 2025.
Chainlink’s price has respected this line with remarkable consistency, failing at each touch and rolling back lower.
Now, however, LINK is once again pressing directly against that trendline. This time, the conditions supporting a breakout are far stronger than before.
The RSI tells a critical story. Three consecutive bullish divergence signals have printed — in October, December, and most recently in early February.
Each time, LINK’s price made lower lows while RSI held higher. That persistent divergence signals accumulating upside pressure. The RSI now sits at 50.88, right at the neutral midpoint and rising.
The Money Flow Index (MFI) reinforces this powerfully. At 62.07, it sits in bullish territory and has been trending higher throughout March.
Therefore, a trendline breakout would immediately target the 0.236 Fibonacci level at $11.12 as the first checkpoint.
Beyond that, the 0.382 level at $13.54 and the 0.5 level at $15.49 represent progressively stronger recovery milestones.
The Risks Bulls Cannot Ignore
However, despite Chainlink’s technical setup, balance demands honesty. The Iran conflict remains the dominant macro variable.
Any renewed escalation, possibly triggered by the expiry of Trump’s five-day pause or a fresh Iranian retaliatory strike, could reignite risk-off sentiment and pull LINK’s price back below the breakdown zone exit level it just cleared.
Also, a Bitcoin breakdown below $68,000 would have a similar effect.
Additionally, the $15 resistance level carries genuine supply weight. Clearing it requires sustained buying across multiple sessions — not a single momentum candle.
The breakdown exit has demonstrated that conviction exists. Whether it persists through the sessions ahead depends on the macro environment holding its current cautious stability.
Disclaimer:
The information provided in this article is for informational purposes only. It is not intended to be, nor should it be construed as, financial advice. We do not make any warranties regarding the completeness, reliability, or accuracy of this information. All investments involve risk, and past performance does not guarantee future results. We recommend consulting a financial advisor before making any investment decisions.
Victor Olanrewaju is a crypto analyst and reporter at CCN with deep roots in on-chain research and technical analysis. His crypto journey began in 2017, but it was the 2020 Uniswap airdrop that sparked a full-time pivot into the space.
With a foundation in copywriting, Victor honed his craft creating high-converting content for leading crypto brokers — most notably an XRP price prediction that ranked #1 on Google during the 2021 bull run.
He later joined AMBCrypto in 2022, where he combined storytelling with technical and on-chain analysis to cover key market narratives.
In 2024, he expanded his expertise at BeInCrypto, collaborating with analysts and using tools like Glassnode, Santiment, and IntoTheBlock to break down Bitcoin and altcoin trends.
At CCN, Victor covers the top cryptocurrencies, memecoins, macro shifts, blending real-time insights with deep-dive metrics.
He holds a Bachelor’s degree in Physics from the University of Ibadan, equipping him to simplify complex data for a wide audience. Follow his work or connect on LinkedIn or X.