Wallet withdrew 43.49 million ENA tokens from Binance as part of a $16.06 million multi-altcoin move.
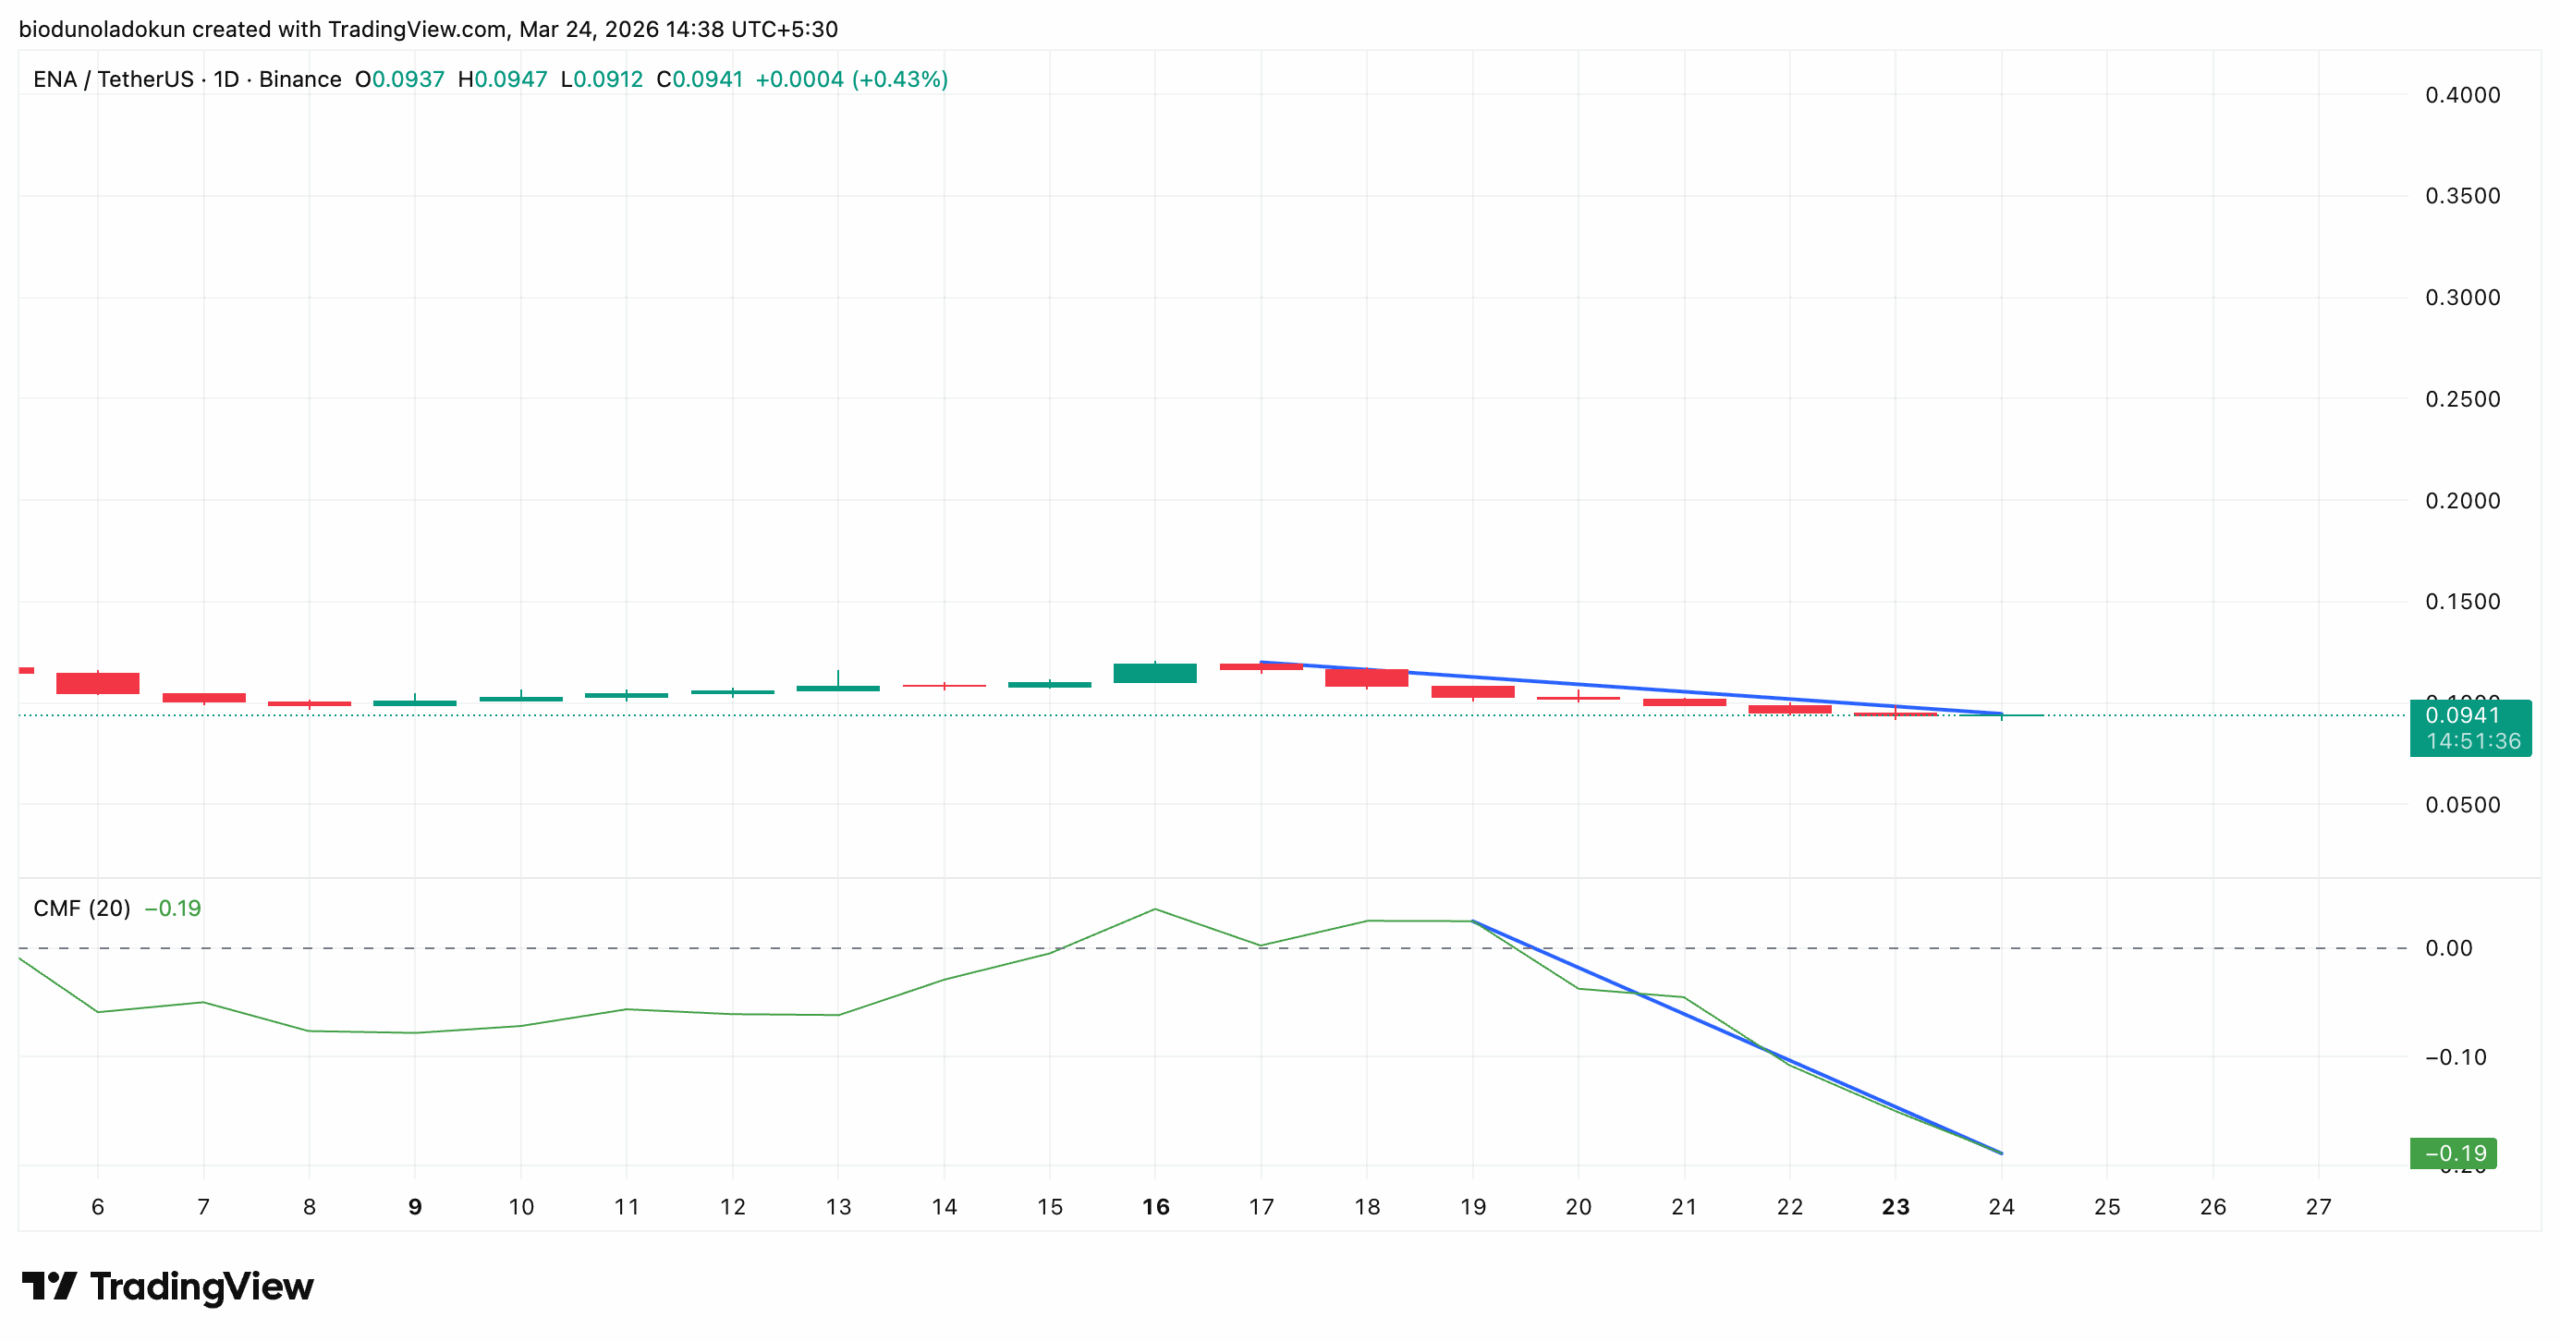
ENA’s CMF sits at -0.19 and is declining, confirming that distribution is ongoing and that broad market demand has not yet returned to absorb sell-side pressure.
Despite bearish spot market conditions, ENA’s NVT ratio and Liquidation heatmap suggest a rally is likely.
In a series of transactions executed 12 hours ago, a new whale wallet has withdrawn $16.06 million worth of altcoins from Binance.
On-chain data shows that ENA, the native token of Ethena—an Ethereum-based synthetic dollar protocol—accounts for the largest share of tokens withdrawn, making it worth assessing how its price has reacted to this move.
43 Million ENA Withdrawal That Should Have Moved Price — But Didn’t
The wallet, identified by the address 0x04d8, pulled 43.49 million ENA tokens valued at $4.07 million from the exchange.
The withdrawal was part of a broader multi-asset move that also included significant positions in AAVE ($3.64 million), AVAX ($2.37 million), UNI ($2.13 million), ONDO ($2.05 million), and PENDLE ($1.81 million).
This move is significant because when a large holder moves tokens off a centralized exchange, it signals that the wallet is moving assets into self-custody for long-term holding. It is considered a bullish sign that often drives up an asset’s value.
However, ENA’s price performance has been muted over the past day, failing to react to this whale move.
Why?
Market Not Buying What the Whale Is Selling — Yet
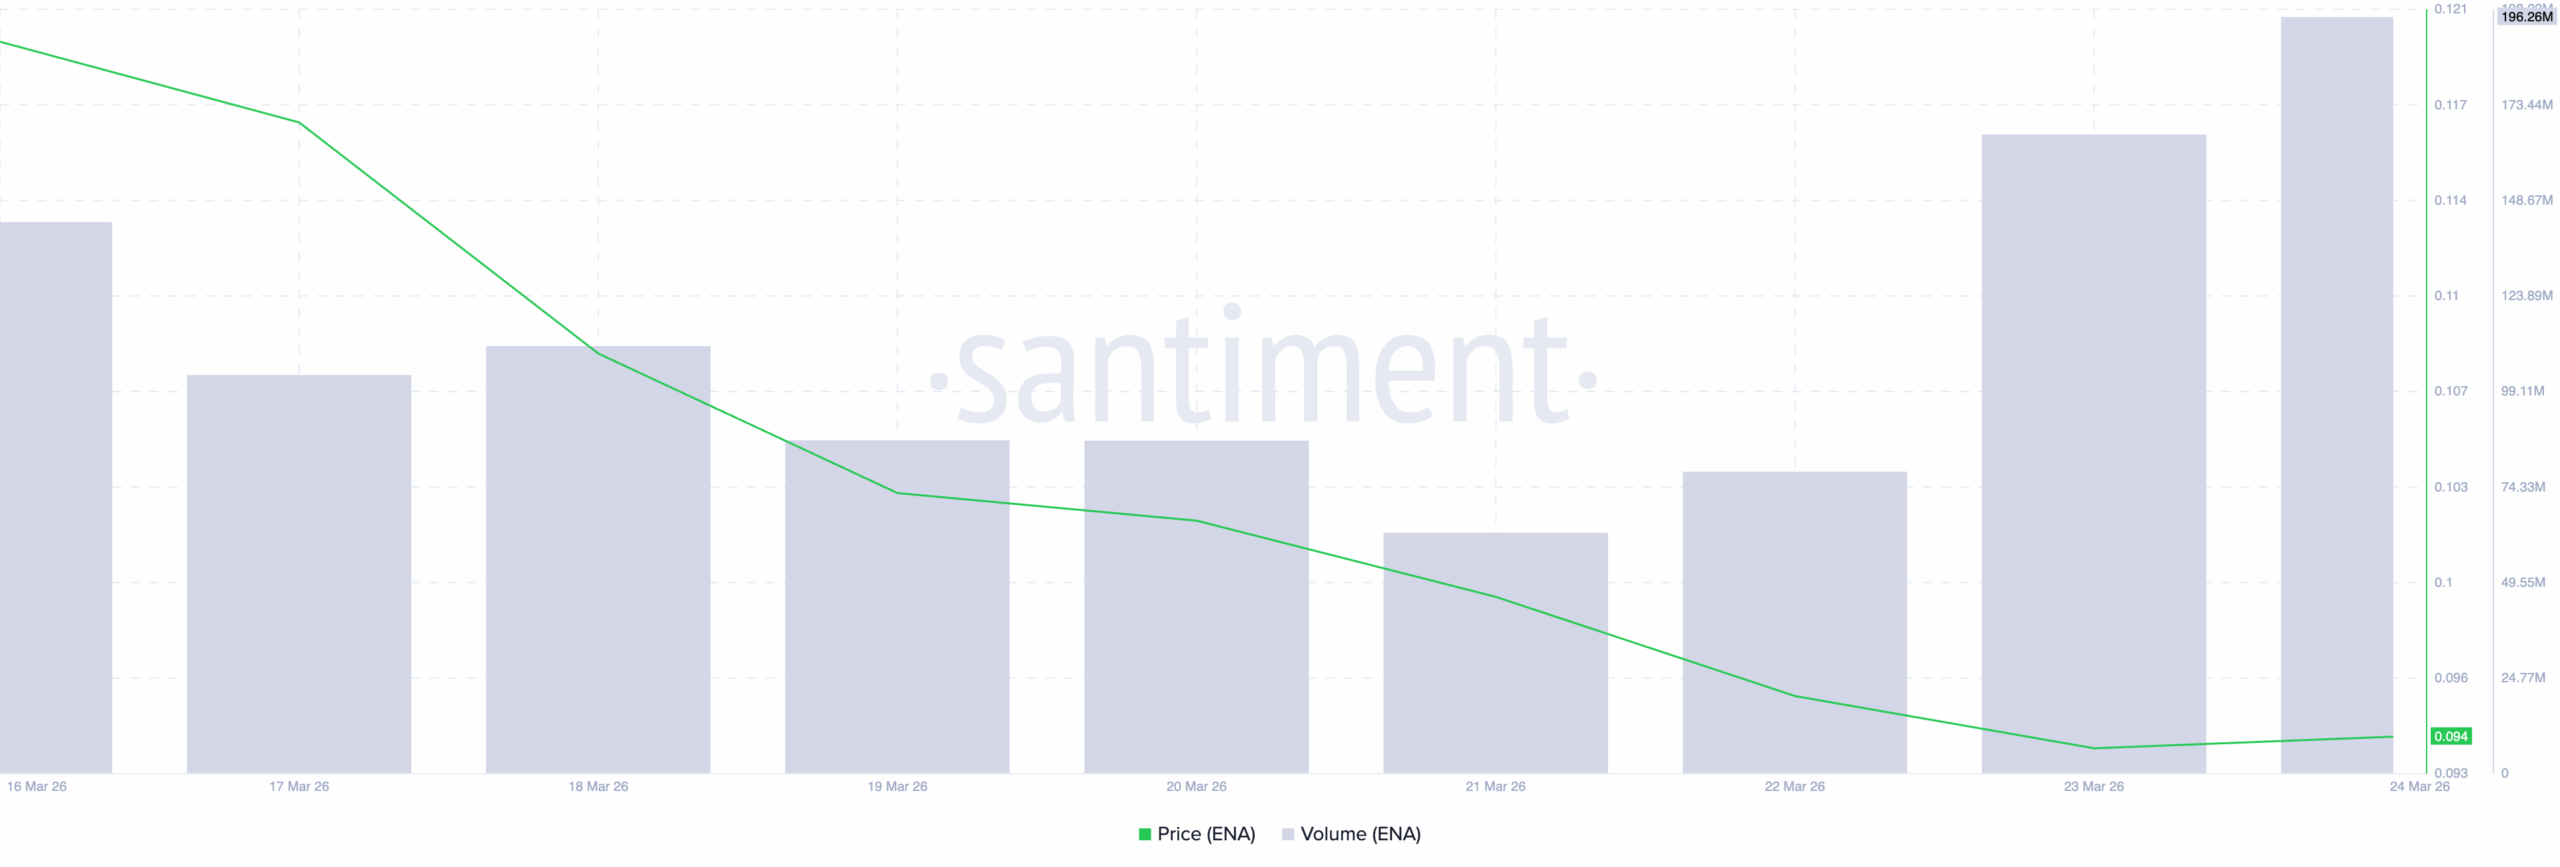
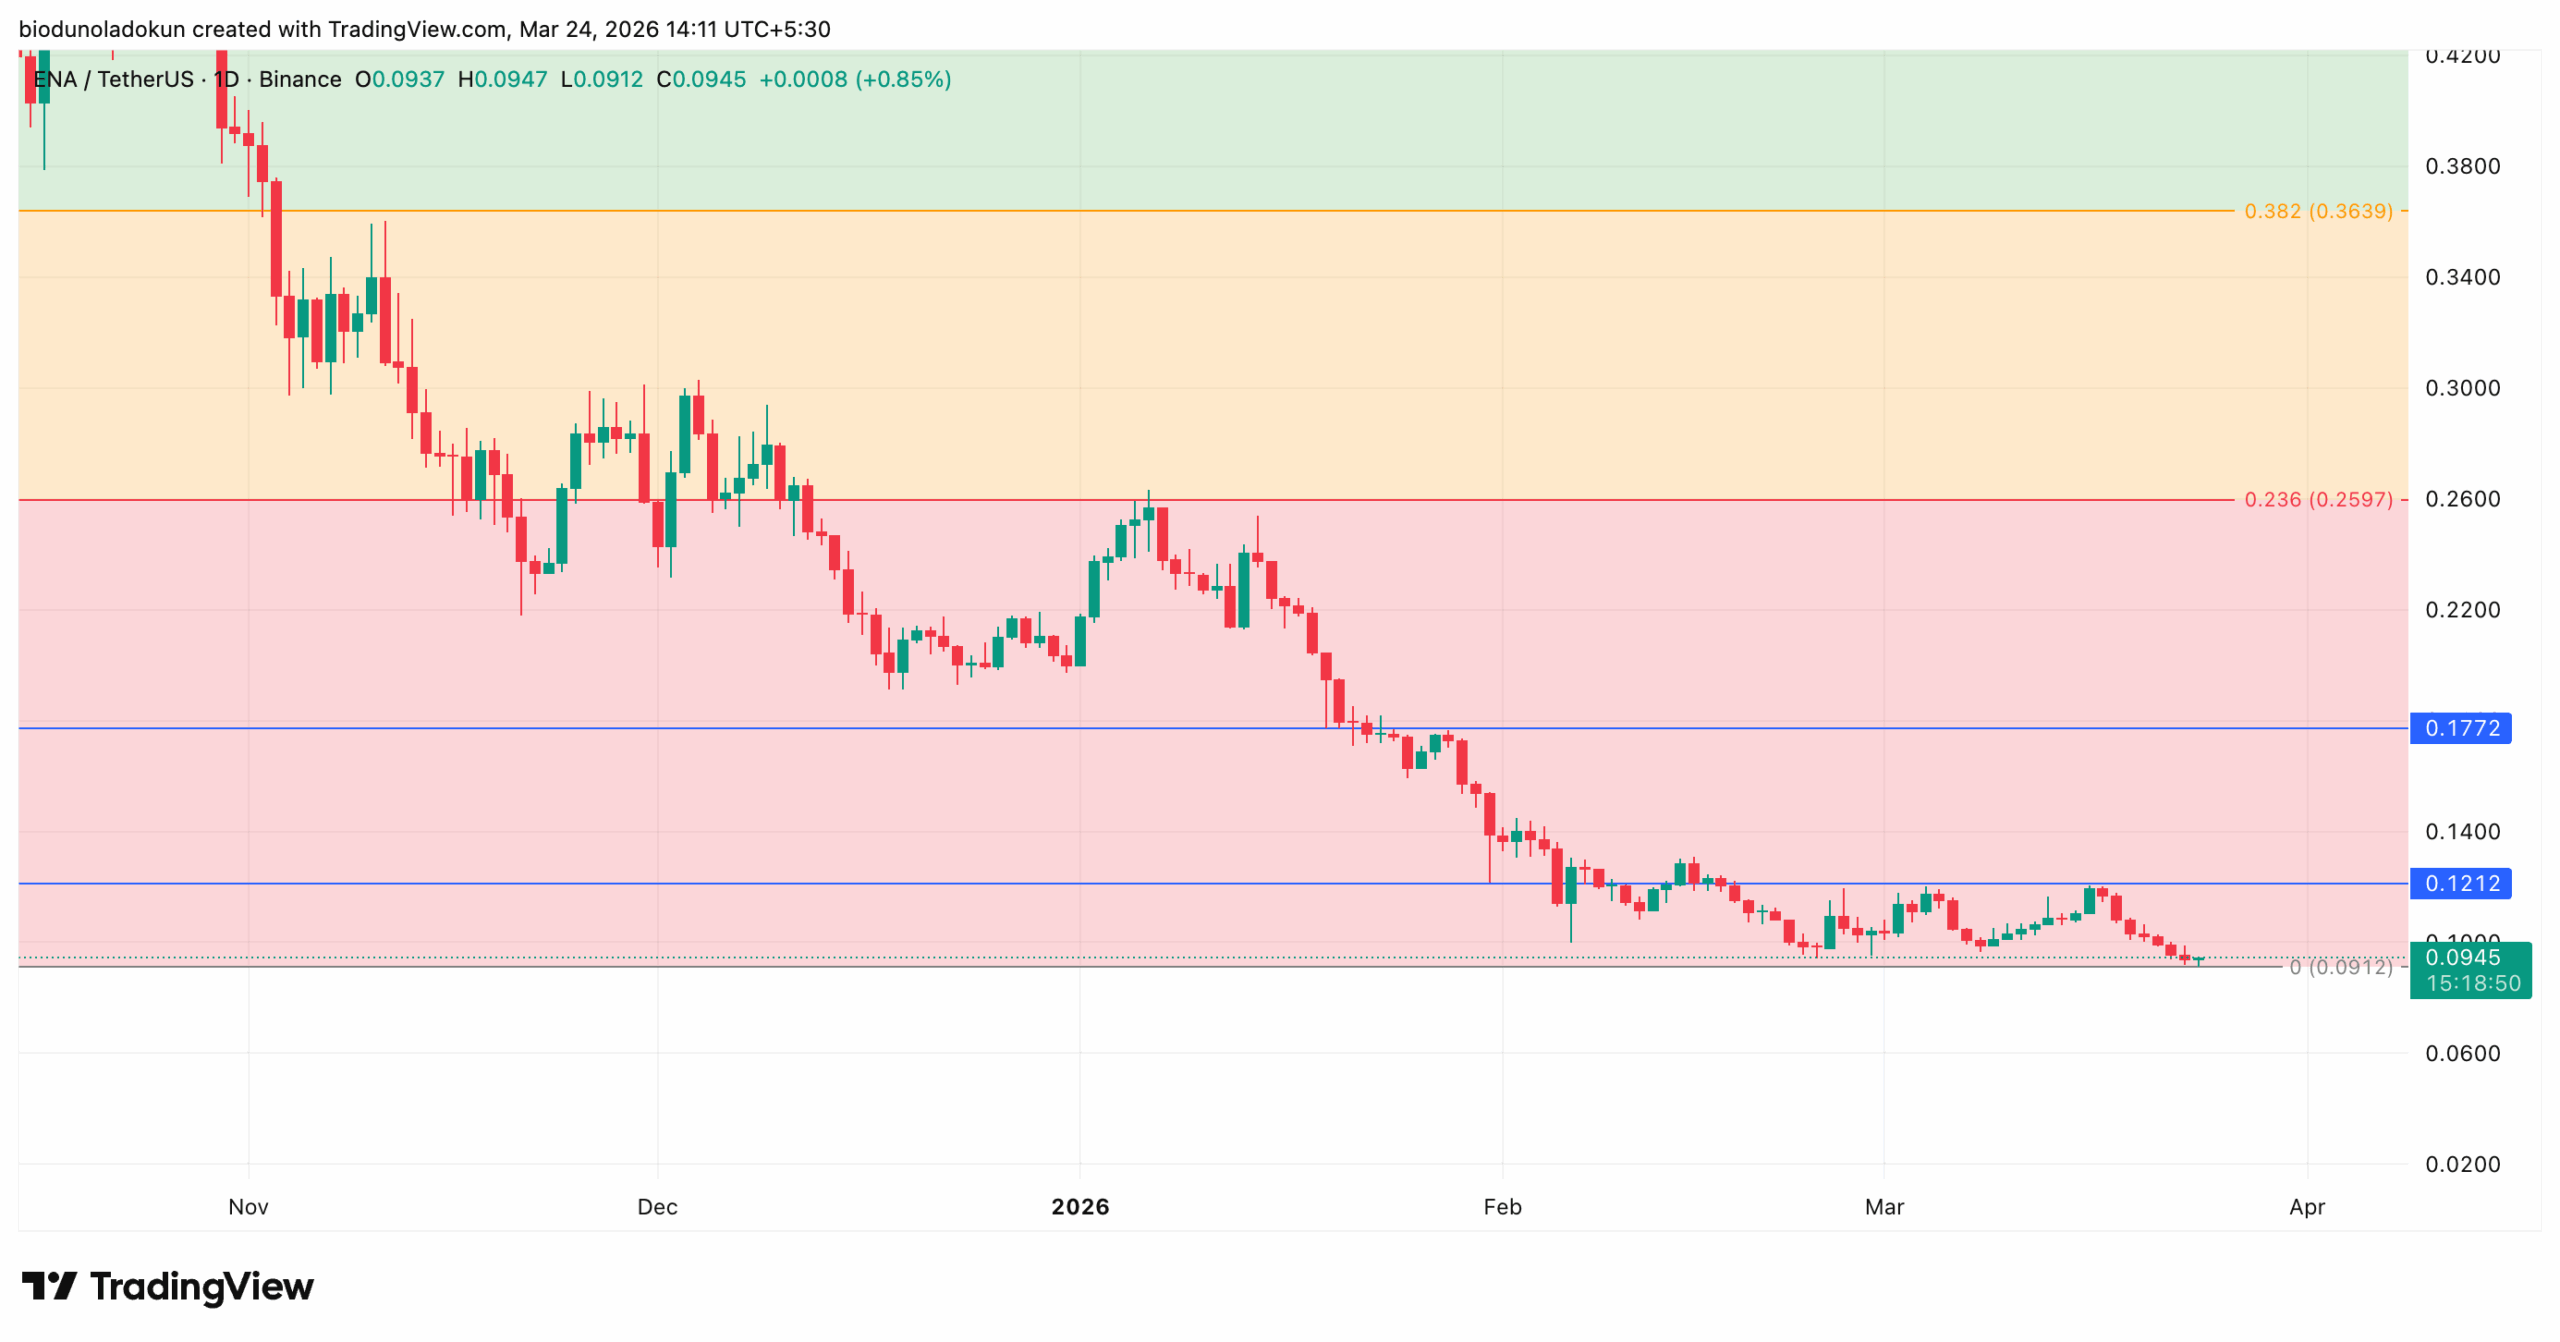
As of this writing, ENA trades at $0.09, down 2% over the past day. During that period, its trading volume has jumped by 178%, forming a negative divergence.
When an asset’s price declines while trading volume surges, it signals that sellers are in control and that the selling is happening with conviction.
High volume during a price drop indicates that sell-side pressure outweighs any demand entering the market.
This means the market at large is not responding to that whale signal with any corresponding demand. The whale may be accumulating, but sentiment across the market remains largely poor.
On the daily chart, ENA’s negative and plunging Chaikin Money Flow (CMF) confirms the lack of market-wide demand for the token.
As of this writing, this momentum indicator sits at -0.19, falling steadily as it trails ENA’s 20% price dip over the past week.
The CMF indicator measures the flow of money into and out of an asset over a given period. Positive values indicate that buying pressure is dominant and capital is flowing into the asset.
In contrast, negative values indicate that the bears are in control and liquidity is flowing out of the market.
When an asset’s price falls while its CMF is negative and declining — as with ENA — it means sellers are currently in control and that selling pressure is intensifying rather.
It signals that distribution is ongoing and that demand has not yet stepped in to absorb it.
For ENA holders, this means the whale withdrawal, while bullish in isolation, has not yet translated into the kind of broad market demand needed to reverse the current trend.
On-Chain Data Tells a Different Story, And It Is Bullish
While sentiment across ENA’s spot markets remains largely bearish, on-chain data suggests a near-term price recovery.
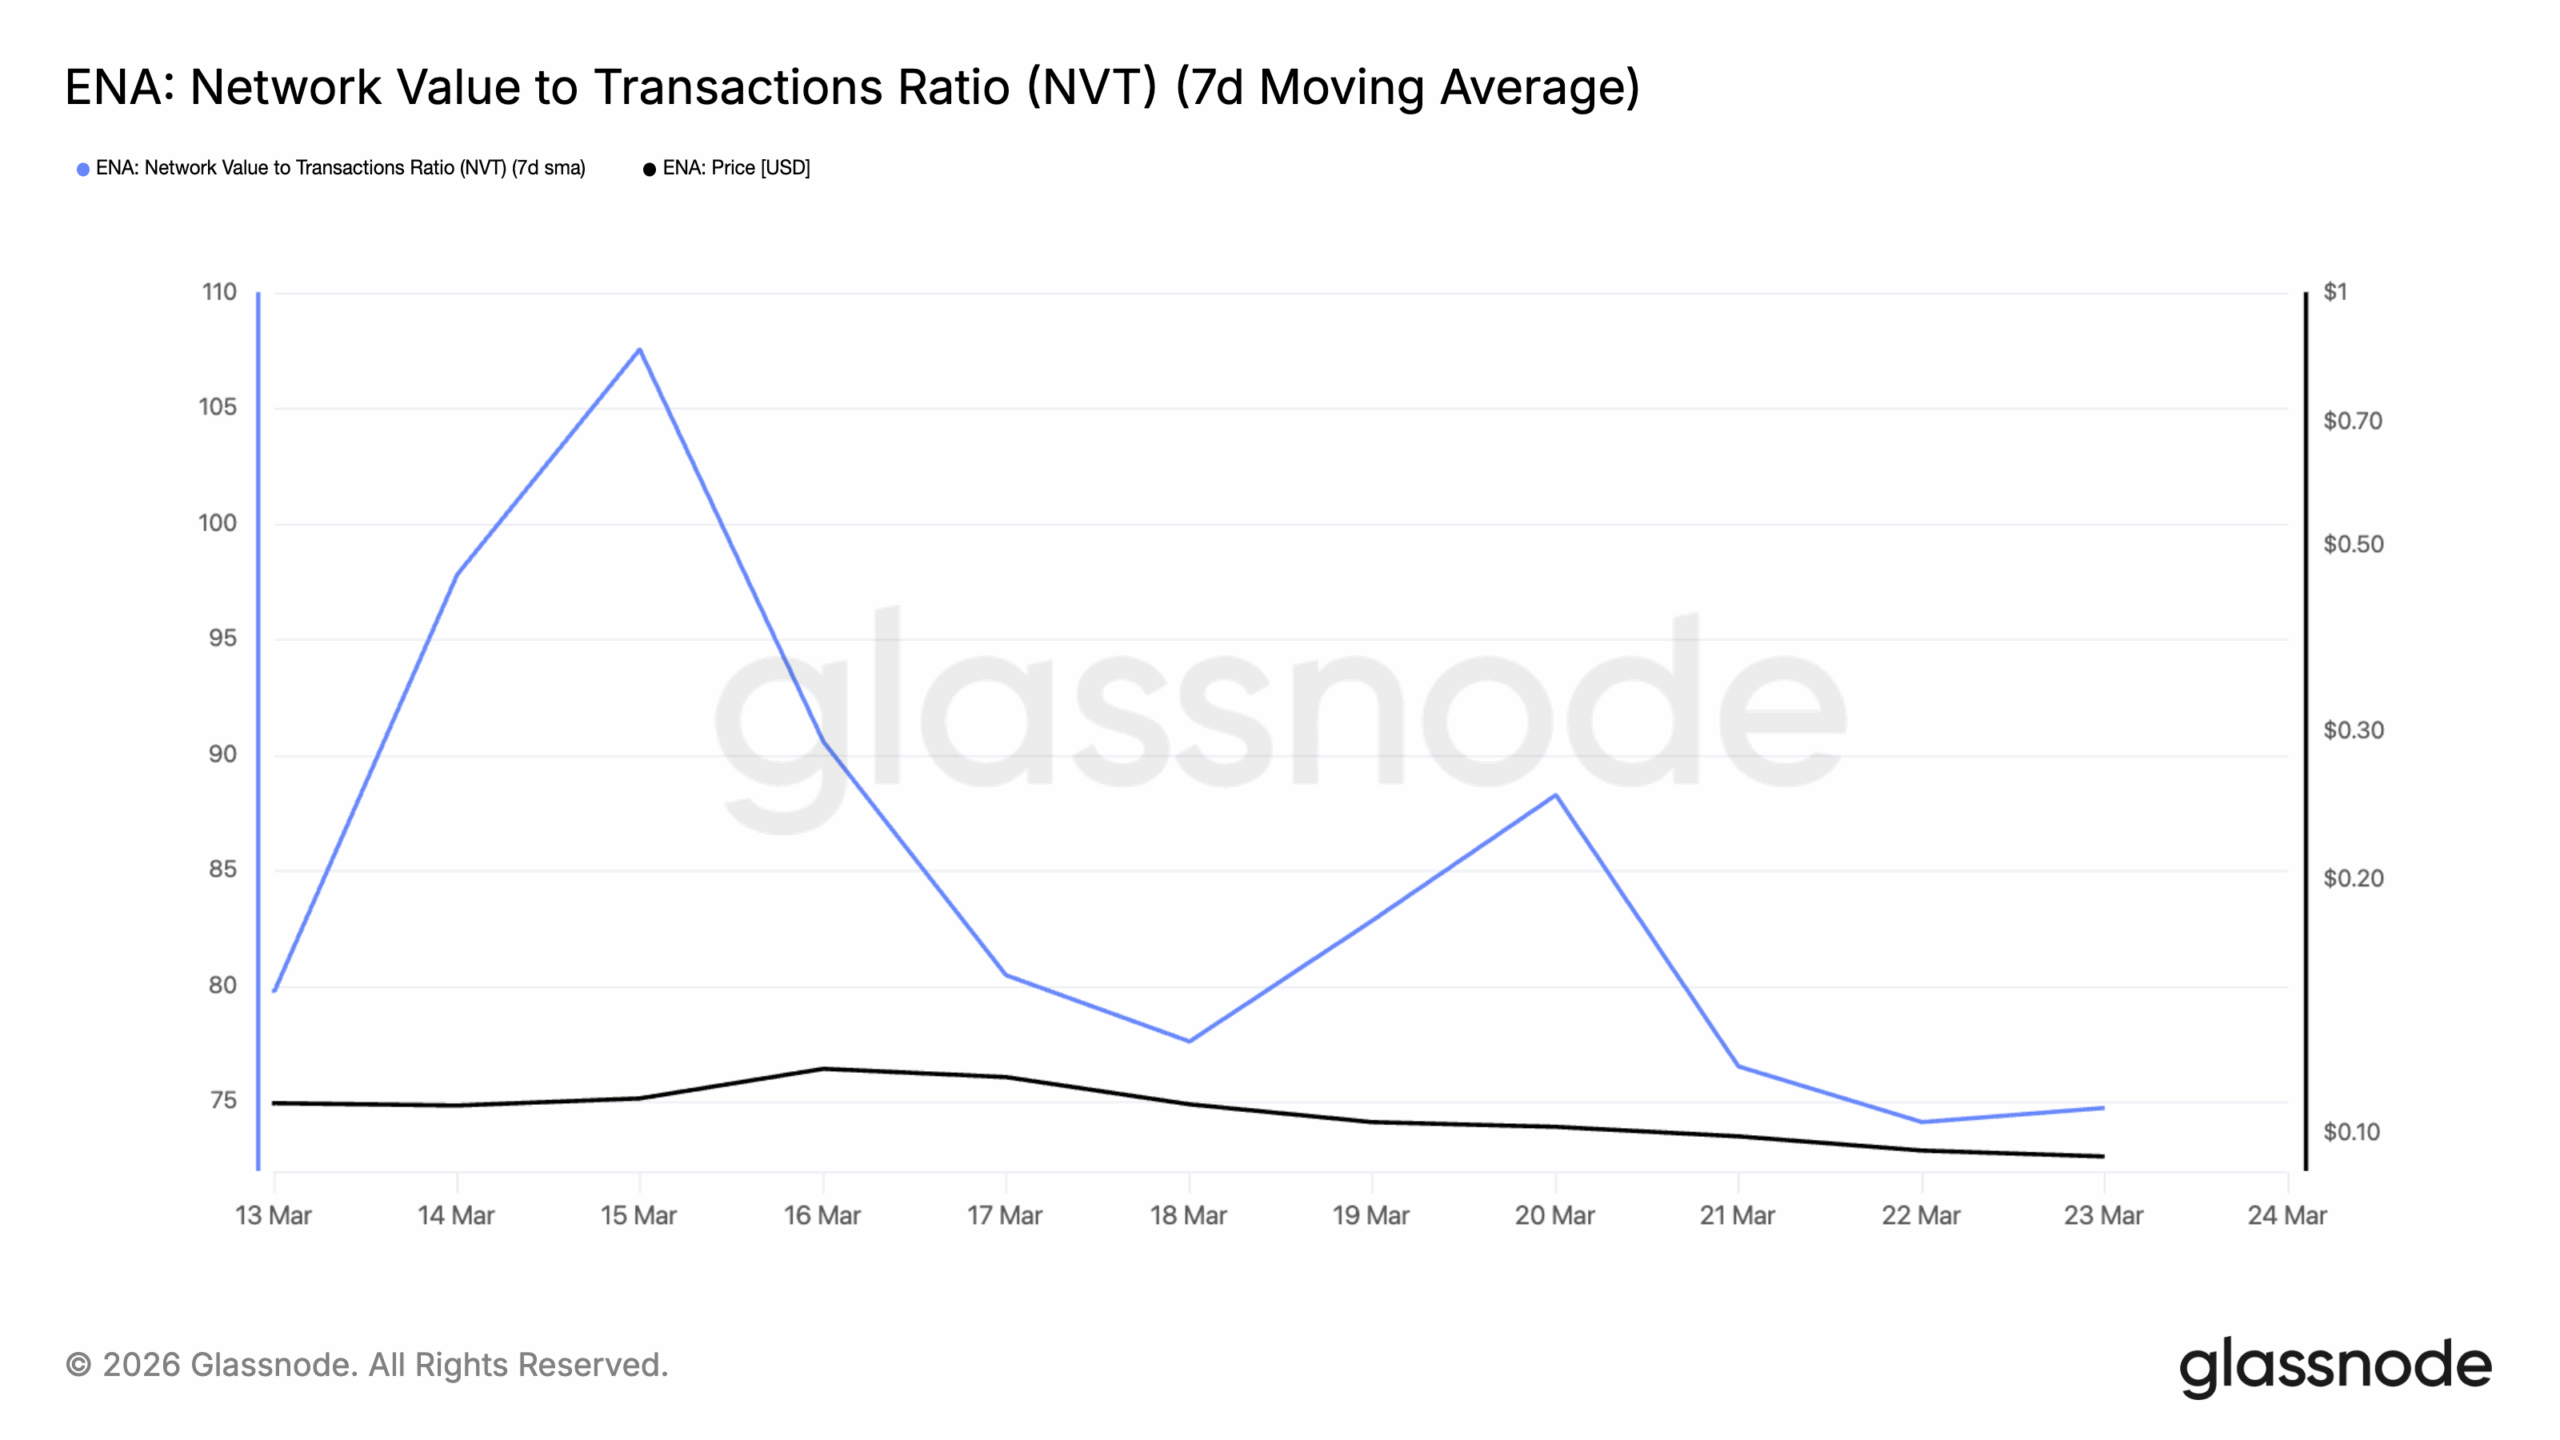
One key metric here is the token’s Network Value to Transactions (NVT) Ratio.
According to Glassnode, ENA’s NVT Ratio (using a 7-day simple moving average) has fallen significantly since its March 15 peak of 107, to 75 as of March 23.
The NVT ratio gauges whether an asset is overvalued or undervalued by comparing its market capitalization to transaction volume.
When the ratio spikes, it signals that an asset’s market capitalization is growing faster than the value being transacted on its network.
This trend normally precedes downward price corrections. The March 15 peak was an example of this, as the ENA price decline that has since followed confirms it.
On the other hand, when the NVT falls as it has over the past week, it signals that network transaction volume outpaces market capitalization growth, suggesting potential undervaluation at current price levels.
This presents a potentially attractive entry point for ENA holders and could be the foundation for a recovery if broader market demand returns to the token.
ENA’s Liquidation Heatmap Hints at a Short Squeeze
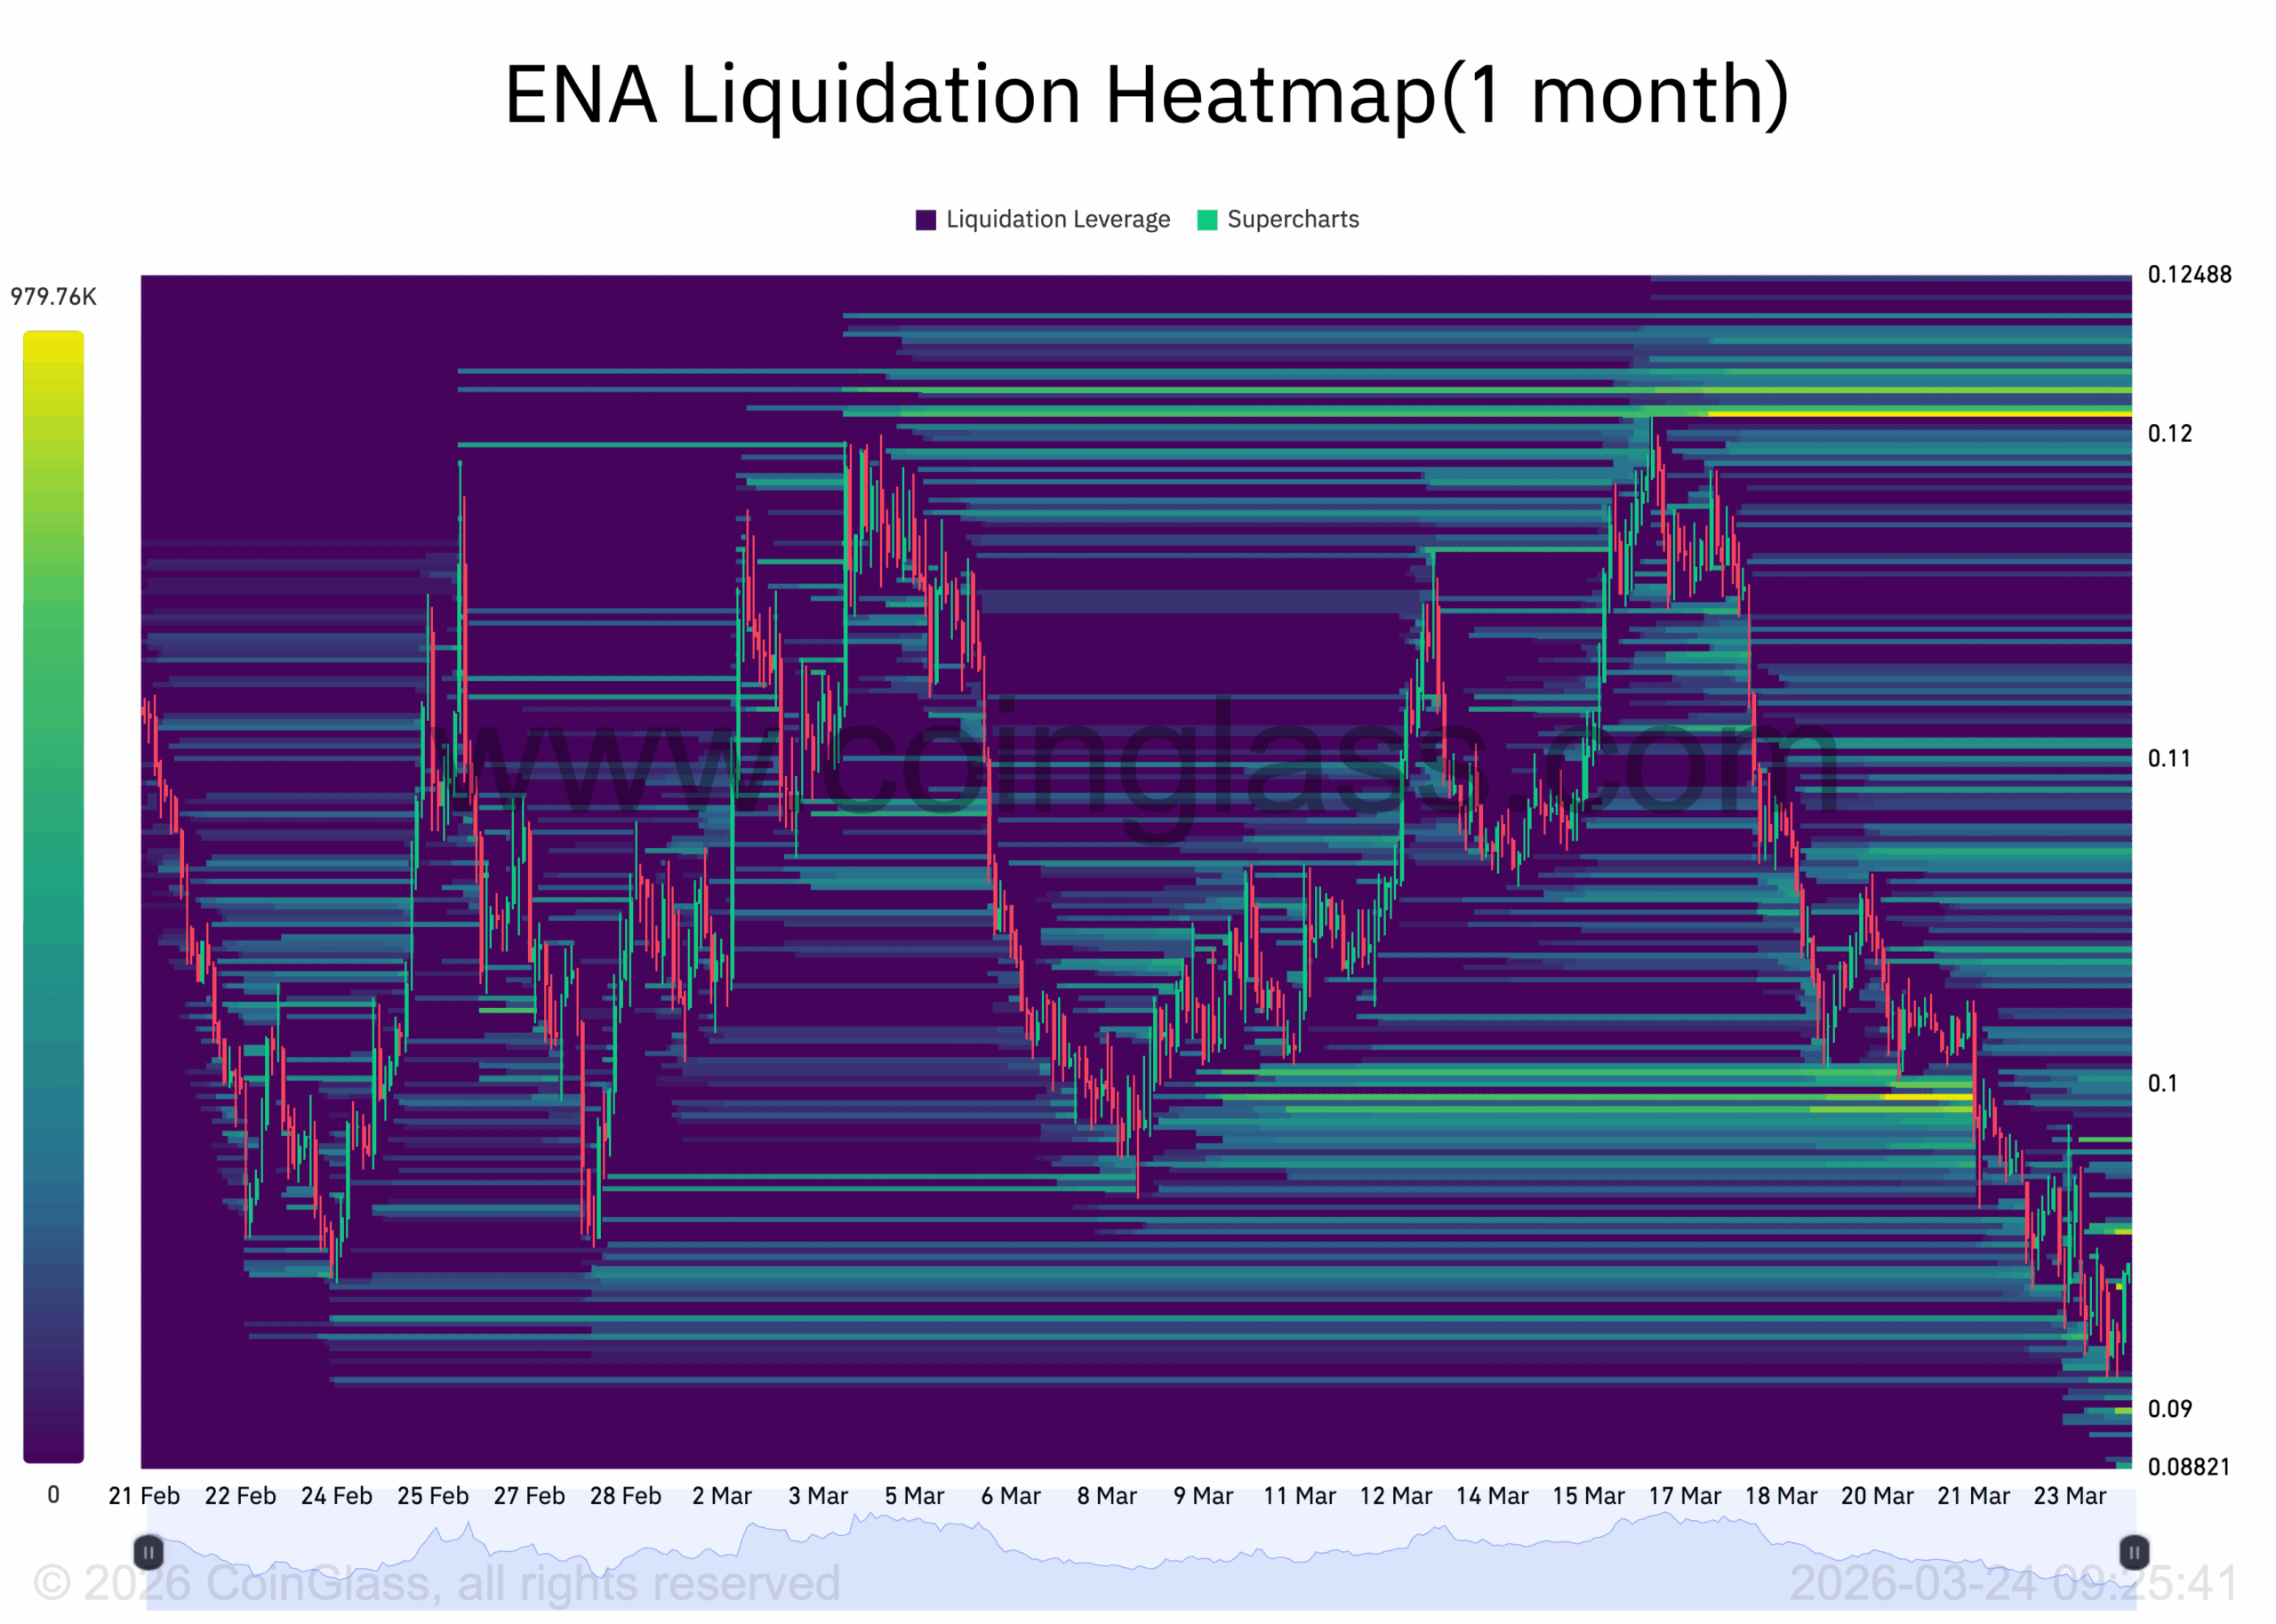
Readings from ENA’s liquidation heatmap also support the near-term bullish case.
According to Coinglass data, a dense cluster of liquidation has formed at $0.10 and $0.12, both above ENA’s current price of $0.09.
Liquidation heatmaps are visual tools traders use to identify price levels where large clusters of leveraged positions are likely to be liquidated.
The brighter and more intense the color at a given price level, the larger the concentration of leveraged positions that would be liquidated if the price reaches that zone.
Usually, these price zones act as magnets for price action, as the market tends to move toward these areas to trigger liquidations and open fresh positions.
With the $0.10 level as the immediate trigger point and $0.12 as the larger magnet above it, ENA’s heatmap suggests that if sentiment shifts, the short squeeze will amplify any move upward significantly.
ENA Touched an All-Time Low Today — What Happens Next
Readings from the ENA daily chart show it traded briefly at an all-time low of $0.092 earlier today.
While it has since rebounded to $0.094 as of this writing, the lack of strong buy-side pressure in ENA’s spot markets heightens the risk of an extended decline.
If sentiment remains poor, ENA could revisit the $0.092 low and attempt to fall below it.
However, a resurgence in new demand could prevent this from happening. In this scenario, ENA could rally past $0.12.
[You-may-like]
Disclaimer:
The information provided in this article is for informational purposes only. It is not intended to be, nor should it be construed as, financial advice. We do not make any warranties regarding the completeness, reliability, or accuracy of this information. All investments involve risk, and past performance does not guarantee future results. We recommend consulting a financial advisor before making any investment decisions.
Abiodun Oladokun is a Research Analyst at CCN, where he covers cryptocurrency markets with a focus on on-chain analysis, technical assessments, and emerging trends across decentralized finance (DeFi), real-world assets (RWA), artificial intelligence (AI), decentralized physical infrastructure networks (DePIN), Layer 2s, and meme coins.
Prior to CCN, he served as a Senior On-Chain Analyst at BeInCrypto, producing market reports spanning diverse crypto sectors.
Before that, he conducted technical analysis and market assessments of various altcoins at AMBCrypto, where he also contributed long-form quarterly research papers on DeFi, NFTs, DAOs, and scaling architectures, leveraging on-chain platforms including Messari, Santiment, DefiLlama, and Dune Analytics.
He began his crypto career as a research analyst at SixthSense DAO, developing blockchain forensic tools to trace the history of stolen assets.
Abiodun is a lawyer called to the Nigerian Bar and the founder of Ilé Ijó, a Lagos-based electronic dance music collective.